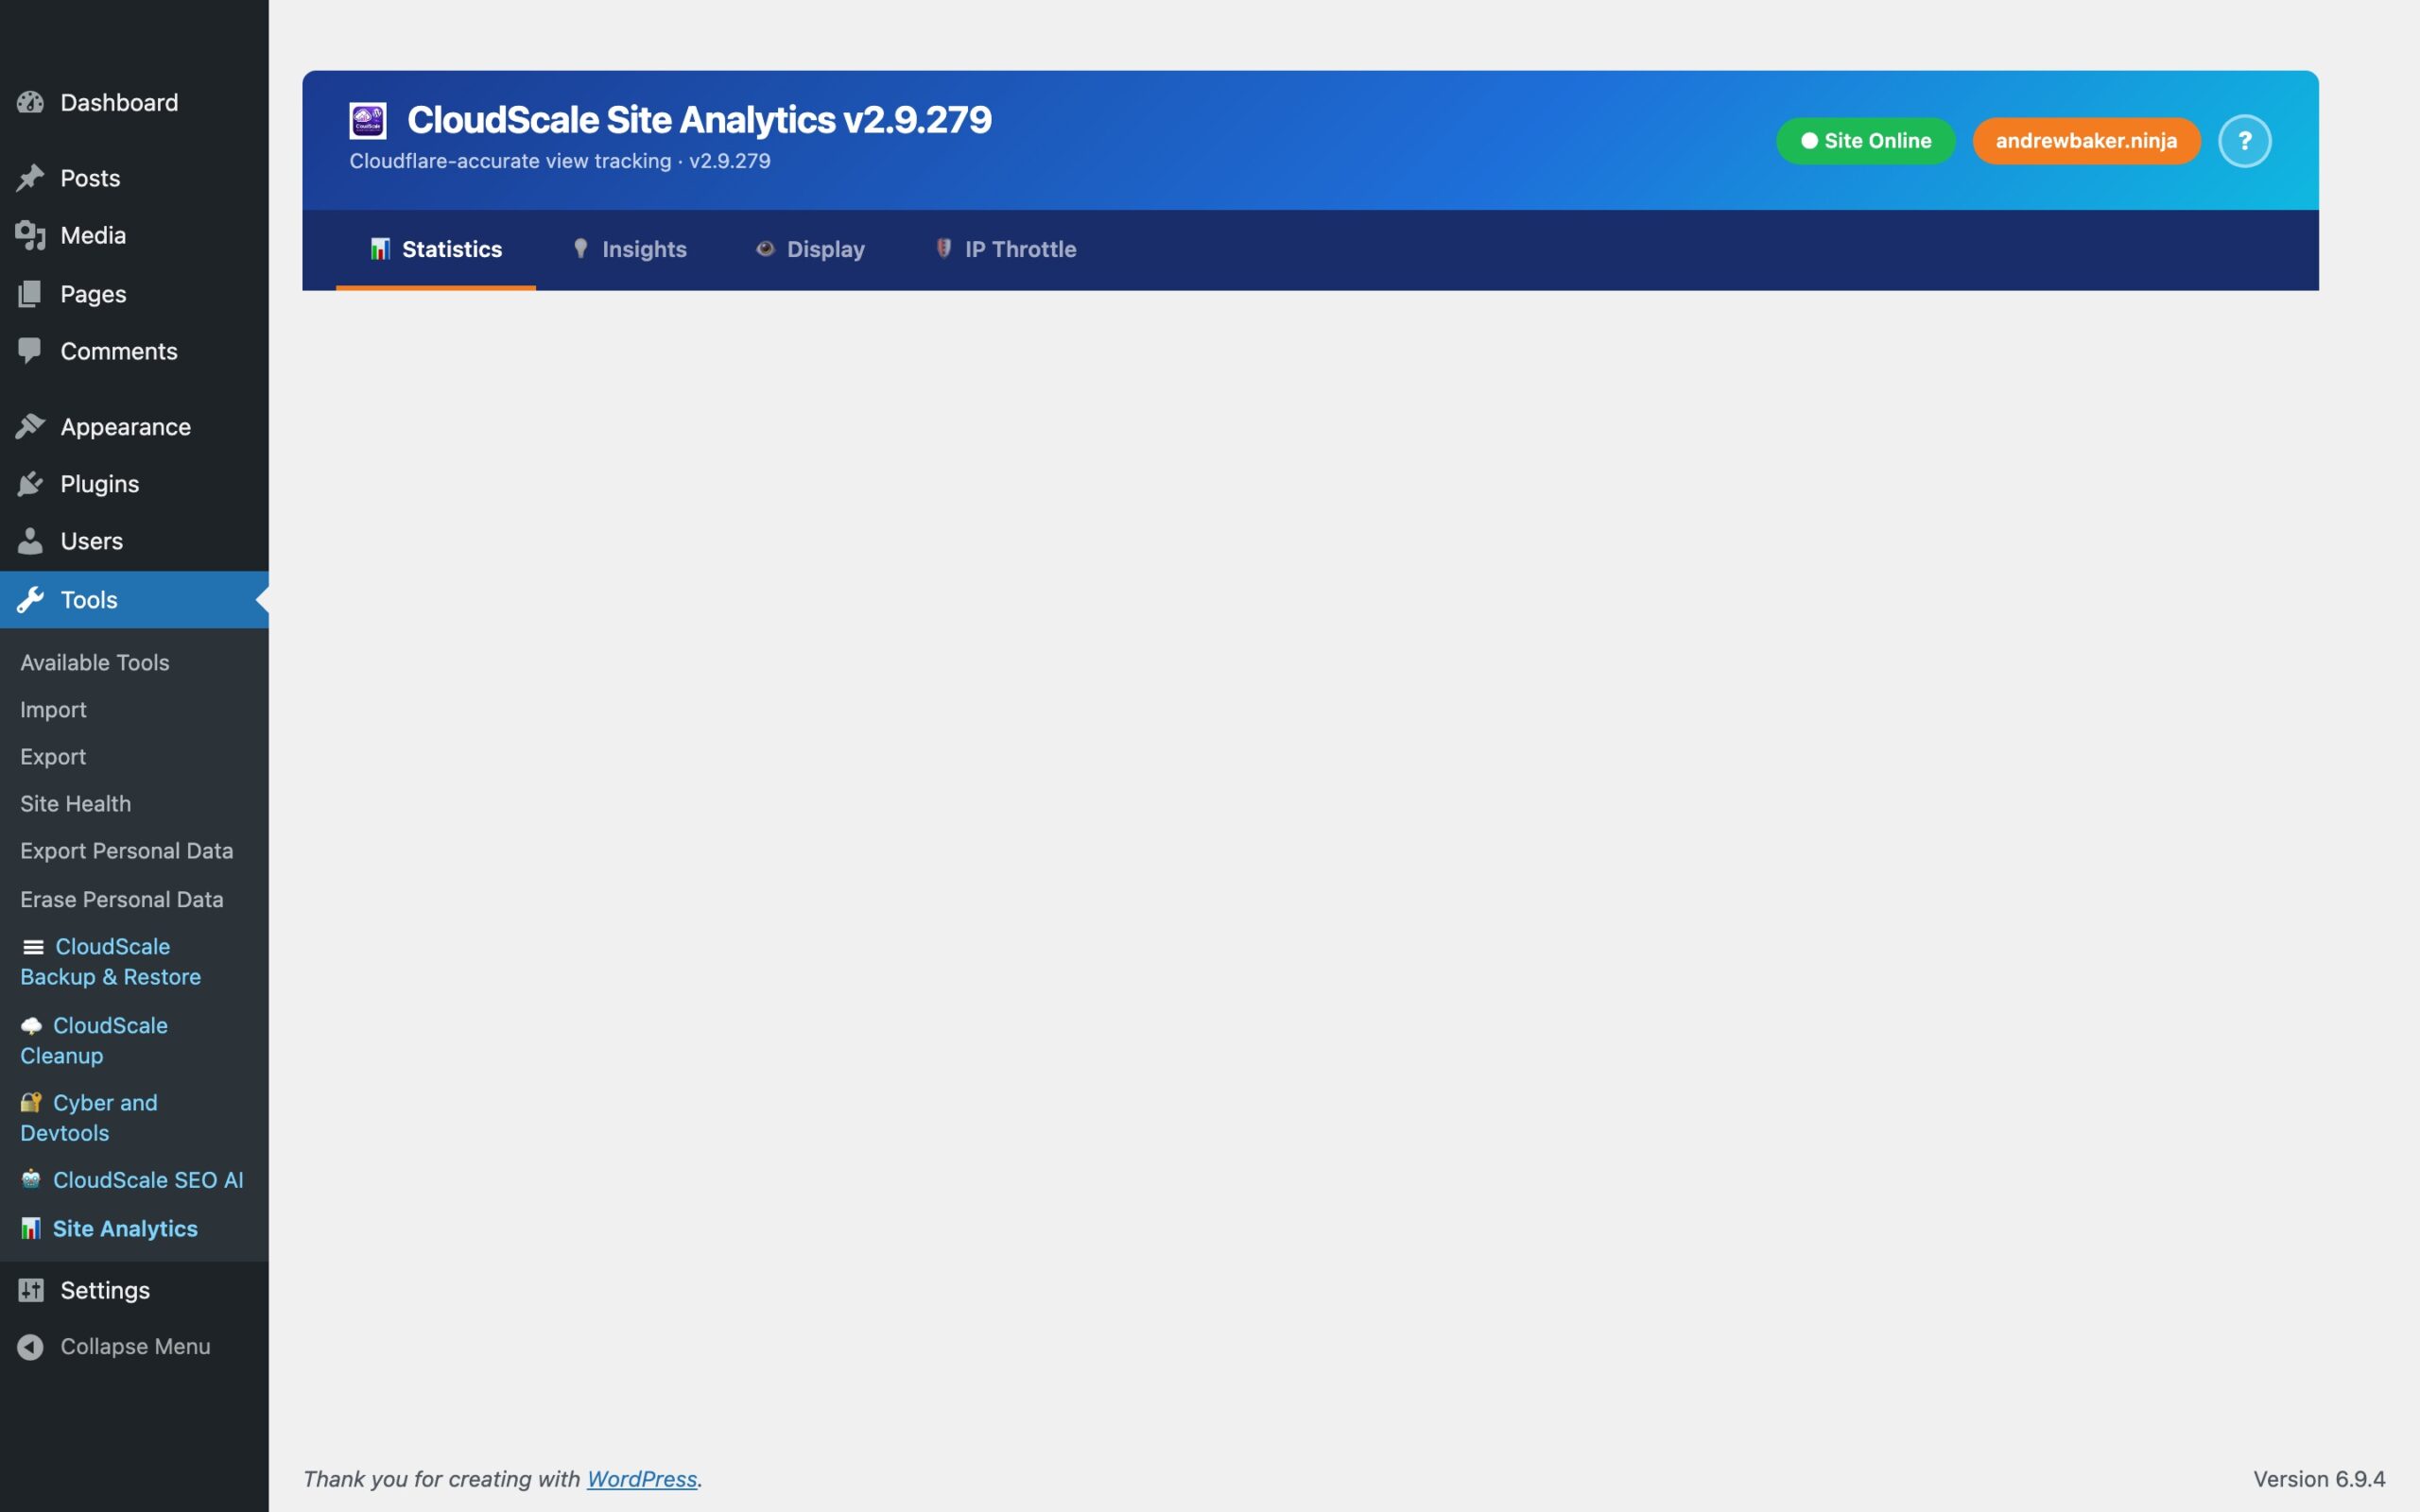
CloudScale Site Analytics — Free Privacy-First WordPress Analytics Plugin
← CloudScale WordPress Plugins
Why Your WordPress Analytics Are Lying to You
If your site runs behind Cloudflare, WP Rocket, or any caching plugin, server-side analytics see only the 5–20% of requests that reach PHP. The other 80–95% are served directly from cache and never counted. CloudScale fixes this with a JavaScript beacon that fires after the browser loads the page, regardless of where the HTML came from. Every real visit is counted.
| Feature | Google Analytics | Jetpack Stats | Server-side counters | CloudScale |
|---|---|---|---|---|
| Works behind Cloudflare/CDN | ✓ | ✗ | ✗ | ✓ |
| Data stays on your server | ✗ (Google) | ✗ (Automattic) | ✓ | ✓ |
| No cookie consent banner needed | ✗ | ✗ | ✓ | ✓ |
| View counts in posts list | ✗ | ✗ | ✗ | ✓ |
| Free, no subscription | Paid tiers | Paid tiers | ✓ | ✓ |
| Top pages per referrer drill-down | Custom reports | ✗ | ✗ | ✓ |
| Geography / country tracking | Requires consent | ✓ | ✗ | ✓ |
| 404 error log | Custom setup | ✗ | Log files only | ✓ |
| No external scripts loaded | ✗ (Google CDN) | ✗ (wp.com) | ✓ | ✓ |
| Open source | ✗ | ✗ | Varies | ✓ |
Setup checklist (5 minutes):
- Download and install the plugin: grab the zip from S3 (direct download) or clone from GitHub, then upload via Plugins → Add New → Upload Plugin. The beacon starts counting immediately on activation.
- Cloudflare Cache Rule: in your Cloudflare dashboard, create a Cache Rule: URI Path contains
/wp-json/cloudscale-wordpress-free-analytics/, Cache Status: Bypass. This is the critical step for CDN-accurate counting. - Test Cache Bypass: click the button on the Statistics tab to confirm the Cloudflare rule is working. A green badge means every visit will be counted.
- IP Throttle: enable bot protection and configure your deduplication window so repeat reloads don’t inflate counts.
- Top Posts widget: add it to your sidebar via Appearance > Widgets so readers can discover your most popular content.
WordPress Dashboard Widget
A compact widget on the WordPress admin dashboard showing today’s view count, a 5-period chart, and side-by-side lists of top posts and top referrers. Provides an at-a-glance summary without navigating to the full analytics page.
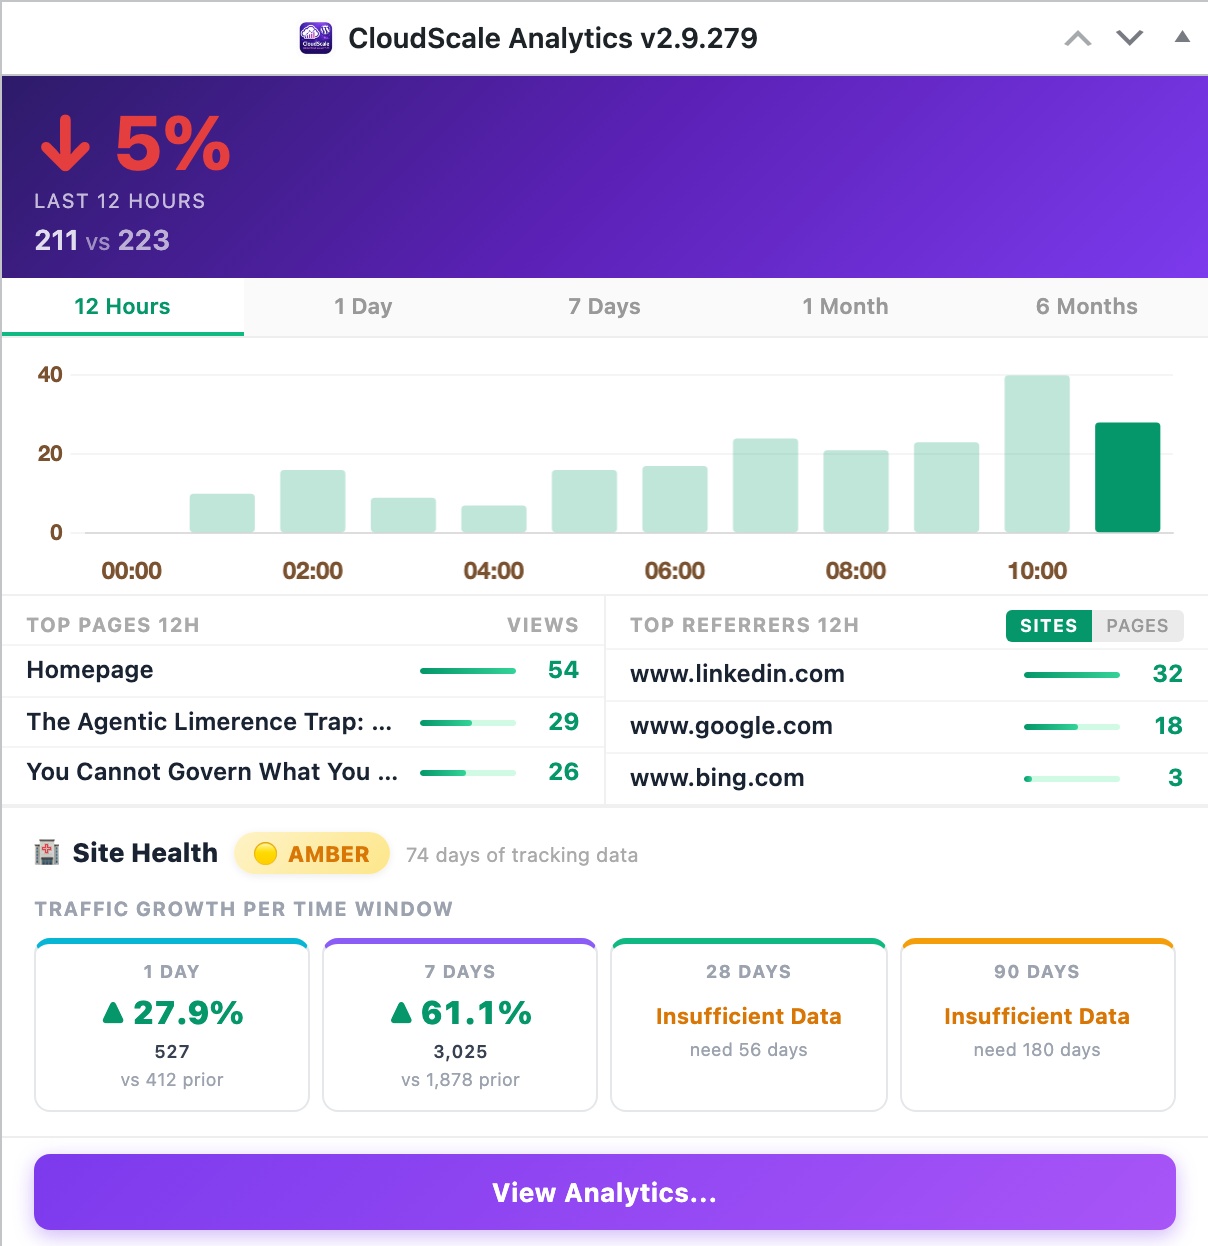
Once installed, CloudScale Site Analytics adds a CloudScale Page Views widget to your WordPress admin dashboard at Dashboard → Home. It gives you an at-a-glance summary of site traffic without leaving wp-admin.
Widget Layout
- Header banner: today’s total view count in large type (green), a delta badge comparing today vs yesterday (↑ growing, ↓ declining), and the 7-day total — all on a purple-to-violet gradient background.
- Period chart: a compact Chart.js line chart showing traffic over the selected period. Click the period buttons — 12h · 1d · 7d · 1mo · 6mo — to switch the chart window. The chart re-renders immediately with no page reload.
- Top Posts / Top Referrers: two side-by-side columns showing the top 3 posts and top 3 referrer domains for today. Each post links to the edit screen. The referrer toggle switches between Host (domain only) and Page (full referring URL).
- View Full Analytics: a CTA button at the bottom links directly to the full Statistics Dashboard.
The widget is visible only to users with the manage_options capability (administrators by default). Data is loaded inline from the same database tables used by the full analytics page — no additional HTTP requests, no third-party calls.
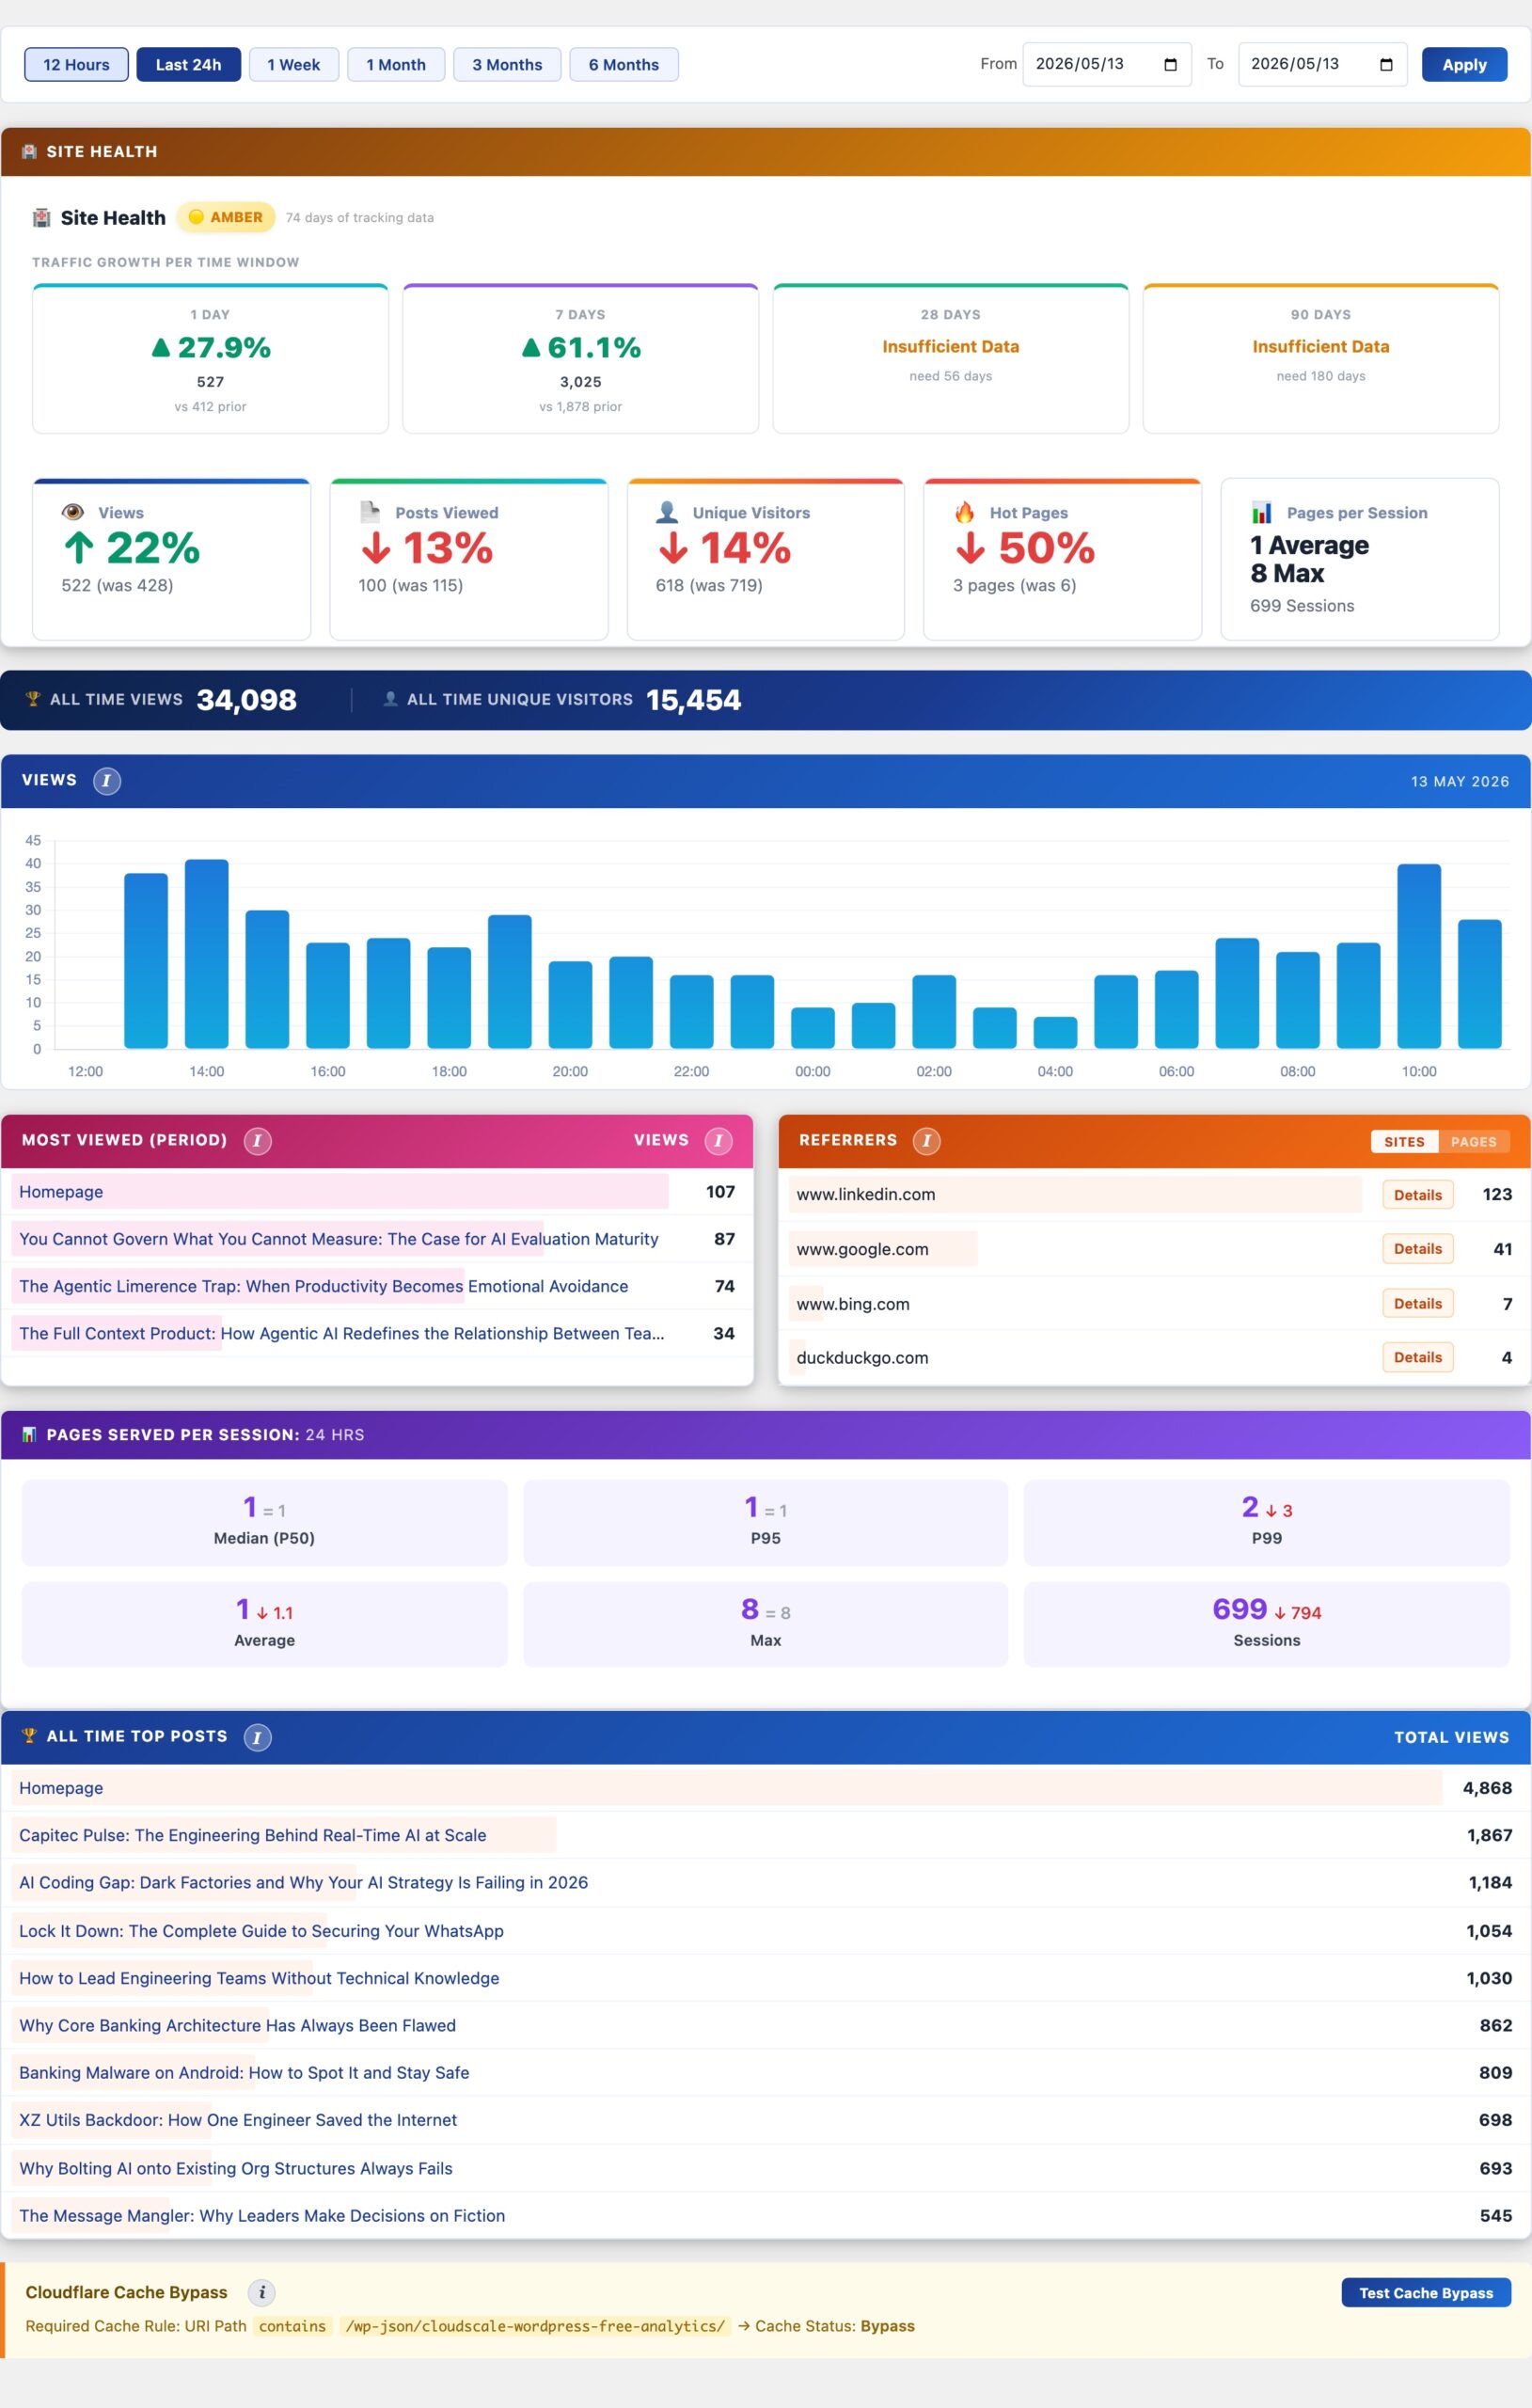
Statistics Dashboard
The main analytics dashboard showing site health status, page views over time, top posts, referrer sources, and a Cloudflare cache bypass tester. All data is stored in your own WordPress database with no data sent to any third party.
Why CloudScale Site Analytics?
If your site runs behind Cloudflare, WP Rocket, or any other caching layer, server-side analytics see only the 5–20% of requests that reach PHP. Your stats are wrong by a factor of 5 to 10.
CloudScale solves this with a JavaScript beacon that fires after the browser loads the page, regardless of where the HTML came from. The beacon POSTs to a REST endpoint that bypasses the CDN cache, so every real visit is counted. You finally see your actual traffic.
Unlike Google Analytics or Jetpack, your visitor data never leaves your server. No third-party scripts, no tracking pixels, no GDPR headaches from external data processors. IP addresses are hashed before storage; the raw IP is never written to the database.
It is completely free. No premium tier. No per-site fees. Install it, add one Cloudflare Cache Rule, and your stats are accurate from the first pageview.
Site Health
At the top of the Statistics tab, the Site Health panel shows a RAG (Red/Amber/Green) status across four rolling windows — 1 Day, 7 Days, 28 Days, and 90 Days. Each window shows a view count and a percentage change vs the equivalent preceding period: e.g. +12% on 28 Days means 12% more views than the previous 28-day window. Green = growing, amber = flat or slight decline, red = declining. The overall badge summarises all four windows at a glance. Shows Awaiting Data until sufficient tracking history has been collected.
The Statistics Dashboard shows page view data stored directly in your WordPress database across five custom tables (wp_cspv_views_v2, wp_cspv_referrers_v2, wp_cspv_geo_v2, wp_cspv_visitors_v2, wp_cspv_404_v2). No data is ever sent to Google, Facebook, or any external service.
How tracking works: A lightweight beacon.js script fires a POST request to the WordPress REST API endpoint /wp-json/cloudscale-wordpress-free-analytics/v1/record/{post_id} after the page has fully loaded. Because this is a fresh HTTP request rather than a cached response, it reaches WordPress even when Cloudflare or another CDN is serving the cached HTML page. This is why beacon-based tracking counts every real visit, whereas server-side counters miss 80–95% of views on cached sites.
Views, Top Posts and Referrers
- Period selector: switch between Today, 7 days, 30 days, 90 days, and All time. Each period queries the
wp_cspv_views_v2table directly; no aggregation tables are needed. - Totals bar: Total Views, Unique Posts Viewed, and Lifetime totals pulled in a single indexed query on
viewed_at. - Views chart: daily bar chart. Gaps indicate days with zero traffic, not missing data.
- Most Viewed (Period): top posts ranked by view count for the selected period, with direct edit links.
- Referrers: parsed from the
document.referrervalue sent by the beacon and stored inwp_cspv_referrers_v2. Toggle between Sites (referrer domain) and Pages (full referring URL). Direct traffic with no referrer appears as “Direct”. Click any referrer domain to see a Top Pages breakdown: which of your posts and pages that source sent the most traffic to, with view counts and a Copy button.
All Time Top Posts
A separate ranked table showing lifetime view counts across all time, independent of the period selector. Includes imported Jetpack view counts blended with live beacon data if you migrated from Jetpack Stats. Useful for identifying your most valuable evergreen content.
Cloudflare Cache Bypass
An interactive test panel that verifies your Cloudflare Cache Rule is correctly configured to bypass caching for the beacon REST endpoint. Without this rule, Cloudflare caches the REST responses and beacon POSTs fail silently; your view counts appear to record but nothing is actually written.
Required Cache Rule: In your Cloudflare dashboard, go to Caching, then Cache Rules, and create a rule: URI Path contains /wp-json/cloudscale-wordpress-free-analytics/, Cache Status: Bypass.
Click Test Cache Bypass to send a probe request through the beacon endpoint and check whether the response has the expected headers. A green status badge confirms Cloudflare is bypassing the cache correctly; a red badge means the rule is missing or misconfigured.
Download & Source Code
Direct download (S3): cloudscale-wordpress-free-analytics.zip — always the latest stable release. Upload via Plugins → Add New → Upload Plugin in wp-admin.
Source code (GitHub): github.com/andrewbakercloudscale/wordpress-free-analytics — MIT licensed, issues and pull requests welcome.
Geography
An interactive world map showing where your visitors come from, built from country data captured at the time of each beacon hit. Supports drill-down to city level for any country.
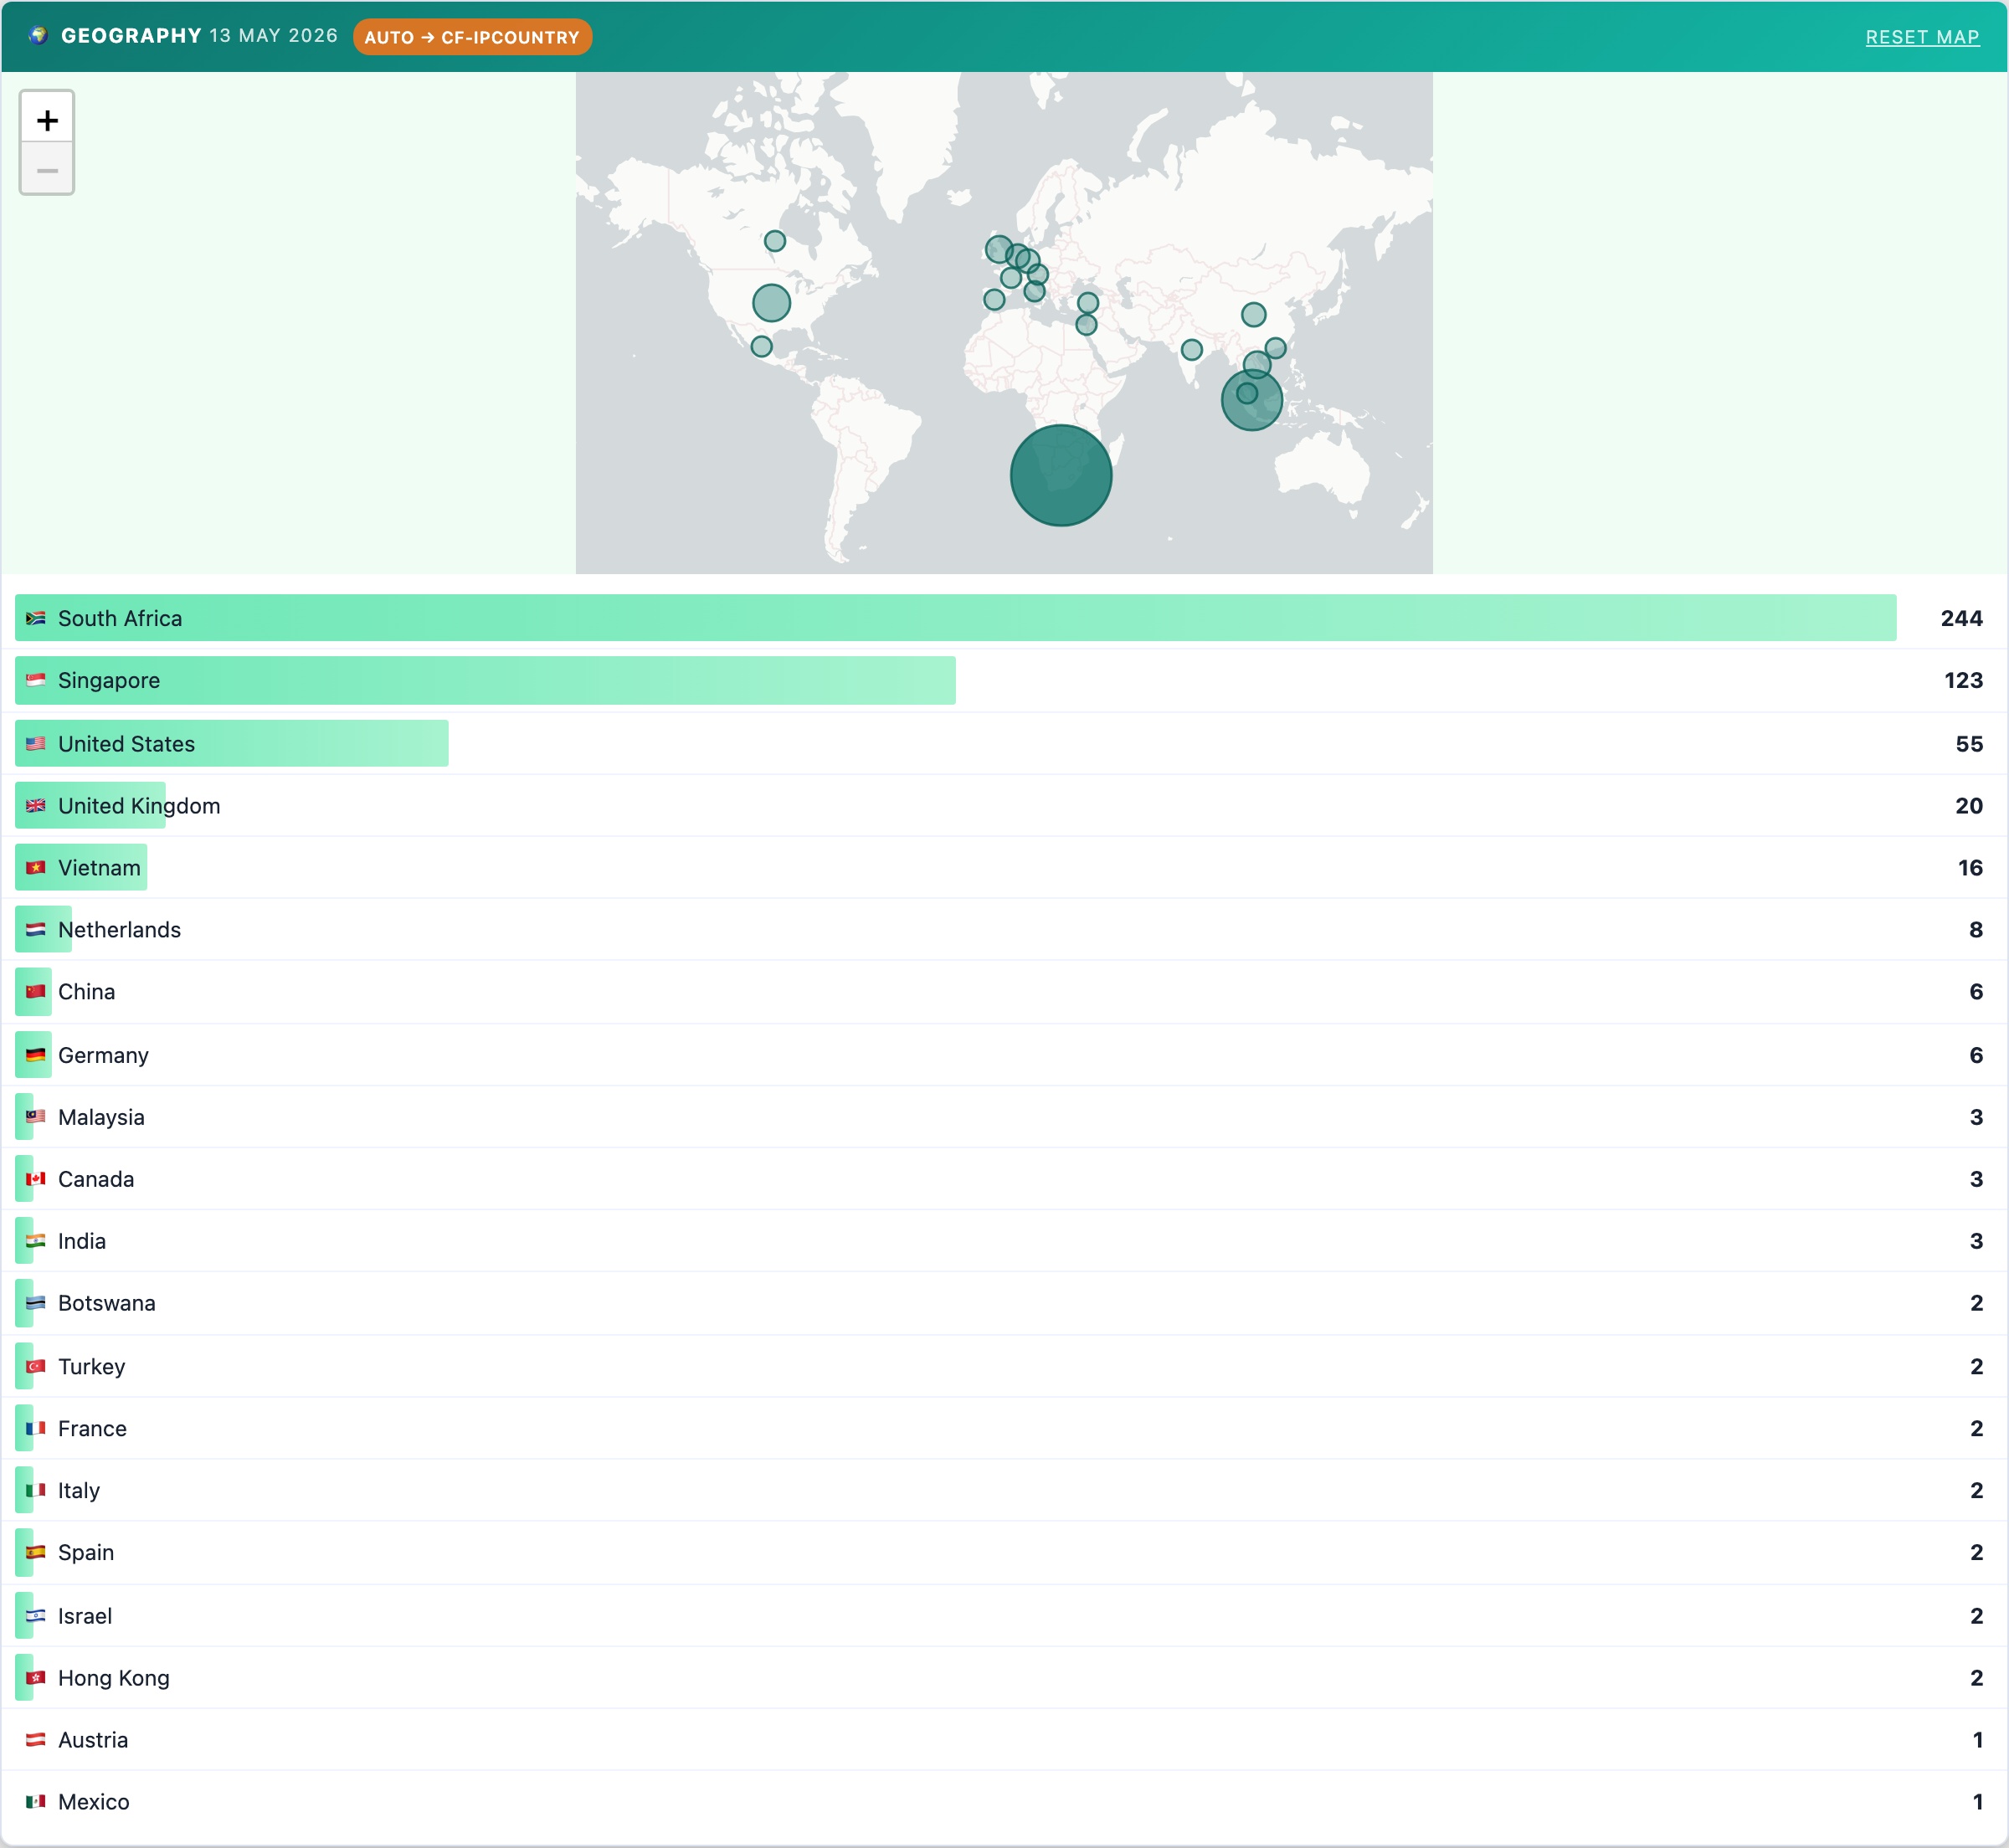
An interactive world map showing where your visitors come from, powered by data stored in wp_cspv_geo_v2. Country-level tracking is built into the beacon; no third-party geolocation service is used.
- World map: bubble markers sized by relative visit volume. Click any country bubble to drill down to a city-level breakdown for that country.
- Country list: ranked list of countries with visit counts for the selected period, shown below the map.
- Reset Map: clears any active country drill-down and returns to the full world view.
The geography date range matches your currently selected period (Today, 7 days, 30 days, etc.). Country data is captured via the Cloudflare CF-IPCountry header when available; otherwise the plugin uses the DB-IP Lite database or falls back to the site’s configured geo source. Configure this in the Display Settings tab under Geography Source.
404 Error Log
Tracks every 404 (page not found) response on your site, with the requested URL, referring source, and timestamp. Use this to find broken inbound links and set up 301 redirects before they cost you rankings.
The 404 Error Log tracks every page-not-found response served by your site and stores the requested URL, HTTP referrer, and timestamp in wp_cspv_404_v2.
- Requested URL: the path that returned a 404, shown as a relative URL. Repeated entries for the same path indicate a persistent broken link worth redirecting.
- Source: the referring domain or page that sent the visitor to the missing URL. Direct means no referrer — typed URL, bookmark, or email link.
- Timestamp: when the 404 occurred. Sort by most recent or filter by date range to focus on recent breakage.
- Clear Log: removes all stored 404 entries. Use after you have actioned the redirects so the log only shows new breakage going forward.
How to use it: export or note the highest-frequency 404 paths, then add 301 redirects in your .htaccess, nginx config, or a redirect plugin. Fixing high-traffic 404s preserves link equity, improves user experience, and stops crawl budget being wasted on dead URLs.
Privacy: IP addresses are hashed with SHA-256 combined with your wp_salt before storage. The raw IP is never written to the database.
Display Settings
Controls where view count badges appear on your posts, the visual style and colour of counters, which post types are tracked, and the geography source configuration.
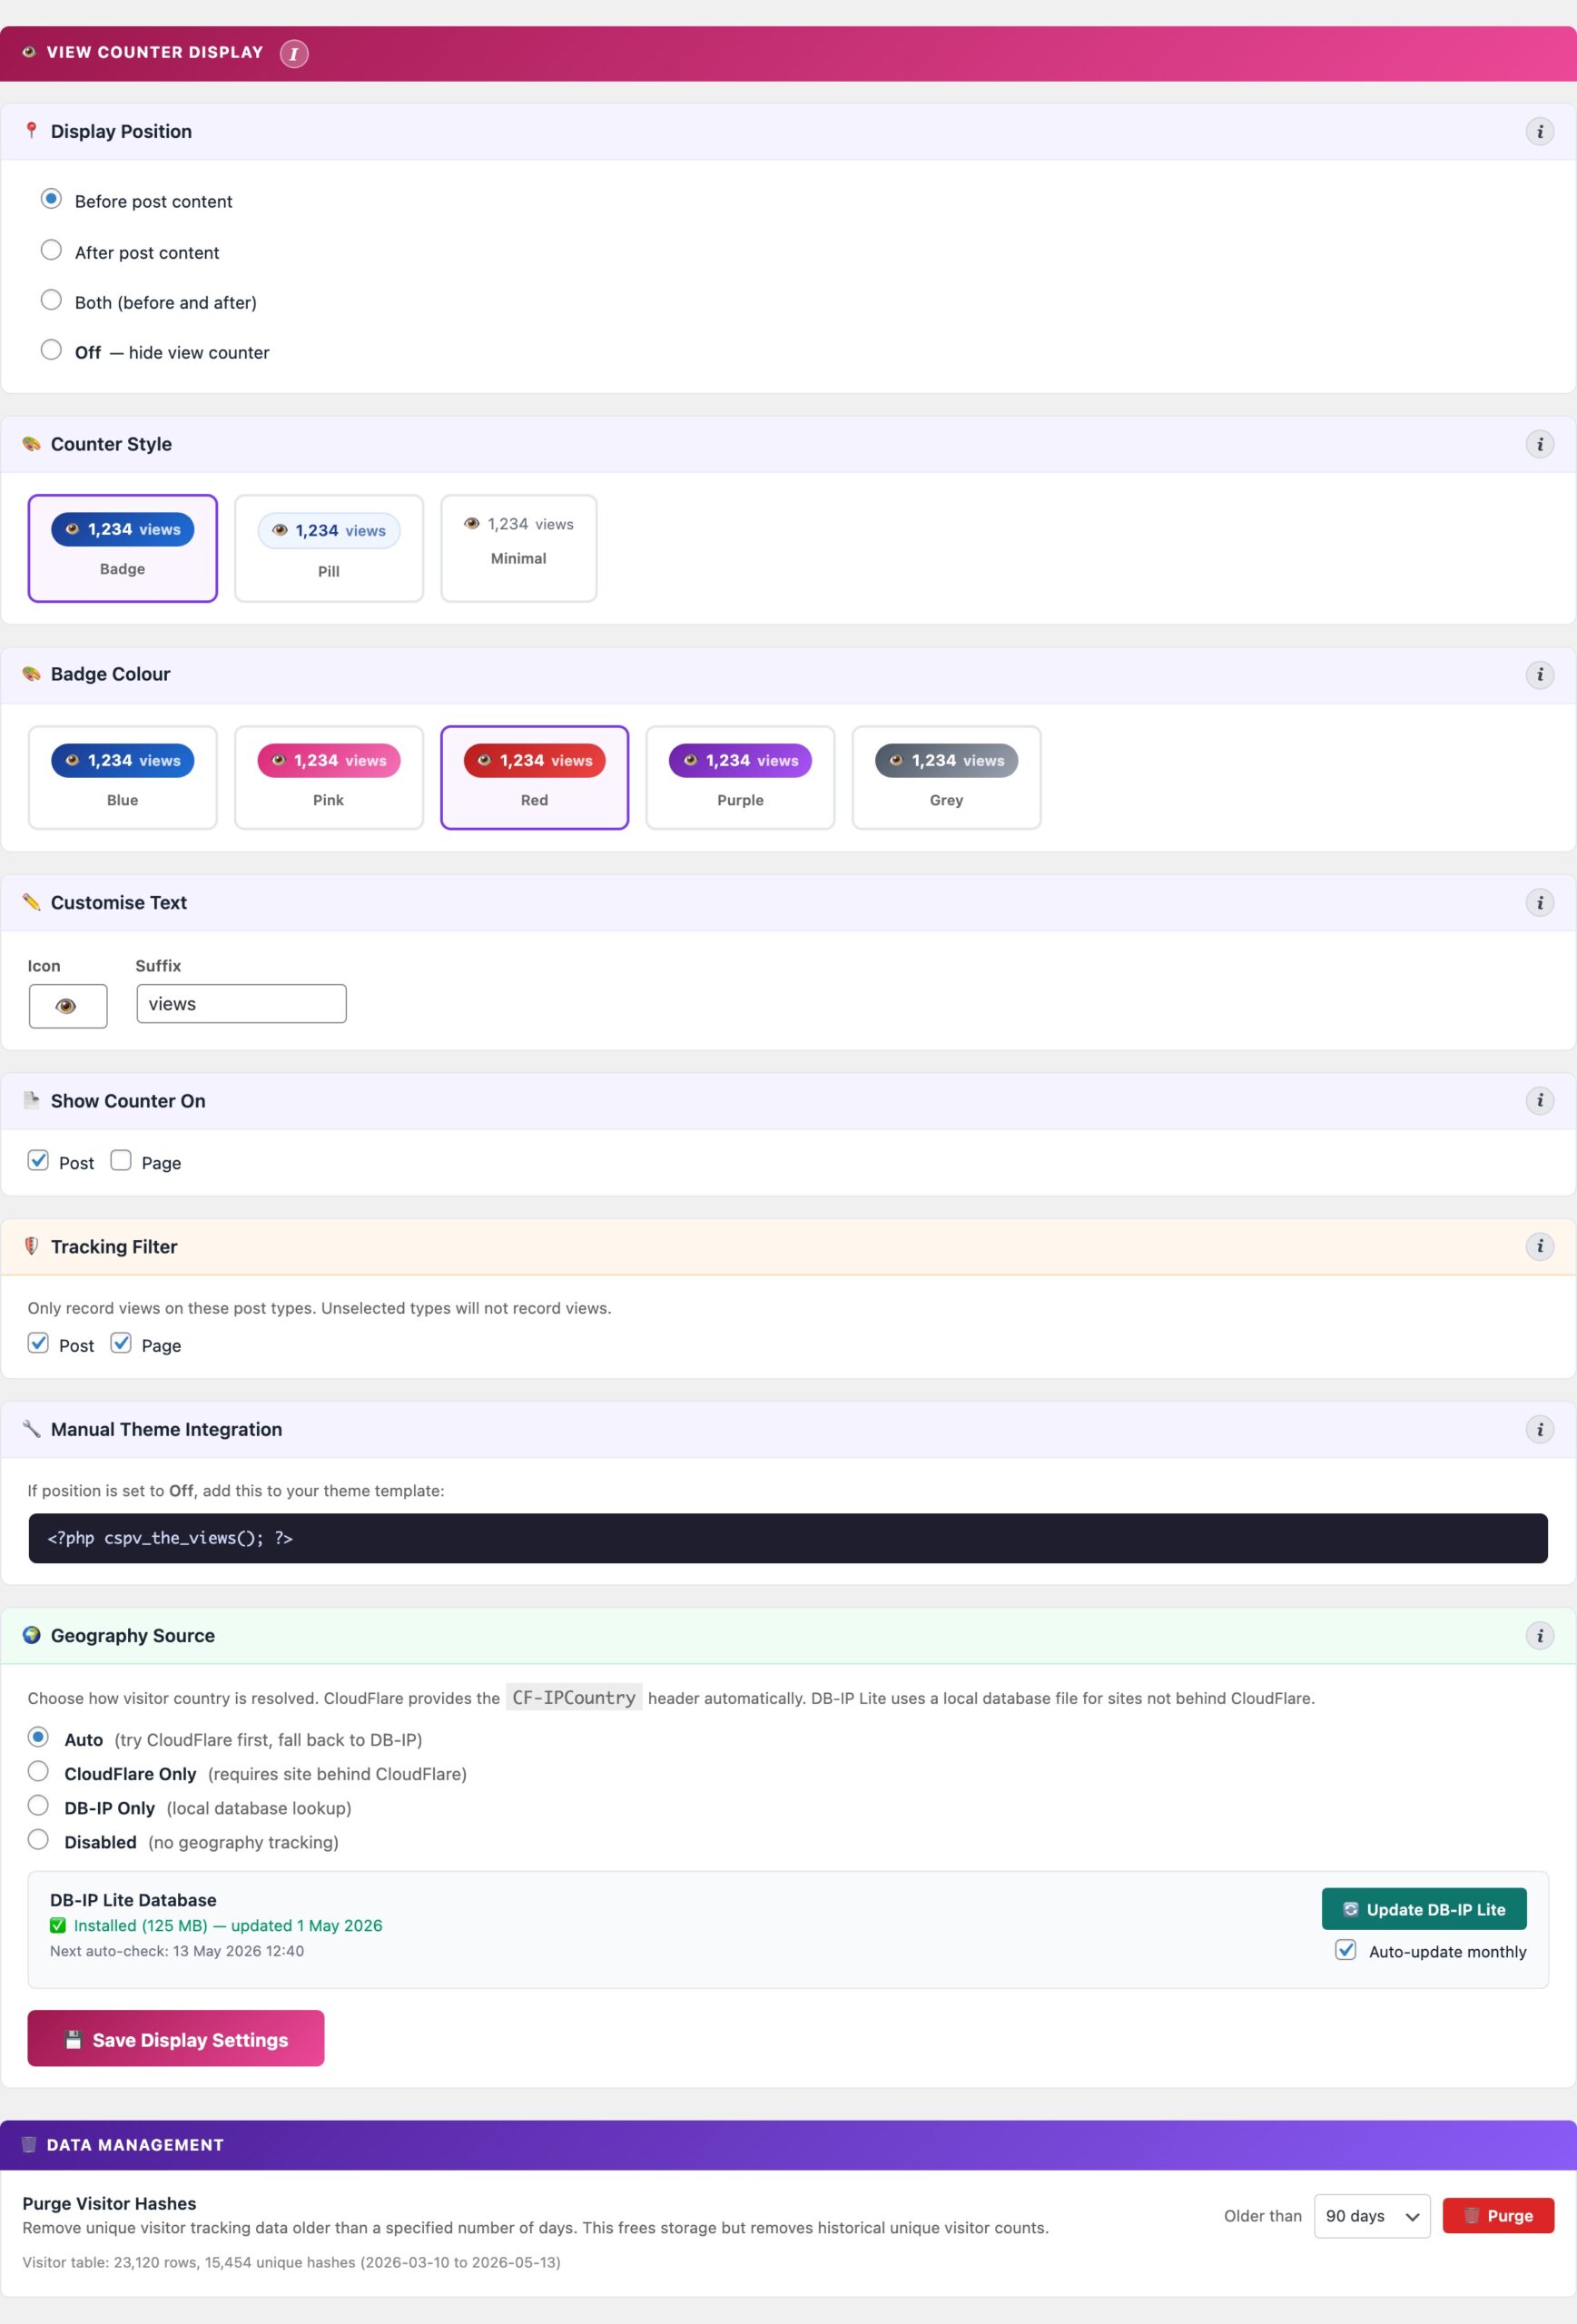
The Display Settings tab controls how view counts appear on your site, configures the sidebar widgets, and provides data management tools.
View Counter Display
- Display position: before post content, after post content, both, or off. The count is read from the
_cspv_view_countpost meta key, which is synced fromwp_cspv_views_v2on each beacon hit. - Counter style: choose between Badge (coloured pill with gradient), Pill (outlined), or Minimal (plain text). Five colour options: blue, pink, red, purple, grey.
- Icon and suffix: customise the icon character (default: 👁) and the text that follows the count (default: “views”).
- Post types to display on: which post types show the view counter. Unselected types will not display the badge.
- Post types to track: which post types fire the beacon and record views. Useful for excluding WooCommerce products, landing pages, or other post types you don’t want counted.
Widgets
- Top Posts widget: register via Appearance > Widgets or the block widget editor. Queries
wp_cspv_views_v2for a configurable view window (default: all time). Settings: total posts to pool (default 10), posts per page, thumbnail width, and sort order (most viewed or most recent). - Recent Posts widget: shows the most recently published posts with view counts. Configurable post count and optional publication date display.
Geography Source
Controls how visitor country is resolved for the geography map and country breakdown.
- Auto: tries Cloudflare first (zero performance cost), then falls back to DB-IP if the CF-IPCountry header is absent. Recommended for most sites.
- Cloudflare Only: uses only the
CF-IPCountryheader. Fast and accurate but requires your site to be proxied through Cloudflare. - DB-IP Only: always uses the local database file. Works without Cloudflare but adds a small lookup overhead per request.
- Disabled: skips geography tracking entirely. The map and country stats will show no data.
The DB-IP Lite database (~30 MB) is stored in your uploads folder and updates monthly. Click Download DB-IP to install or refresh it.
Data Management
The Purge Visitor Hashes tool removes historical unique visitor tracking data from the wp_cspv_visitors_v2 table older than a selected threshold (30, 60, 90, 180 days, 1 year, or all data). This table records hashed IP addresses for deduplication and throttle checks; it grows indefinitely unless periodically purged.
Purging old visitor hashes frees database storage but removes the ability to deduplicate views from that period retroactively. View counts already recorded in wp_cspv_views_v2 are not affected. The panel shows the current row count and date range before you purge.
IP Throttle
Four panels for keeping your stats accurate: automatic bot blocking by request rate, client and server-side view deduplication, blocked IP management, and an emergency switch to pause all tracking.
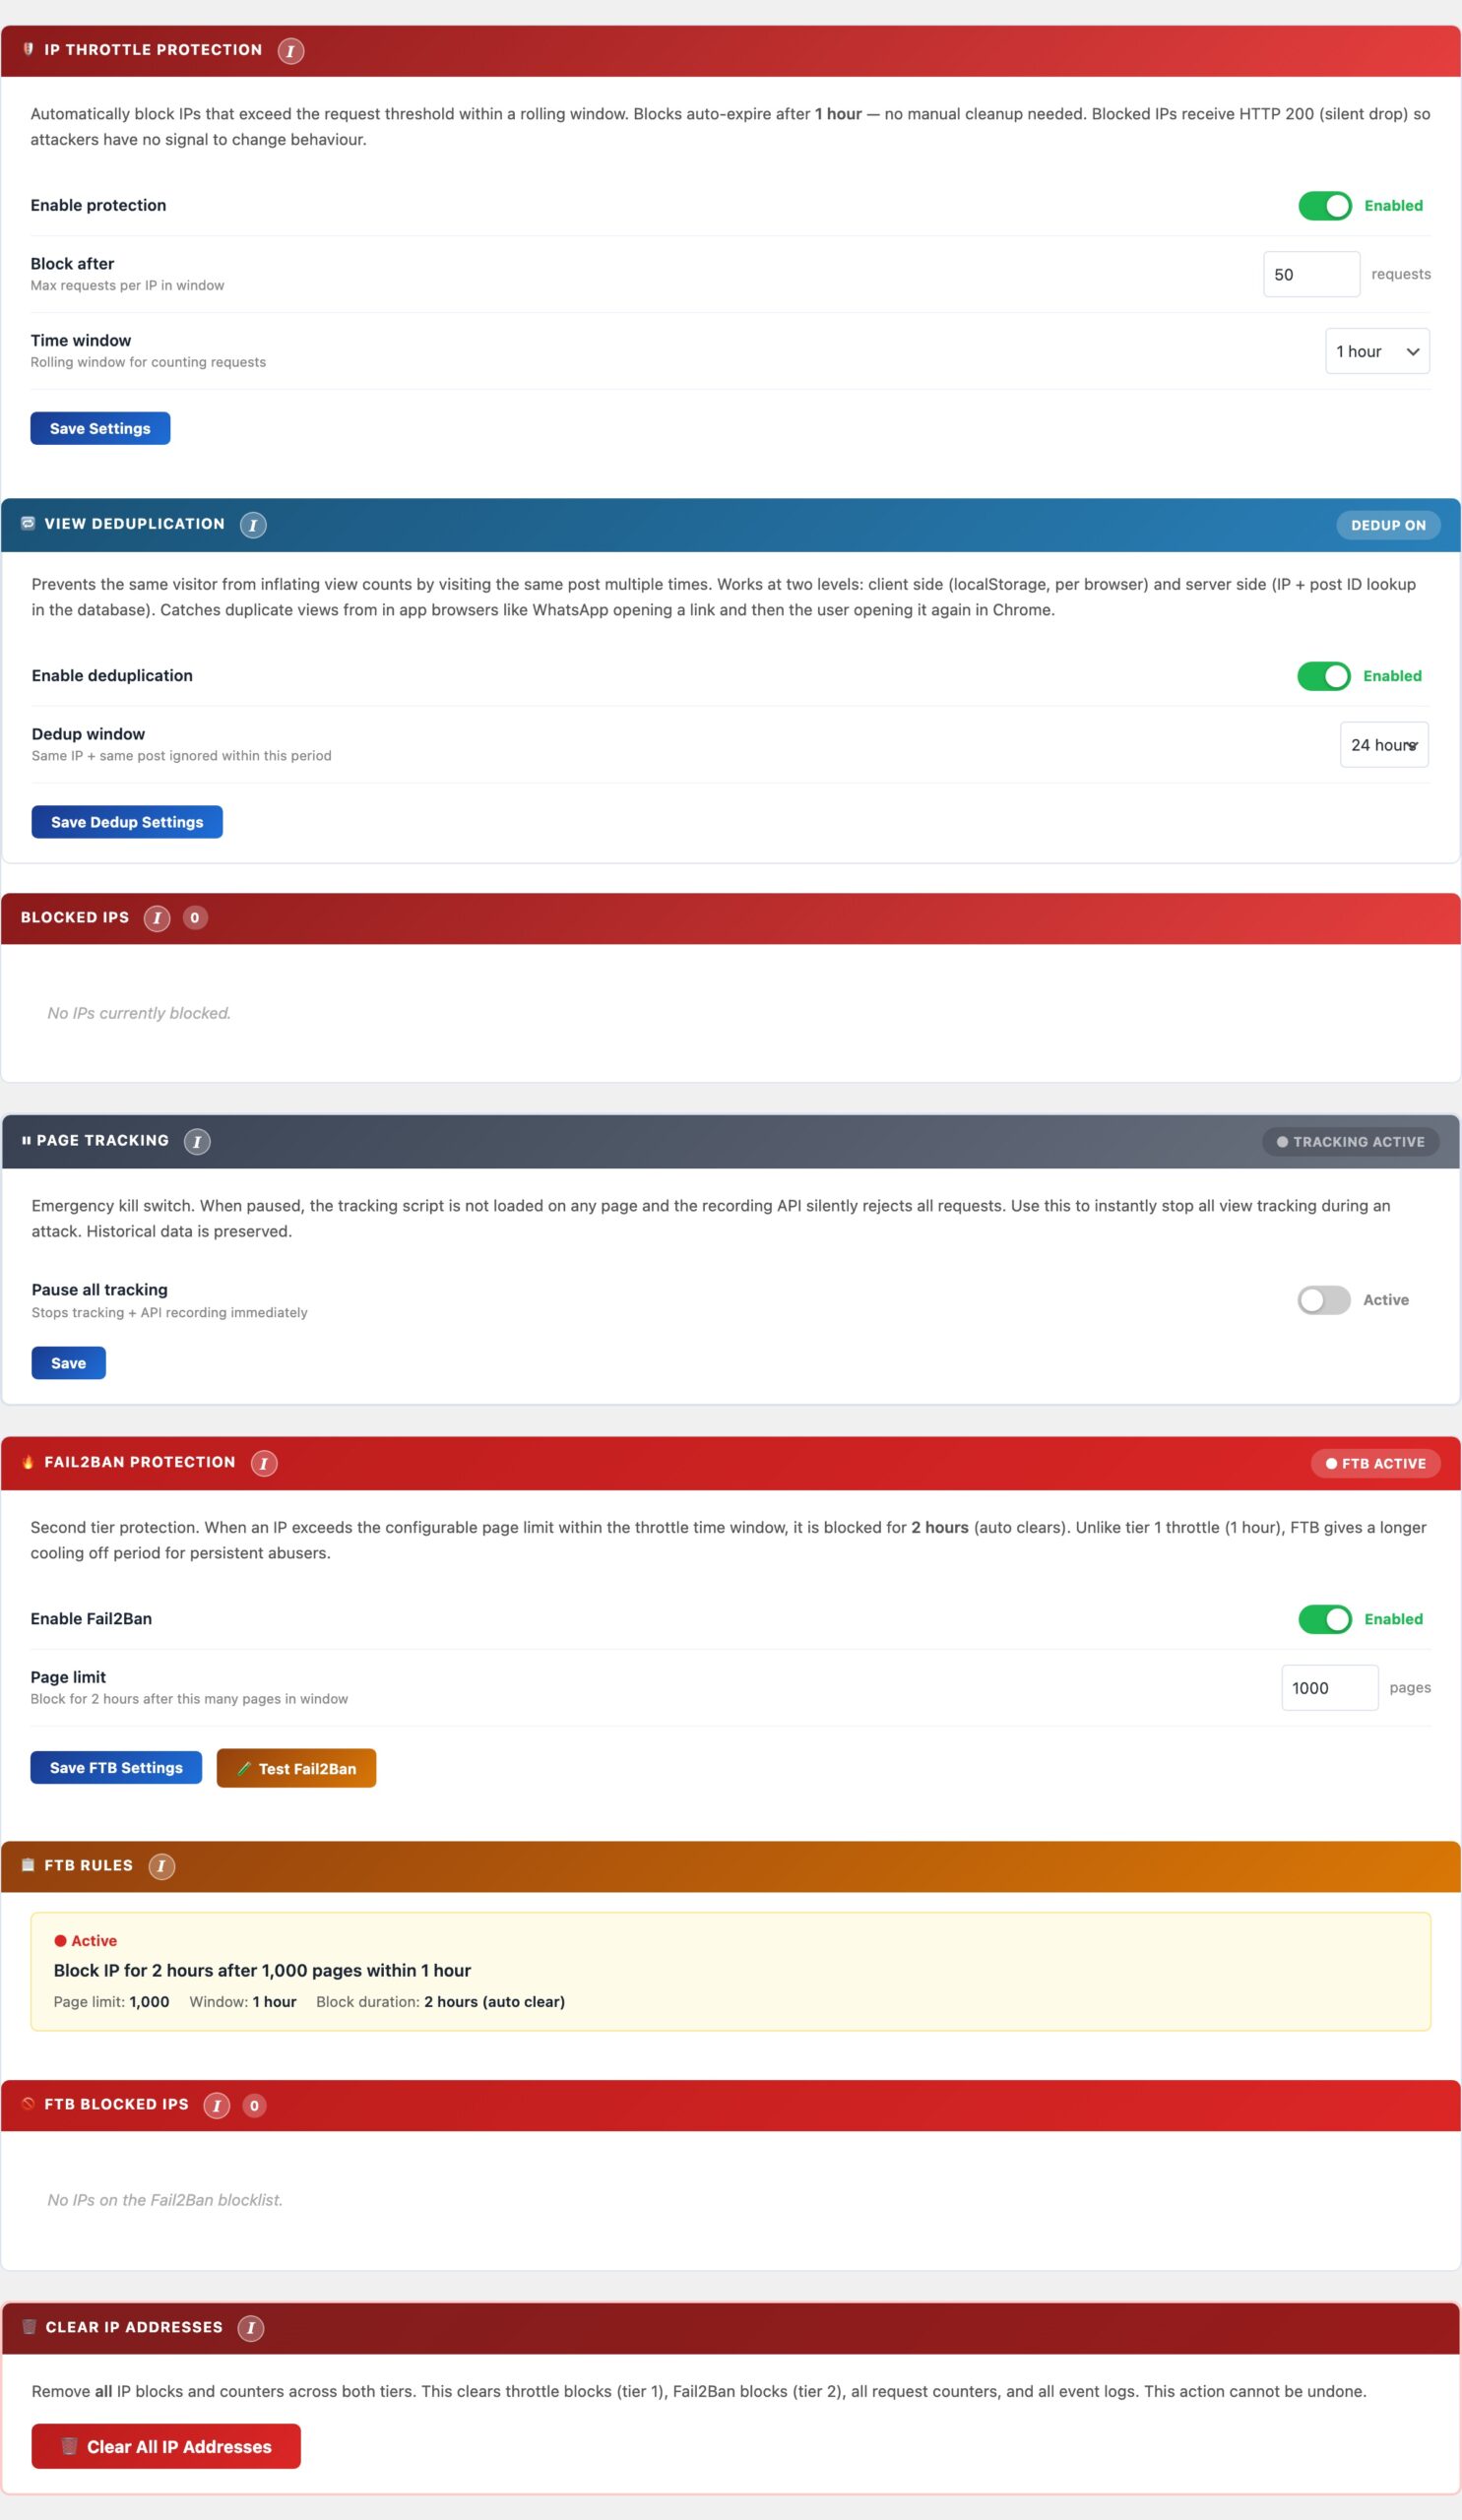
The IP Throttle tab has four panels that work together to prevent inflated statistics from bots, repeat loads, and your own browsing.
IP Throttle Protection
Automatically blocks IP addresses that send an excessive number of beacon requests within a rolling time window, typically aggressive scrapers, bots, or misconfigured load tests. Blocked IPs receive an HTTP 200 response (silent drop) so attackers have no signal to change behaviour. Blocks auto-expire after 1 hour.
- Enable protection: toggle to activate automatic IP blocking.
- Block after: maximum number of requests per IP within the time window before the IP is blocked.
- Time window: the rolling window for counting requests: 10 minutes, 30 minutes, 1 hour, 2 hours, or 24 hours.
- Exclude logged-in users: prevents any authenticated WordPress session from being counted. Detected via the
logged_in_{hash}cookie in the beacon. - Exclude administrators: more granular; only users with the
administratorrole are excluded. Editors, Authors, and Contributors are still counted.
View Deduplication
Prevents the same visitor from inflating view counts by visiting the same post multiple times within a configurable window. Works at two levels simultaneously:
- Client-side (localStorage): the beacon records a key in
localStorageper post on first fire. Subsequent visits to the same post from the same browser do not fire the beacon again within the window. Catches duplicate views from in-app browsers (e.g. WhatsApp opening a link, then the user opening it again in Chrome). - Server-side (IP and post ID lookup): the REST endpoint checks
wp_cspv_views_v2for a recent row matching the same hashed IP andpost_idwithin the dedup window. This catches duplicates from clients that clear localStorage or use private browsing.
Configure the dedup window (1 hour to 48 hours). Setting it shorter counts repeat visits within a day; longer prevents the same reader from contributing more than once per session period.
Blocked IPs
Shows all IPs currently blocked by the throttle system. IPs are stored as one-way SHA-256 hashes; they cannot be reversed to a real IP address. Each entry shows the block timestamp and time remaining until auto-expiry.
- Unblock: removes a specific IP hash from the blocklist immediately, before the auto-expiry timer.
- Clear All: removes all blocked IPs at once. Use after a false-positive event (e.g. a load test triggered the throttle).
Page Tracking
An emergency kill switch that instantly stops all view tracking across the entire site. When paused, the tracking beacon script is not loaded on any page and the REST recording endpoint silently rejects all requests. Historical data is fully preserved.
Use this during content imports, database migrations, load tests, or any period when you do not want views recorded. The status badge on the panel header shows TRACKING ACTIVE (green) or TRACKING PAUSED (red) at a glance. Toggle it off to resume normal tracking immediately.
Insights
A rich analytics dashboard showing how your content performs across traffic sources, referrer domains, geography, and time — with a Smart Summary, KPI cards, pie charts, line charts, a peak traffic hours heatmap, a referrer timeline, audience new/returning bars, top-posts-by-referrer table, and top landing pages per referrer. Includes a Self toggle to filter internal navigation from all charts at once.
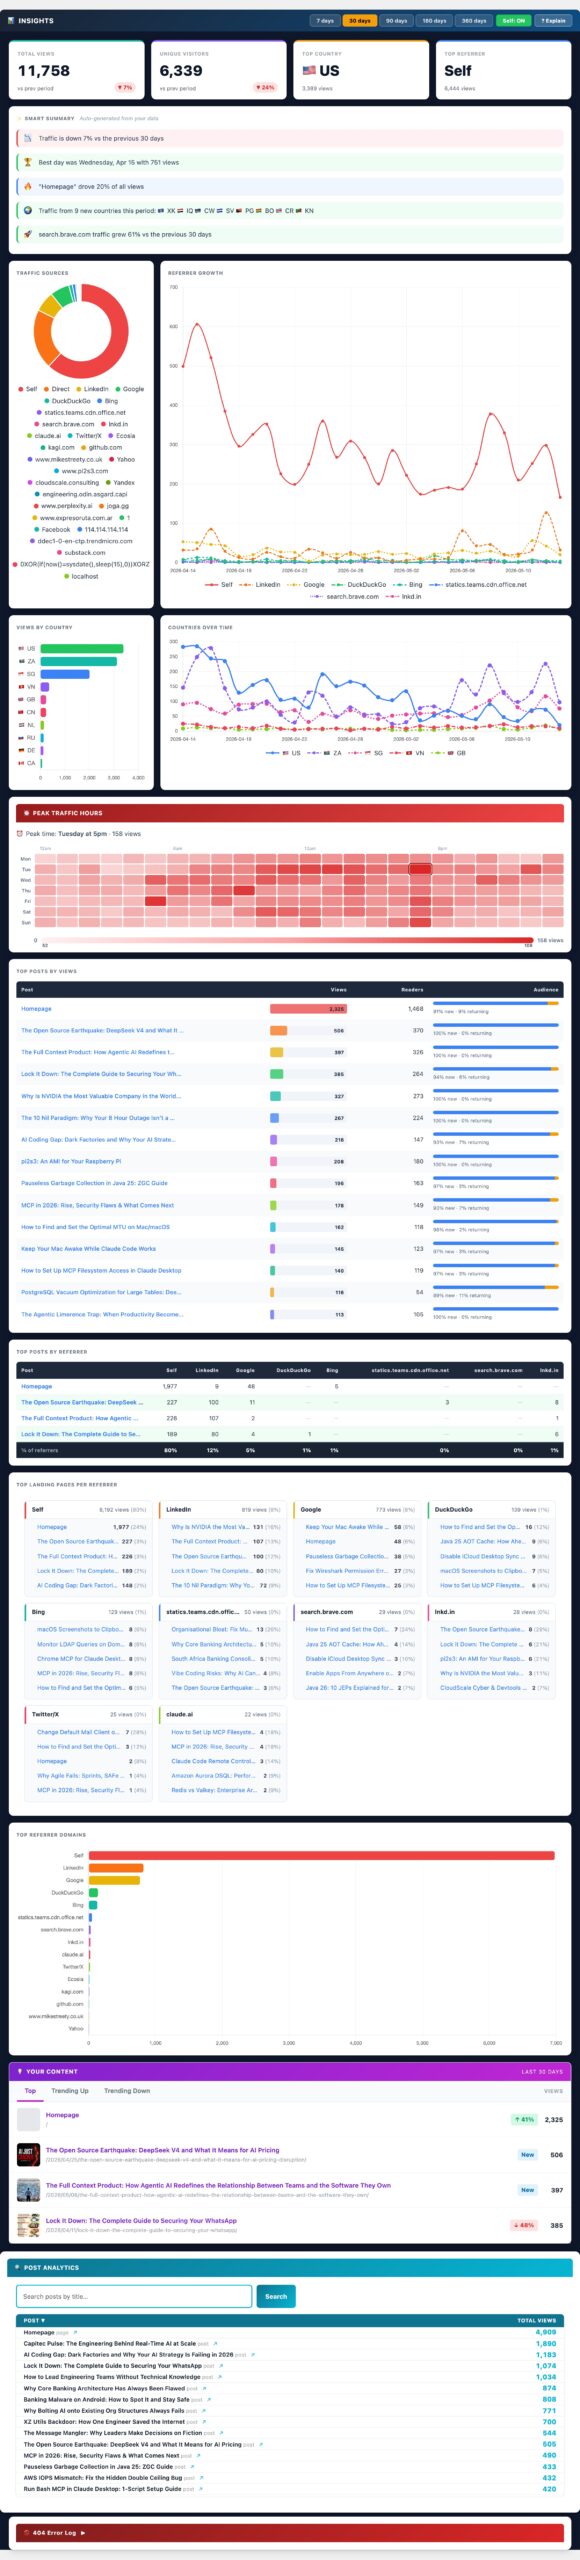
The Insights tab provides a rich analytics dashboard loaded on demand when you open the tab. Use the period buttons (7 / 30 / 90 / 180 days) in the header to change the time window — all charts update together. Each chart has an ? Explain button that opens context-specific documentation inline.
Self Toggle
The Self: ON/OFF button at the top of the Insights tab filters Self traffic — visits where your own domain was the HTTP referrer — out of every chart, table, and KPI card simultaneously, without re-fetching data from the server. For sites where internal navigation accounts for the majority of referrals (often 80–90%), toggling Self OFF makes it far easier to evaluate external acquisition channels. Toggle it back ON to include all traffic again.
Smart Summary
A plain-English summary card at the top of Insights, auto-generated from your data each time the tab loads. It reads your KPI values, referrer distribution, and trend direction for the selected period and produces 3–5 bullet points that highlight what actually changed — e.g. “Google drove 62% of views, up from 44% last period” or “Your top post accounted for 38% of all traffic.” No AI API key required: the summary is generated locally by pattern-matching your own numbers. Use it to quickly orient yourself before diving into the charts.
KPI Cards
Four summary metrics for the selected period: Total Views, Unique Visitors (distinct visitor hashes), Top Country (most views by geography), and Top Referrer (highest-traffic source domain). When Self is OFF, Total Views, Unique Visitors, and Top Referrer all exclude Self traffic so the numbers reflect external acquisition only.
Traffic Sources
A doughnut chart breaking all views by how the visitor arrived. Known search engines (Google, Bing, DuckDuckGo, Yandex, Baidu, Ecosia) and social networks (LinkedIn, Facebook, Twitter/X, Reddit, Instagram, Pinterest) get their own labelled slices. Direct means no referrer header was sent — typed URL, bookmark, or email client. Self is internal navigation from your own domain (a reader clicking from one post to another). Slices that share similar hues automatically receive distinct canvas hatch patterns so they stay distinguishable at a glance.
Referrer Growth Timeline
A multi-line chart showing how each traffic source has trended over time. Known engines and social networks appear under their brand name; your own domain appears as Self; every other external site appears under its own hostname (e.g. news.ycombinator.com). Each line has a unique colour from a 20-hue vivid palette, a distinct dash pattern, and a distinct point shape so they remain readable even when many sources overlap. Periods of 30 days or fewer use daily buckets; longer periods use weekly buckets (ISO week start). Sources with zero traffic are hidden automatically.
Peak Traffic Hours
A 24-column heatmap showing when your audience is most active, broken down by hour of day. Each column is coloured from pale to deep red based on relative view density — a deep red column means that hour consistently receives the most traffic. Above the heatmap, a Best hour badge calls out your single highest-traffic time slot for the period. Use this to schedule social shares, email newsletters, or new post publications for maximum reach.
Top Posts by Views
A table ranking your most-viewed content for the selected period, with each post showing its total views and a new/returning audience split. The New / Returning bar shows the proportion of views from first-time visitors vs. returning readers — a post with a high new% is attracting fresh traffic (good for discovery content); a high returning% means readers are coming back (good for evergreen reference content). Hover any row for exact counts.
Top Posts by Referrer
A table showing up to 20 of your top posts with a view-count breakdown by traffic source. Columns are the top referrer sources for the period — including Self (internal navigation), named search engines, social platforms, and external domains. Rows alternate between white and a soft blue background for readability. Dashes indicate zero views from that source. Use this to identify which posts rank in Google, which spread on social, and which are discovered through your own internal links.
Top Landing Pages per Referrer
For each of your top referrer sources, this panel shows which specific pages on your site that source sent visitors to, along with the view count and a traffic share percentage. For example: “Google → /your-post-slug — 142 views (61%)”. This tells you which content ranks for organic search, which pages are linked from specific communities, and where to focus SEO or content efforts to grow a particular channel. Each referrer group is collapsible.
Views by Country
A doughnut chart showing the top 10 countries by view count for the selected period, built from the geo table. Hover for exact counts and percentages.
Top Countries Over Time
A multi-line chart for the top 5 countries, showing how geographic traffic shifts over the selected period. Useful for spotting when a post goes viral in a specific market or when SEO efforts in a new region start paying off.
Top Referrer Domains
A horizontal bar chart ranking the top referring domains. Self appears here when your own domain is the top source through internal navigation. Each bar uses a distinct vivid colour; similar hues get a hatch pattern automatically. Aggregated from full referrer URLs stored in wp_cspv_referrers_v2. Useful for identifying which sites, directories, or communities send you the most traffic.