Infrastructure Engineering: Systems, Networking, Databases & the Internet
18 views
Network architecture, internet protocols, database and systems design, and the infrastructure engineering decisions that determine whether real production systems hold up under load.


Capitec Pulse: The Engineering Behind Real-Time AI at Scale
By Andrew Baker, Chief Information Officer, Capitec Bank The Engineering Behind Capitec Pulse 1. Introduction I have had lots of questions about how we are “reading our clients minds”. This is a great question, but the answer is quite complex – so I decided to blog it. The article below really focuses on the heavy […]
Read more →
Why Core Banking Architecture Has Always Been Flawed
The COBOL apocalypse conversation this week has been useful, because it has forced the industry to confront something it has been avoiding for decades. But most of the coverage is stopping at the wrong point. Everyone is talking about COBOL. Nobody is talking about the architectural philosophy that COBOL gave birth to, the one that […]
Read more →
XZ Utils Backdoor: How One Engineer Saved the Internet
On a quiet Friday evening in late March 2024, a Microsoft engineer named Andres Freund was running some routine benchmarks on his Debian development box when he noticed something strange. SSH logins were taking about 500 milliseconds longer than they should have. Failed login attempts from automated bots were chewing through an unusual amount of […]
Read more →
The Undergraduate Who Broke a 40 Year Assumption About Hash Tables and what this means for Memory
1. A Side Project That Ended a Conjecture In 2023, Andrew Krapivin was an undergraduate at Rutgers University reading a paper on his own time, for fun, that his professor Martín Farach-Colton had co-authored two years earlier. The paper was called “Tiny Pointers”, and it described a new kind of memory reference object that could […]
Read more →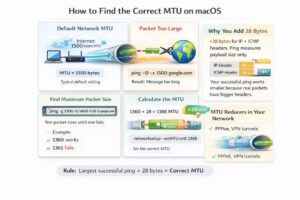
How to Find and Set the Optimal MTU on Mac/macOS
If you have just changed ISPs or moved house and your internet suddenly starts misbehaving the likelihood is your Maximum Transmission Unit (MTU) is set too high for your ISP. The default internet facing MTU is 1500 bytes, BUT depending on your setup, this often needs to be set much lower. Step 1: First check […]
Read more →
Fix Thumbnail Previews on WhatsApp, LinkedIn & X (Guide)
When you share a link on WhatsApp, LinkedIn, X, or Instagram and nothing appears except a bare URL, it feels broken in a way that is surprisingly hard to diagnose. The page loads fine in a browser, the image exists, the og:image tag is there, yet the preview is blank. This post gives you a […]
Read more →
Rubrik Architecture: Why Restore, Not Backup, Is the Product
1. Backups Should Be Boring (and That Is the Point) Backups are boring. They should be boring. A backup system that generates excitement is usually signalling failure. The only time backups become interesting is when they are missing, and that interest level is lethal. Emergency bridges. Frozen change windows. Executive escalation. Media briefings. Regulatory apology […]
Read more →
Know Your System: The Operational Cognition Questionnaire
Most outages are not caused by a single bug. They are caused by teams that have gradually lost a coherent mental model of the system they operate. Kubernetes retries. Queues absorb backpressure. Auto scaling masks inefficiency. Managed services hide infrastructure complexity. Over time, teams begin operating systems they no longer fully understand. Then something breaks. […]
Read more →
How a Blog Post Wiped $30 Billion from IBM in One Day
Anthropic published a blog post on Monday. Not a product launch, not a partnership announcement, not a keynote at a major conference. Just a simple blog post explaining that Claude Code can read COBOL. IBM proceeded to drop 13%, its worst single day loss since October 2000, with twenty five years of stock resilience gone […]
Read more →
AWS Security Group Hardening Using VPC Flow Log Analysis: Introducing sg-tightener
Andrew Baker, Group CIO, Capitec Bank Most enterprises did not move to AWS. They extended into it. The datacenter did not go away. The VPN did not go away. The network team provisioned the Direct Connect, someone wrote a security group rule permitting the entire datacenter subnet, and that rule has been sitting there ever […]
Read more →
AWS NLB Sticky Sessions: Setup, Behavior & Pitfalls
When you deploy applications behind a Network Load Balancer (NLB) in AWS, you usually expect perfect traffic distribution, fast, fair, and stateless.But what if your backend holds stateful sessions, like in-memory login sessions, caching, or WebSocket connections and you need a given client to keep hitting the same target every time? That’s where NLB sticky […]
Read more →
Mac Wireshark MCP Setup for Claude Desktop: Full Guide
If you’re like me, the idea of doing anything twice will make you break out in a cold shiver. For my Claude desktop, I often need network pcap (packet capture) to unpack something that I am doing. So the script below installs wireshark, and then the wireshark mcp and then configures Claude to use it. […]
Read more →