CloudScale Cyber & Devtools – Free AI Penetration Testing & WordPress Security Plugin
← CloudScale WordPress Plugins
- Home Dashboard
- Hide Login URL
- Two-Factor Auth
- Passkeys (WebAuthn)
- Session Duration
- Brute-Force Protection
- SSH Brute-Force Monitor
- AI Cyber Audit
- AI Site Auditor
- Threat Monitor
- Code Block
- Code Block Migrator
- SQL Query Tool
- Server Logs
- Plugin Optimizer
- Plugin Stack Scanner
- Update Risk Scorer
- Uptime Monitor
- CS Monitor
- FPM Monitor
- Test Account Manager
- OPcache Monitor
- SMTP Mailer
- Email Activity Log
- Thumbnails & Open Graph
Before CloudScale vs After
The WordPress Security Reality No One Talks About
WordPress powers 43% of every website on the internet, over 810 million sites. That extraordinary market dominance makes it the single most targeted platform in the history of the web. Automated attack bots don’t discriminate by site size or traffic. Your personal blog, your agency client’s e-commerce store, your company’s marketing site: they are all being probed right now, regardless of how small or “not worth hacking” you think they are.
The numbers are stark. Approximately 90,000 WordPress sites are attacked every single minute. Over 97% of those attacks are fully automated: bots running credential-stuffing scripts, plugin vulnerability scanners, and file-injection exploits around the clock, targeting millions of sites simultaneously. The bots don’t care who you are. They care that you’re running WordPress.
And here is the uncomfortable truth about the typical WordPress security posture: it’s almost always inadequate, and the owner almost never knows it. Debug mode left on in production, leaking PHP errors to every visitor. WordPress version number advertised in page source and RSS feeds, letting attackers search for known CVEs before you’ve had a chance to patch. /wp-login.php answering requests from every IP on earth, soaking up thousands of brute-force attempts per day. Plugins installed years ago, never updated, carrying unpatched vulnerabilities that have been in public CVE databases for months. A single administrator account with a password reused from a site that breached two years ago. None of this is unusual. All of it is standard.
The consequences are binary and brutal. An unprotected login page or an SSH port open to the internet with no brute-force protection will either get your server recruited into a DDoS botnet (taking your site offline and potentially getting your IP blacklisted), or it hands attackers the keys to your admin dashboard. Servers with open SSH and no fail2ban are found by automated scanners within minutes of going online. Once inside, they don’t just deface your site. They install backdoors, steal customer data, send spam through your mail server, and use your infrastructure to attack other targets. You often won’t know for weeks.
The Checklist Security Myth
For years, WordPress security advice has come in the form of checklists: “enable these constants in wp-config.php, install a firewall plugin, keep plugins updated.” This advice is correct but woefully incomplete. A checklist tells you what to check. It cannot tell you what your specific configuration actually means from a risk perspective, whether a combination of settings creates an exposure that no individual setting would reveal, or whether one of your installed plugins contains obfuscated code that bypasses every firewall rule written. Checklists treat all sites as identical. Your site is not identical to anyone else’s.
The Plugin Stack You’re Currently Paying For
Here is the typical WordPress security and developer tooling stack, with real 2025 pricing for sites that take this seriously:
| Plugin | What it does | Premium cost |
|---|---|---|
| Wordfence Premium | Security scanner, firewall, malware detection | $119/year |
| WP 2FA Pro | Two-factor authentication for wp-admin | $79/year |
| WP Mail SMTP Pro | Authenticated SMTP email delivery | $49/year |
| Prismatic | Syntax-highlighted code blocks | $29/year |
| iThemes Security Pro | Brute-force protection, hide login URL | $99/year |
| WPScan | Vulnerability scanning and audit reporting | $25–$75/month |
| Total (conservative) | Minimum tiers, annual billing | $375–$1,275/year |
| CloudScale | Everything above, plus frontier AI audit | Free |
This isn’t a feature comparison where CloudScale cuts corners to hit a free price point. It’s a full implementation of each category – and the AI security audit isn’t a cut-down version of a paid product. It’s built on frontier models that outperform the signature-based scanners you’re currently paying for.
Why the Existing Security Tools Fall Short
Understanding the Terminology
CVE (Common Vulnerabilities and Exposures) is a public database of known security flaws in software. Each one gets a unique ID like CVE-2024-1234. When a researcher discovers a bug in a WordPress plugin that could let an attacker take over a site, they file a CVE report. It gets added to the database. Security tools scan your plugins against this list.
CVSS score (Common Vulnerability Scoring System) rates the severity of each CVE on a scale of 0–10. The four bands you’ll see in CloudScale’s reports: Critical (9–10): remote code execution, full site takeover, mass data theft possible with no user interaction. High (7–8.9): significant data exposure or privilege escalation. Medium (4–6.9): real risk but requires specific conditions. Low (0.1–3.9): minimal practical impact. Any Critical finding on a live site should be treated as a fire drill.
Zero-day refers to a vulnerability that is being actively exploited before a patch exists or before it has been added to any CVE database. The name comes from the fact that developers have had zero days to fix it. Zero-days are the most dangerous class of vulnerability because every signature-based scanner in the world is blind to them. The attacker knows about the flaw. The defenders don’t. The only way to catch them is through code analysis and behavioural reasoning. That is exactly what CloudScale’s AI Code Triage does.
Wordfence ($119/year for premium), Sucuri ($199/year), and WPScan ($25–$75/month) are the tools most security professionals will point you to. They are legitimate products that do real things: malware signature scanning, firewall rules, IP reputation blocking. But they share a fundamental architectural limitation. They are signature-based. They match what they see on your site against a database of known bad patterns. If the malware or misconfiguration isn’t in their database yet, they don’t flag it. They are inherently reactive; they require someone to be compromised first, for the attack pattern to be captured, analysed, and written into a rule. By definition they cannot identify novel threats, unusual configuration combinations, or the specific risk profile of your particular setup.
CloudScale vs The Paid Stack: Full Comparison
| Capability | WPScan $25–$75/mo | Wordfence Premium $119/yr | CloudScale Free |
|---|---|---|---|
| AI security analysis | ✗ | ✗ Signature only | ✓ Frontier AI |
| Novel / zero-day threats | ✗ DB only | ✗ DB only | ✓ First-principles reasoning |
| Context-aware findings | ✗ | ✗ | ✓ Your specific config |
| PHP code static analysis | ✗ | Limited | ✓ AI-triaged per plugin |
| SSH / sshd_config checks | ✗ | ✗ | ✓ CRITICAL finding if open |
| DNS / SPF / DMARC analysis | ✗ | ✗ | ✓ |
| One-click remediations | ✗ | Some | ✓ 7 quick fixes |
| 2FA + Passkeys included | ✗ | ✗ | ✓ All three methods |
| Data via vendor server | Yes | Yes | No. Direct to AI API. |
| SQL tool + server log viewer | ✗ | ✗ | ✓ Included |
| SMTP + syntax-highlighted code blocks | ✗ | ✗ | ✓ Included |
The premium price also filters out the vast majority of WordPress site owners. There are 810 million WordPress sites and a fraction of them pay for premium security tooling. Everyone else: the personal bloggers, small business owners, freelancers building sites for local clients. They are either running free tools with heavily restricted capabilities, or running nothing at all.
The “AI Security” Marketing Trap
Since ChatGPT became mainstream, the WordPress plugin directory has filled with plugins claiming “AI-powered security.” Look closely at almost all of them and you find one of two things: either a bolt-on GPT-4 API call wrapped around the same signature-based scan output that existed before (the AI doesn’t do the analysis, it just summarises it), or a marketing page full of AI language that describes what the plugin could detect with AI, without actually using AI to do it.
Real AI security analysis means sending your actual configuration, your actual plugin list, your actual code (not a pre-processed summary) to a frontier model and asking it to reason about the specific risk profile. It means the AI can identify that your combination of an outdated caching plugin, a relaxed CORS policy, and a public-facing REST API endpoint creates an exposure that no individual component would trigger on its own. That requires genuine frontier intelligence, not pattern-matching dressed up with AI branding.
What Frontier AI Actually Changes
Anthropic Claude Opus 4 and Google Gemini 2.5 Pro are not chatbots with a security FAQ. They are frontier reasoning systems with deep knowledge of CVEs, OWASP vulnerabilities, PHP exploitation techniques, WordPress internals, and the full threat landscape. A professional security consultant doing a WordPress audit is doing fundamentally the same thing: reading your configuration, reasoning about what it means, cross-referencing known vulnerability patterns, and applying judgement about real-world risk. The audit a consultant would charge $500–$5,000 for and take days to schedule? The AI does it in under 60 seconds, on your specific site.
The critical difference from signature-based tools: the AI doesn’t need your vulnerability to be in a database first. It reasons from first principles. When it reads your sshd_config and sees that PasswordAuthentication yes is set with no fail2ban equivalent running and port 22 open to the internet, it knows from its training on real-world security incidents that this configuration actively gets servers recruited into DDoS botnets. Not because that specific combination is in a signature database. Because it understands what that configuration means.
The Mythology of AI Security
There is a prevailing mythology in the security industry that AI is a magic layer you bolt onto existing tools to make them better. Vendors who spent the last decade building signature databases rebranded overnight. The product didn’t change. The marketing did. “AI-powered” became the new “cloud-enabled”: a phrase that means everything and nothing at once.
The mythology is seductive because it’s partly true. Adding an AI summary to a Wordfence scan report does make it easier to read. Adding a chatbot that explains CVEs is marginally useful. But these are cosmetic improvements to a fundamentally reactive architecture. The underlying problem is unchanged: you can only detect what you’ve already catalogued.
What frontier AI actually enables is something qualitatively different. Not a better summary of existing scan results. A different kind of analysis altogether. Claude Opus 4 has read more security research, CVE disclosures, penetration testing write-ups, and malware analyses than any human security team ever could. When it looks at your WordPress configuration, it is drawing on that entire body of knowledge simultaneously, applying it to your specific situation, and reasoning about what it actually means for you. That’s not a better wrapper around signature matching. That’s a different tool entirely.
Where This Goes Next
We are at the beginning of a capability curve, not the middle. The models available today (Claude Sonnet 4.6, Claude Opus 4.7, Gemini 2.5 Pro) already outperform the security analysis you’d get from most paid consultants. The models coming in the next 12–24 months will make these look primitive.
Claude 5 and its successors will be capable of autonomous security research: actively probing your infrastructure, reasoning about multi-step attack chains, writing and testing proposed fixes, and explaining the second and third-order consequences of every configuration decision. The gap between “AI that helps you understand a scan” and “AI that autonomously hardens your infrastructure” is closing fast.
CloudScale is built to absorb every new model the day it launches. No migration, no upgrade fee, no waiting. Your plugin gets smarter as the underlying AI gets smarter. The architecture was designed specifically for this: your site, your API key, your direct relationship with the provider. When the next breakthrough model drops, you flip a dropdown and you’re on it.
CloudScale Cyber and Devtools: The Breakthrough
CloudScale Cyber and Devtools is a free, open-source WordPress security and developer toolkit that gives every WordPress site owner access to exactly this level of analysis. No premium tier. No “upgrade to see your full results.” No monthly subscription. You bring your own API key (Google Gemini has a free tier that requires no credit card), and the plugin runs on your own server. Your data never goes anywhere except directly to the AI provider you choose.
The result is a full security audit that would normally cost hundreds of dollars from a consultant, available in your WordPress dashboard, for free, any time you want to run it. Set up daily or weekly scheduled scans and you’ll get an email alert when new issues appear, so you know about problems before your users or Google do.
No Middleman. No Data Risk. Always the Latest Models.
Most “AI-powered” WordPress security products send your site’s data to their own servers first, where it gets logged, processed, and potentially used to train their models, before eventually forwarding it to an AI provider. You’re paying for a middleman who adds latency, a new privacy risk, and a business model dependency. When that vendor changes their pricing, gets acquired, or goes offline, your security tooling goes with it.
CloudScale works differently. Your WordPress data goes directly from your server to the AI provider’s API (Anthropic or Google) with no intermediary, no CloudScale server, no third-party logging. You supply your own API key, so you have a direct relationship with the provider and full control over your data. CloudScale never sees your site data at all.
When Anthropic releases Claude Opus 5 or Google ships Gemini 3, you get it immediately. No waiting for a plugin vendor to integrate it, no being held on an older model to protect their infrastructure margins. CloudScale ships support for the latest frontier models as soon as they launch. You choose your model, you own the key, you get the best intelligence available from day one.
Why WordPress Plugin Stacks Are Broken (And How CloudScale Fixes It)
The average WordPress site runs 17 active plugins. Each one adds its own JavaScript, its own CSS, and its own HTTP requests to every page load. Each has its own update cycle, its own support forum, its own settings panel, and its own potential for conflict with every other plugin on the site. They were not designed to work together. They were each designed to solve one problem in isolation.
The result is a fragmentation tax. You end up with five different places to check security settings. Your SMTP plugin doesn’t know about your security plugin’s admin restrictions. Your 2FA plugin doesn’t know about your brute-force protection plugin’s lockout logic. Your code highlighting plugin loads from a CDN that your Content Security Policy blocks. The more plugins you add, the more attack surface you expose, and the more cognitive overhead you carry every time you log into wp-admin.
CloudScale is designed as a unified layer from the ground up. The security scanner knows about the login settings. The 2FA system integrates with the brute-force protection. The performance monitor shows load contribution from every component in one overlay. It was built as a system, not assembled from parts written by different teams for different purposes and then bolted together with activation hooks.
One plugin to install. One plugin to update. One changelog to read. One GitHub repository to audit. One developer to contact when something breaks. That consolidation is itself a security feature: fewer moving parts means fewer attack vectors and fewer places for something to quietly go wrong.
Ready to protect your site?
Free, open-source, and installed in under 5 minutes. Google Gemini’s free tier means zero cost for daily AI security scans.
Installing the Plugin: Step by Step
The plugin isn’t in the WordPress.org directory yet, so installation takes one extra step compared to a typical plugin. It’s still under five minutes from download to your first security scan.
Download the plugin zip
Click the Download Free Plugin button at the top of this page. Your browser will save a file called cloudscale-devtools.zip. Leave it zipped; WordPress handles the extraction.
Open your WordPress dashboard
Log in to your WordPress site and go to Plugins in the left sidebar. At the top of the page, click Add New Plugin, then click the Upload Plugin button that appears near the top of the screen.
Upload and install
Click Choose File, select the cloudscale-devtools.zip file you just downloaded, then click Install Now. WordPress uploads and unpacks the plugin in a few seconds.
Activate
After installation, WordPress shows you a success screen with an Activate Plugin button. Click it. The plugin is now running.
Open the plugin
In the WordPress sidebar, go to Tools → Cyber and Devtools. You’ll land on the Home dashboard showing your current security posture at a glance.
Run your first security scan
Click the Security tab. If you don’t have an API key yet, click the link to get a free Google Gemini key (see the AI setup guide in this page’s Security section). Paste it in, click Save, then hit Run AI Cyber Audit. Your first report appears in about 30 seconds.
Requirements: WordPress 6.0 or later, PHP 7.4 or later. Works on shared hosting, VPS, and managed WordPress hosting (WP Engine, Kinsta, Cloudways, etc.). Does not require SSH access or command-line tools.
Safe to try: what CloudScale does not do
- Does not modify any existing plugin settings or post content
- No external CDN or third-party script dependencies – everything runs on your own server
- Your site data goes direct to the AI provider API you choose; CloudScale never sees it
- Fully open-source – every line of code is on GitHub and auditable by anyone
- Clean uninstall: removes all plugin data from the database on deletion, no pollution
- Does not conflict with existing security plugins – runs alongside Wordfence, iThemes, etc.
Before you start hardening anything: take a backup. The Quick Fixes in this plugin modify wp-config.php, database tables, and server configuration. In the unlikely event something goes wrong, you want a restore point. The free CloudScale Backup and Restore plugin does one-click full-site backups (database + files) to local storage or cloud. Five minutes now saves hours later.
🛡️ Security
- AI Cyber Audit: scored security report in under 60 seconds using Claude or Gemini
- Deep Dive Scan: HTTP probes, DNS checks, TLS, PHP code analysis
- Quick Fixes: one-click hardening for common misconfigurations
- SSH Brute-Force Monitor: reads auth.log every 60 seconds, alerts on 10+ failures
- Scheduled Scans: daily/weekly background scans with email & push alerts
- Server Logs: read PHP, WordPress and web server logs in-browser
🔐 Login Security
- Hide Login URL: move /wp-login.php to a secret slug
- Two-Factor Authentication: email OTP, TOTP (authenticator app), or passkeys
- Passkeys (WebAuthn): Face ID, Touch ID, Windows Hello, YubiKey
- Brute-Force Protection: per-account lockout after N failed attempts
- Force 2FA for admins: block dashboard access until 2FA is set up
- Test Account Manager: temporary accounts for Playwright / CI pipelines
🛠️ Developer Tools
- Syntax-highlighted Code Block: 190+ languages, 14 themes, bundled locally
- Code Block Migrator: batch-convert blocks from other plugins
- SQL Query Tool: read-only SELECT queries in-browser
- SMTP Mail: replace PHP mail() with authenticated SMTP
- CS Monitor: floating overlay showing DB queries, hooks, HTTP calls, assets, and PHP errors on every page
- PHP-FPM Monitor: live worker status, saturation alerts, and optional auto-restart from the host OS
- Custom 404 Page: branded 404 with 7 playable mini-games and leaderboard
What’s Covered Below
- Hide Login URL setup and how it works
- Two-Factor Authentication and enforcement
- Passkeys registration and browser support
- AI Cyber Audit with full API key setup guides
- Code Block themes, languages, and usage
- SQL Query Tool and built-in queries
- Server Logs viewer and tail mode
- Plugin Optimizer – plugin stack scanner and AI debugging
- CS Monitor – per-page performance overlay for admins
- PHP-FPM Monitor – live worker status and saturation alerting
Who CloudScale Is For
For Developers
You manage multiple client sites. You need a SQL query tool, server log viewer, syntax-highlighted code blocks, and SMTP in one place – not six separate plugins to install, configure, and update on every new site.
CloudScale gives you the full dev toolkit. The AI audit means every client site gets enterprise-grade security analysis at zero cost to you or them.
For Site Owners
You run a WooCommerce store or a content site. Security isn’t your day job, but getting hacked would be catastrophic. You need protection that works without requiring you to understand every CVE or hardening flag.
Run the AI audit once. Work through Quick Fixes. Enable 2FA. You’re done – and better protected than most sites paying $300/year for plugin subscriptions.
For Agencies
You deploy sites for clients. Every additional plugin is a support burden, a potential conflict, and an update to manage across dozens of installs. Your clients ask why their security isn’t working and you’re the one who has to answer.
CloudScale replaces the entire standard stack in one install. One plugin to update, one changelog to read, one place to look when something goes wrong.
Home Dashboard
The Home tab is the starting point for every CloudScale session. Configure your AI provider and API key here, enable scheduled background scans, and set up email and push alert notifications. Everything in the plugin – the AI Cyber Audit, site audit, and debugging tools – flows from the credentials you enter on this tab.
Start Here: Configure Your AI Provider
Every CloudScale AI feature – the security audit, site audit, and code analysis – runs through the AI provider you configure on this tab. You supply your own API key; your data goes directly from your server to the provider with no CloudScale middleman.
AI Provider Setup
Two providers are supported. Both work equally well for security audits; the choice depends on your preference and budget:
- Anthropic Claude – the recommended choice for the most capable security analysis. Claude Opus 4 and Claude Sonnet 4 are available. Get your key at console.anthropic.com. Paid plans required (no free tier).
- Google Gemini – includes a free tier with no credit card required, making it the zero-cost entry point. Gemini 2.0 Flash (free) and Gemini 2.5 Pro (paid) are available. Get your key at aistudio.google.com.
After entering your key, click Test Key to verify it works before running a scan. The key is stored in your WordPress database (wp_options) and is never transmitted to CloudScale’s servers – it goes only to the provider’s API endpoint during scans.
Scheduled Scans
Enable scheduled scans to run the AI Cyber Audit automatically on a daily or weekly schedule. When a scan completes, results are saved to scan history on the Security tab. Enable email and push alerts to receive the AI summary in your inbox or on your phone the moment a scan finishes.
- Frequency: daily or weekly. Daily is recommended for production sites with regular plugin updates or content changes.
- Scan type: Standard (fast, covers WordPress config and plugin CVEs) or Deep Dive (adds live HTTP probes, DNS checks, and PHP code analysis).
- Email alert: sends to the site’s admin email address by default. Configure SMTP on the Mail tab first to ensure reliable delivery.
- ntfy.sh push: enter any ntfy.sh topic URL to receive instant push notifications on your phone. Free and open-source. No account required – just install the ntfy app and create a topic.
Hide Login URL
Moves your WordPress login page from the default /wp-login.php to a secret URL you choose. Bots and automated attack scripts probe the default path thousands of times a day – if they can’t find the login form, they can’t attack it.
🔐 Stop Bots Before They Even See Your Login Page
Every WordPress site on the internet is probed by bots testing /wp-login.php around the clock. These are not targeted attacks against you specifically – they are automated credential-stuffing scripts running against millions of sites simultaneously, trying breached username and password combinations at scale. If they can reach your login form, they will keep trying indefinitely. Hide Login URL removes the form from the default URL entirely: bots get a 404 and move on to easier targets.
Competing plugins charge $49-$99/year for this feature (iThemes Security Pro, All-in-One Security Premium). CloudScale includes it free, bundled with 2FA and Passkeys in the same plugin, so there is no juggling three separate security plugins that need to know about each other.
The mechanism is simple and reliable. When enabled, a WordPress init hook at priority 1 intercepts any request matching your chosen secret slug and serves the login form for that request. No redirect, no URL change visible in the browser’s address bar – the form just loads at your secret path. Direct requests to /wp-login.php return a clean 404. Internal WordPress links – password reset emails, admin bar logout links, plugin redirect-after-login URLs – all automatically reference your secret URL rather than the default. You do not need to configure anything else; the change propagates through WordPress automatically.
Hide Login URL works best in combination with 2FA (also on this tab). Hiding the login URL removes the attack surface for automated bot traffic. 2FA ensures that even if someone discovers your secret URL (through a browser history leak or social engineering), a stolen password alone is still not enough to break in. Together they cover two different threat categories.
Settings
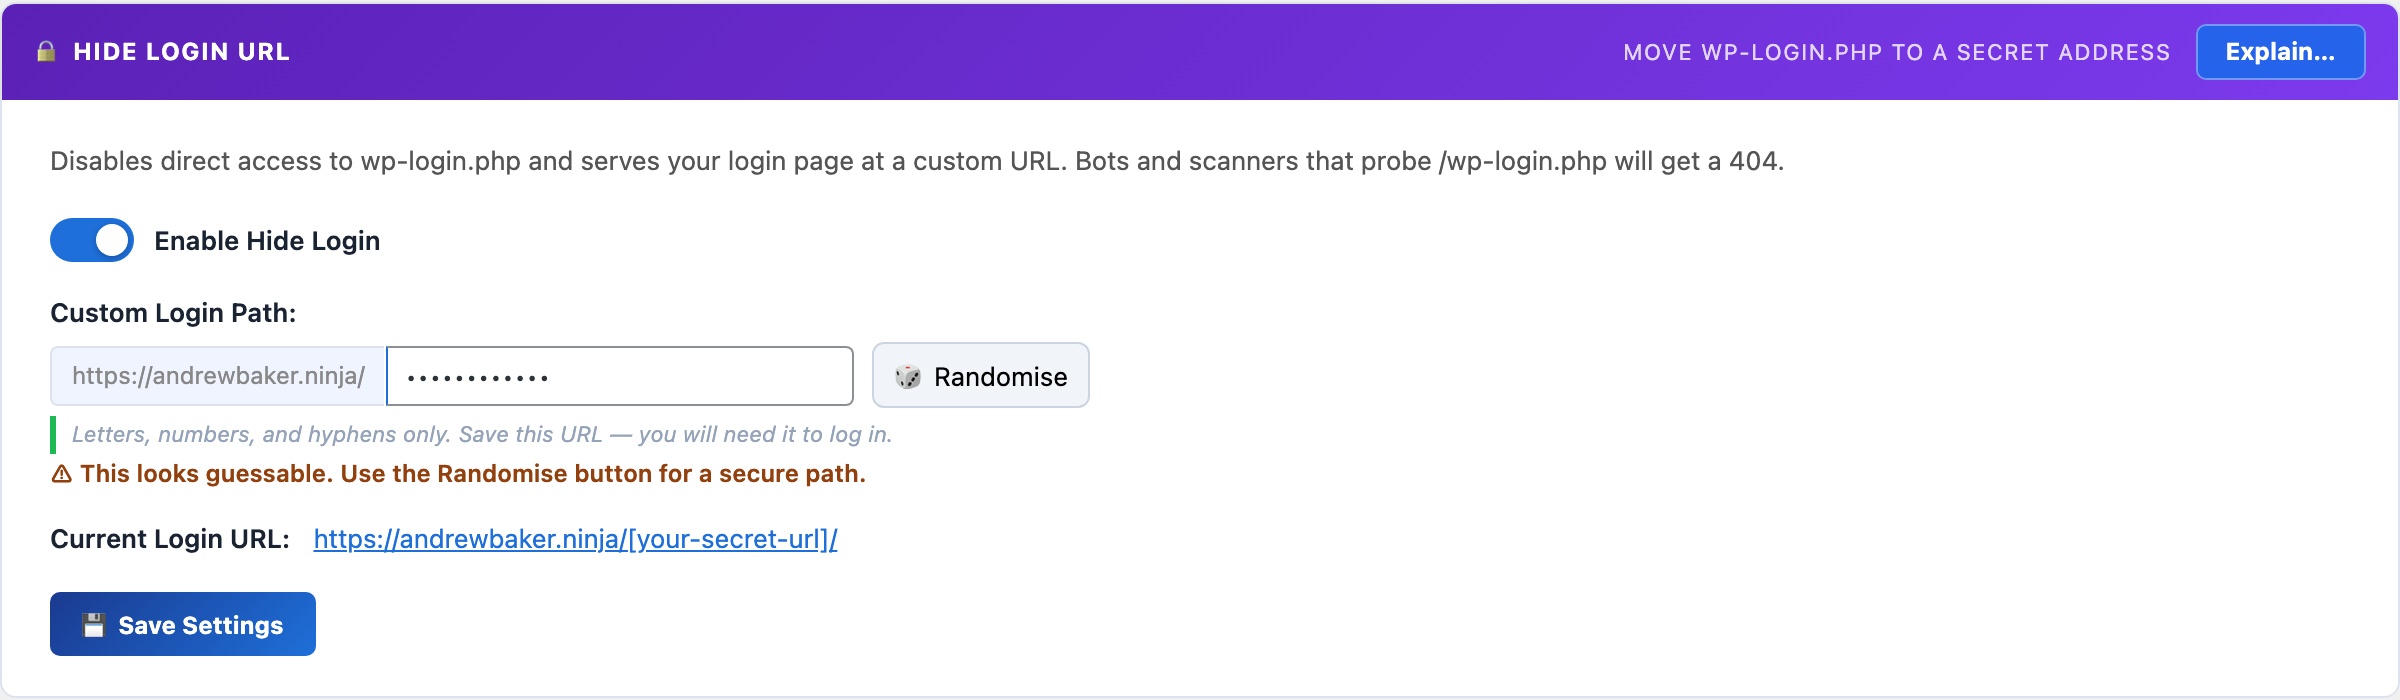
- Enable Hide Login: master switch. When enabled,
/wp-login.phpreturns a 404. Your secret slug serves the login form. When disabled, everything reverts to WordPress defaults with no other changes required. - Login slug: the path segment after your domain where the login form will live. For example, entering
team-portalmeans your login URL becomesyoursite.com/team-portal/. Avoid predictable words:login,admin,dashboard,wp-admin, andsigninare commonly tried by automated scanners and provide little security benefit. A two-word phrase with a number (e.g.launch-control-7) is both memorable and not in any scanner’s dictionary.
Setup (30 seconds)
- Toggle Enable Hide Login on.
- Enter your secret slug in the Login Slug field.
- Click Save.
- Bookmark the new URL immediately before navigating away. The current URL is shown on the settings panel after saving.
What is not affected
WP-CLI, XML-RPC, the REST API, and WP-Cron all bypass the login URL check entirely. This means automated processes that authenticate against WordPress continue working without any configuration changes. The hide-login feature targets human browser-based login attempts only.
If you forget your secret URL
If you lose track of your custom login URL, retrieve it without logging in via WP-CLI from your server:
wp option get csdt_devtools_login_slug Or query your database directly: SELECT option_value FROM wp_options WHERE option_name = 'csdt_devtools_login_slug'. If you cannot access the server at all, temporarily disabling the plugin via FTP (rename the plugin folder) will re-enable the default /wp-login.php path.
Two-Factor Auth
Adds a second authentication step after the password so a stolen or leaked password alone is never enough to break in. Supports email OTP, authenticator apps (TOTP), and passkeys – all three methods included free.
🔑 A Stolen Password Should Never Be Enough to Break In
Passwords get leaked in data breaches, reused across sites, and phished out of users. Two-factor authentication (2FA) means an attacker who has your password still cannot log in. They also need physical access to your phone, email inbox, or hardware key. For WordPress admins, 2FA is the single most effective account protection you can add.
WP 2FA Pro charges $79/year. Wordfence Premium (which includes 2FA) charges $119/year. CloudScale gives you email OTP, TOTP authenticator apps, and Passkeys (all three methods) completely free, in the same plugin you use for everything else.
The attack scenario that 2FA stops is straightforward. Your WordPress admin password appears in a credential-stuffing database from a breach at an unrelated service. An automated bot tries it against your login page. Without 2FA, that is game over. With 2FA, the attacker also needs to be holding your phone or have access to your email at the same moment – a combination that is effectively impossible in a mass automated attack. Credential stuffing (trying breached username/password pairs at scale) is responsible for the majority of WordPress account compromises, and it is stopped entirely by 2FA.
CloudScale implements all three major 2FA methods in a single plugin. You can start with email OTP (no app required, works immediately for every user) and upgrade to TOTP or Passkeys for higher-security accounts at your own pace. All three methods are available to users simultaneously – each person can configure whichever they prefer, and you can enforce a minimum method for administrators.
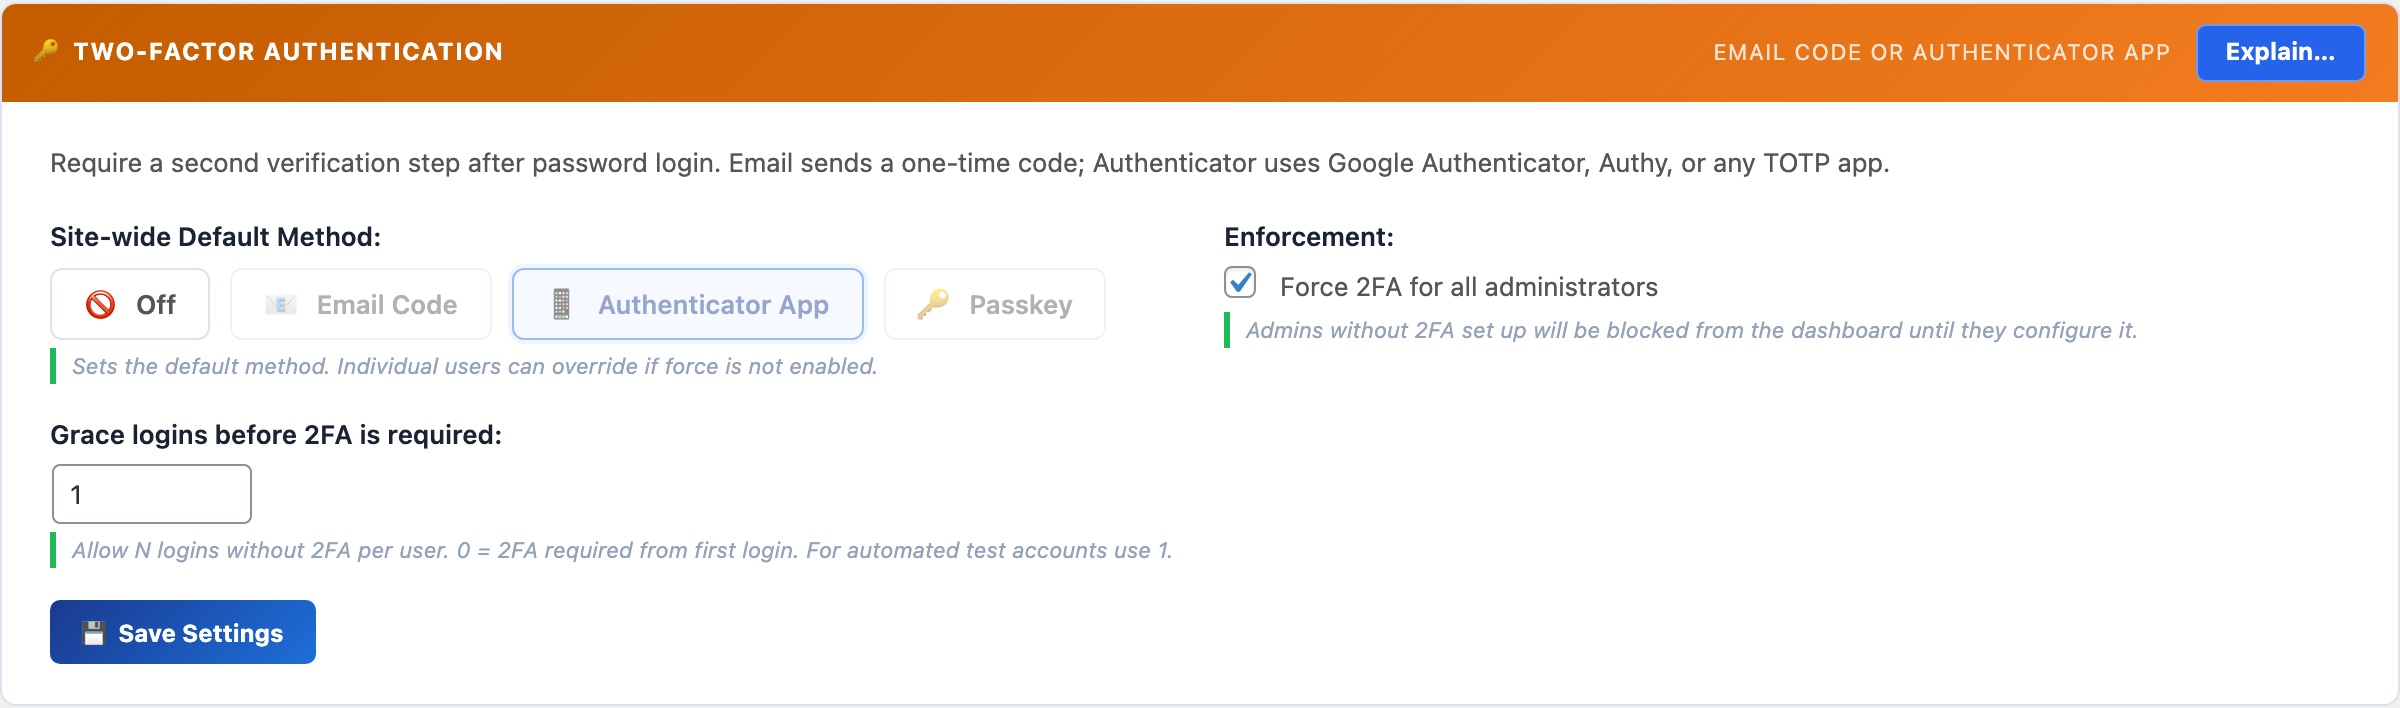
Two-Factor Methods
- Email OTP: a 6-digit code sent to the user’s WordPress email address after successful password entry. No app or prior setup required by the user. Each code expires after 10 minutes and is single-use. Best for non-technical users or as a fallback for when someone does not have their authenticator app available. Requires working SMTP – configure the SMTP mailer on the Email tab first so codes reliably reach inboxes rather than going to spam.
- Authenticator app (TOTP): standard RFC 6238 time-based one-time passwords, compatible with Google Authenticator, Authy, 1Password, Bitwarden, and any TOTP app. Generates a new 6-digit code every 30 seconds entirely on the device – no network connection required. More secure than email OTP because it is immune to email interception and works even when your email is down. Users scan a QR code once from their profile to link their account, then they are set up permanently.
- Passkey (WebAuthn): replaces the second-factor code prompt with a biometric confirmation: Face ID, Touch ID, Windows Hello, or a hardware security key tap. The fastest and most phishing-resistant method available. Unlike TOTP codes, which a fake login page can intercept and replay in real time, passkeys are cryptographically bound to your site’s exact domain and cannot be used on any other URL. See the Passkeys section for full setup details.
Brute-Force Protection
- Maximum login attempts: the number of consecutive failed password attempts before the account is temporarily locked. The default is 5 attempts. Lower this to 3 for high-security sites where you want to be aggressive, or raise it to 10 if legitimate users frequently mistype their passwords and you are receiving lockout support requests. Each failed attempt is recorded with the IP address, timestamp, and username tried.
- Lockout duration: how long (in minutes) a locked account is blocked from attempting login. The default 5-minute lockout stops most automated credential-stuffing scripts without seriously inconveniencing real users who mistyped their password. For sites with only administrator accounts (no customer-facing logins), a longer lockout (60 minutes or more) adds significantly more friction to automated attacks with no meaningful downside.
Admin Enforcement
- Force 2FA for administrators: when enabled, any administrator who has not yet configured a 2FA method is blocked from accessing the WordPress dashboard after login. They see a prompt to configure 2FA and cannot proceed until they do. There is no bypass. This ensures 2FA is never accidentally skipped on high-privilege accounts, which is the most common failure mode: admins know they should set it up, intend to do it later, and never do.
- Grace period: when you first enable forced 2FA, administrators who haven’t configured 2FA yet are given this many days before enforcement kicks in. This prevents locking out an existing admin team the moment you flip the switch. After the grace period expires, unconfigured accounts are blocked at login until 2FA is set up.
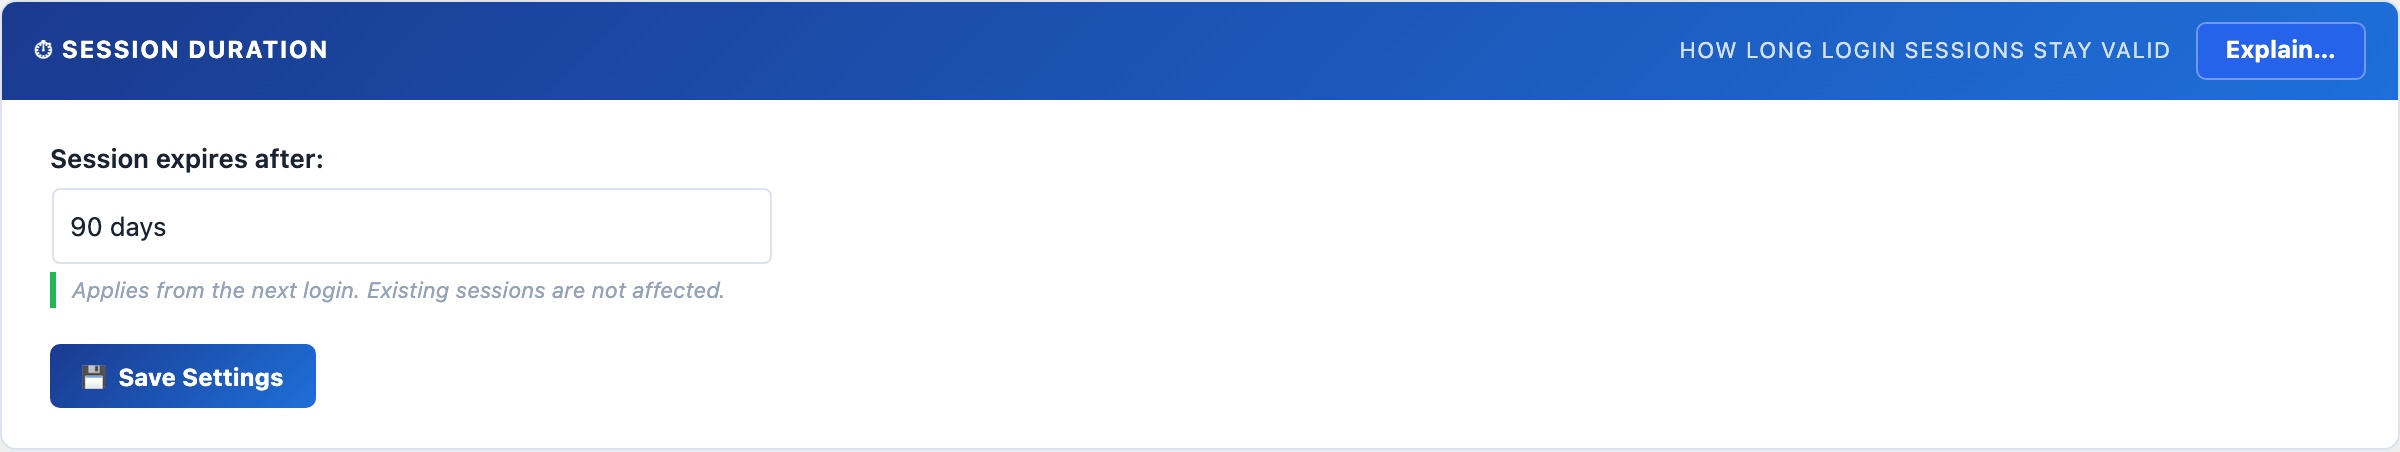
Session Duration
- Custom session length (days): overrides WordPress’s default session timeout (2 days for “Remember Me” sessions, 2 hours otherwise). When set, a persistent cookie keeps the session alive for the specified number of days across browser restarts – useful for admin team members who find constant re-authentication disruptive on a daily-use machine. The session is invalidated immediately when the user logs out. Note: longer sessions extend the window during which a stolen session cookie would be usable. For high-security admin accounts, keep sessions short or leave this at WordPress defaults.
If you or a user gets locked out
If brute-force protection has locked a legitimate account and you need to unlock it immediately, run this WP-CLI command from your server (replace the IP address with the locked address):
wp option delete csdt_login_attempts_1.2.3.4 To clear all lockouts at once: DELETE FROM wp_options WHERE option_name LIKE 'csdt_login_attempts_%' via the SQL Query Tool on the Debug tab, or via phpMyAdmin.
Passkeys (WebAuthn)
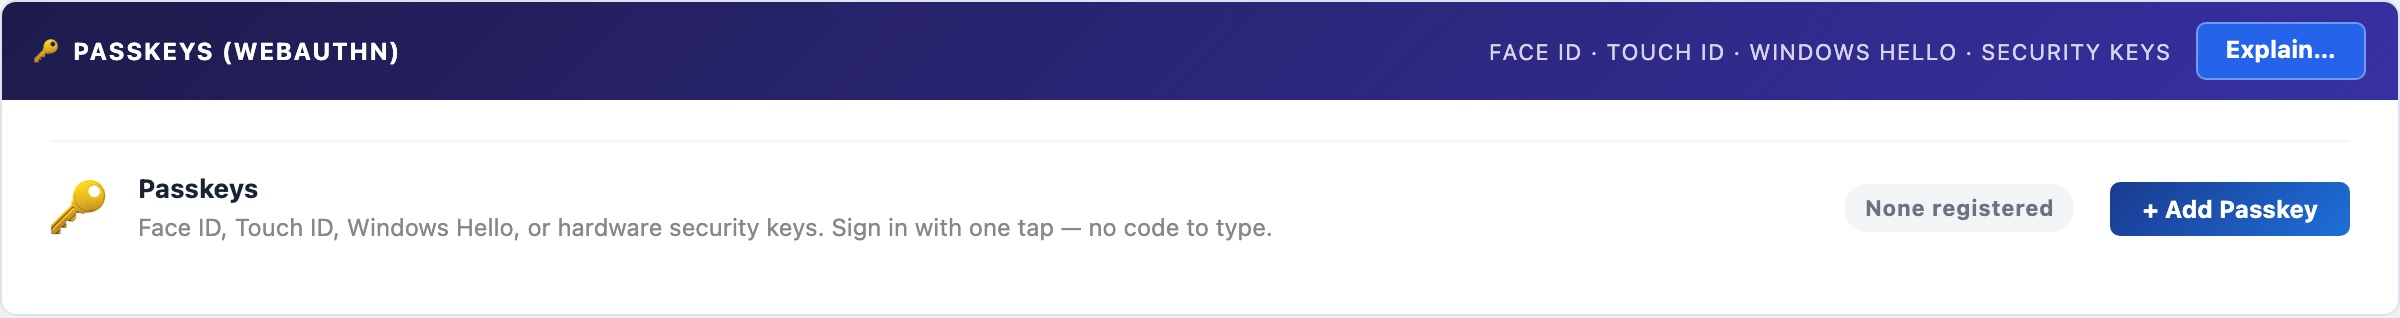
Replace passwords entirely with biometric login: Face ID, Touch ID, Windows Hello, or a hardware security key. Passkeys are cryptographically bound to your exact domain – unlike TOTP codes, they cannot be phished by a fake login page.
🪪 The Most Secure WordPress Login Method Available. And It’s Free.
Even TOTP codes can be phished: a fake login page captures your password and OTP code in real time and replays them instantly. Passkeys cannot be phished this way. They are cryptographically bound to your site’s exact domain; a fake domain simply cannot trigger your passkey. This is the authentication standard used by Apple, Google, and Microsoft for their own products, now available for your WordPress site at no cost.
Most WordPress passkey plugins don’t exist as free products. The handful that do charge $50–$100/year for a commercial FIDO2 implementation. CloudScale’s passkey support is a full WebAuthn/FIDO2 implementation, open-source, and completely free.
How it works: When you register a passkey, your device generates a public/private key pair. The private key never leaves your device. At login, your server sends a random challenge; your device signs it with the private key; the server verifies the signature against your stored public key. No secret is ever transmitted over the network.
Supported authenticators: Face ID (iPhone, iPad, Mac), Touch ID (MacBook), Windows Hello (fingerprint, face, PIN), Android biometrics, and hardware security keys (YubiKey 5 series, Google Titan, etc.).
Registering a passkey:
- Click + Add Passkey and give it a label (e.g. “iPhone 16 Pro”, “YubiKey”).
- Click Register and your browser will prompt for biometric confirmation or a hardware key tap.
- The passkey is saved to your account. Register one per device you log in from.
Browser support: Chrome 108+, Safari 16+, Edge 108+, Firefox 122+. If a browser doesn’t support passkeys, the login flow falls back to email OTP automatically, so no user is ever locked out.
Session Duration
Controls how long WordPress login sessions remain valid before users must re-authenticate. The default is 2 days. Shorten this for high-security admin accounts or extend it for trusted internal teams who find frequent re-login disruptive.
⏱ How Long Should a Login Session Last?
WordPress’s default is 2 days. That’s a reasonable balance between security (re-authenticate regularly) and convenience (don’t interrupt a working developer). Adjust this to match your team’s workflow and your site’s security posture.
Session duration controls how long the WordPress auth cookie is valid before the user must enter their password again. When a custom duration is set, the Remember Me checkbox at login is overridden – all sessions get the same lifetime, and it applies to browser restarts (the cookie persists rather than expiring when the browser closes).
Recommended durations by context
- 1–3 days: banking sites, client portals, any site with sensitive customer data. Force frequent re-authentication to limit the window of a stolen session cookie.
- 7–14 days: most business sites and WordPress blogs. Frequent enough to catch stolen credentials; infrequent enough to not frustrate legitimate users.
- 30–90 days: internal tools used by a small trusted team on known devices. Convenience wins when the threat model is low.
- WordPress default (2 days): leave this setting empty or set to “Default” to keep WordPress’s built-in behaviour.
Important: changing this setting only affects new logins. Users who are already logged in keep their current session until it expires or they log out manually. If you need to force a full re-login for all users immediately (e.g. after a suspected credential compromise), use the Log Out All Users option in the WordPress Users settings, or run wp user session destroy --all via WP-CLI.
Brute-Force Protection
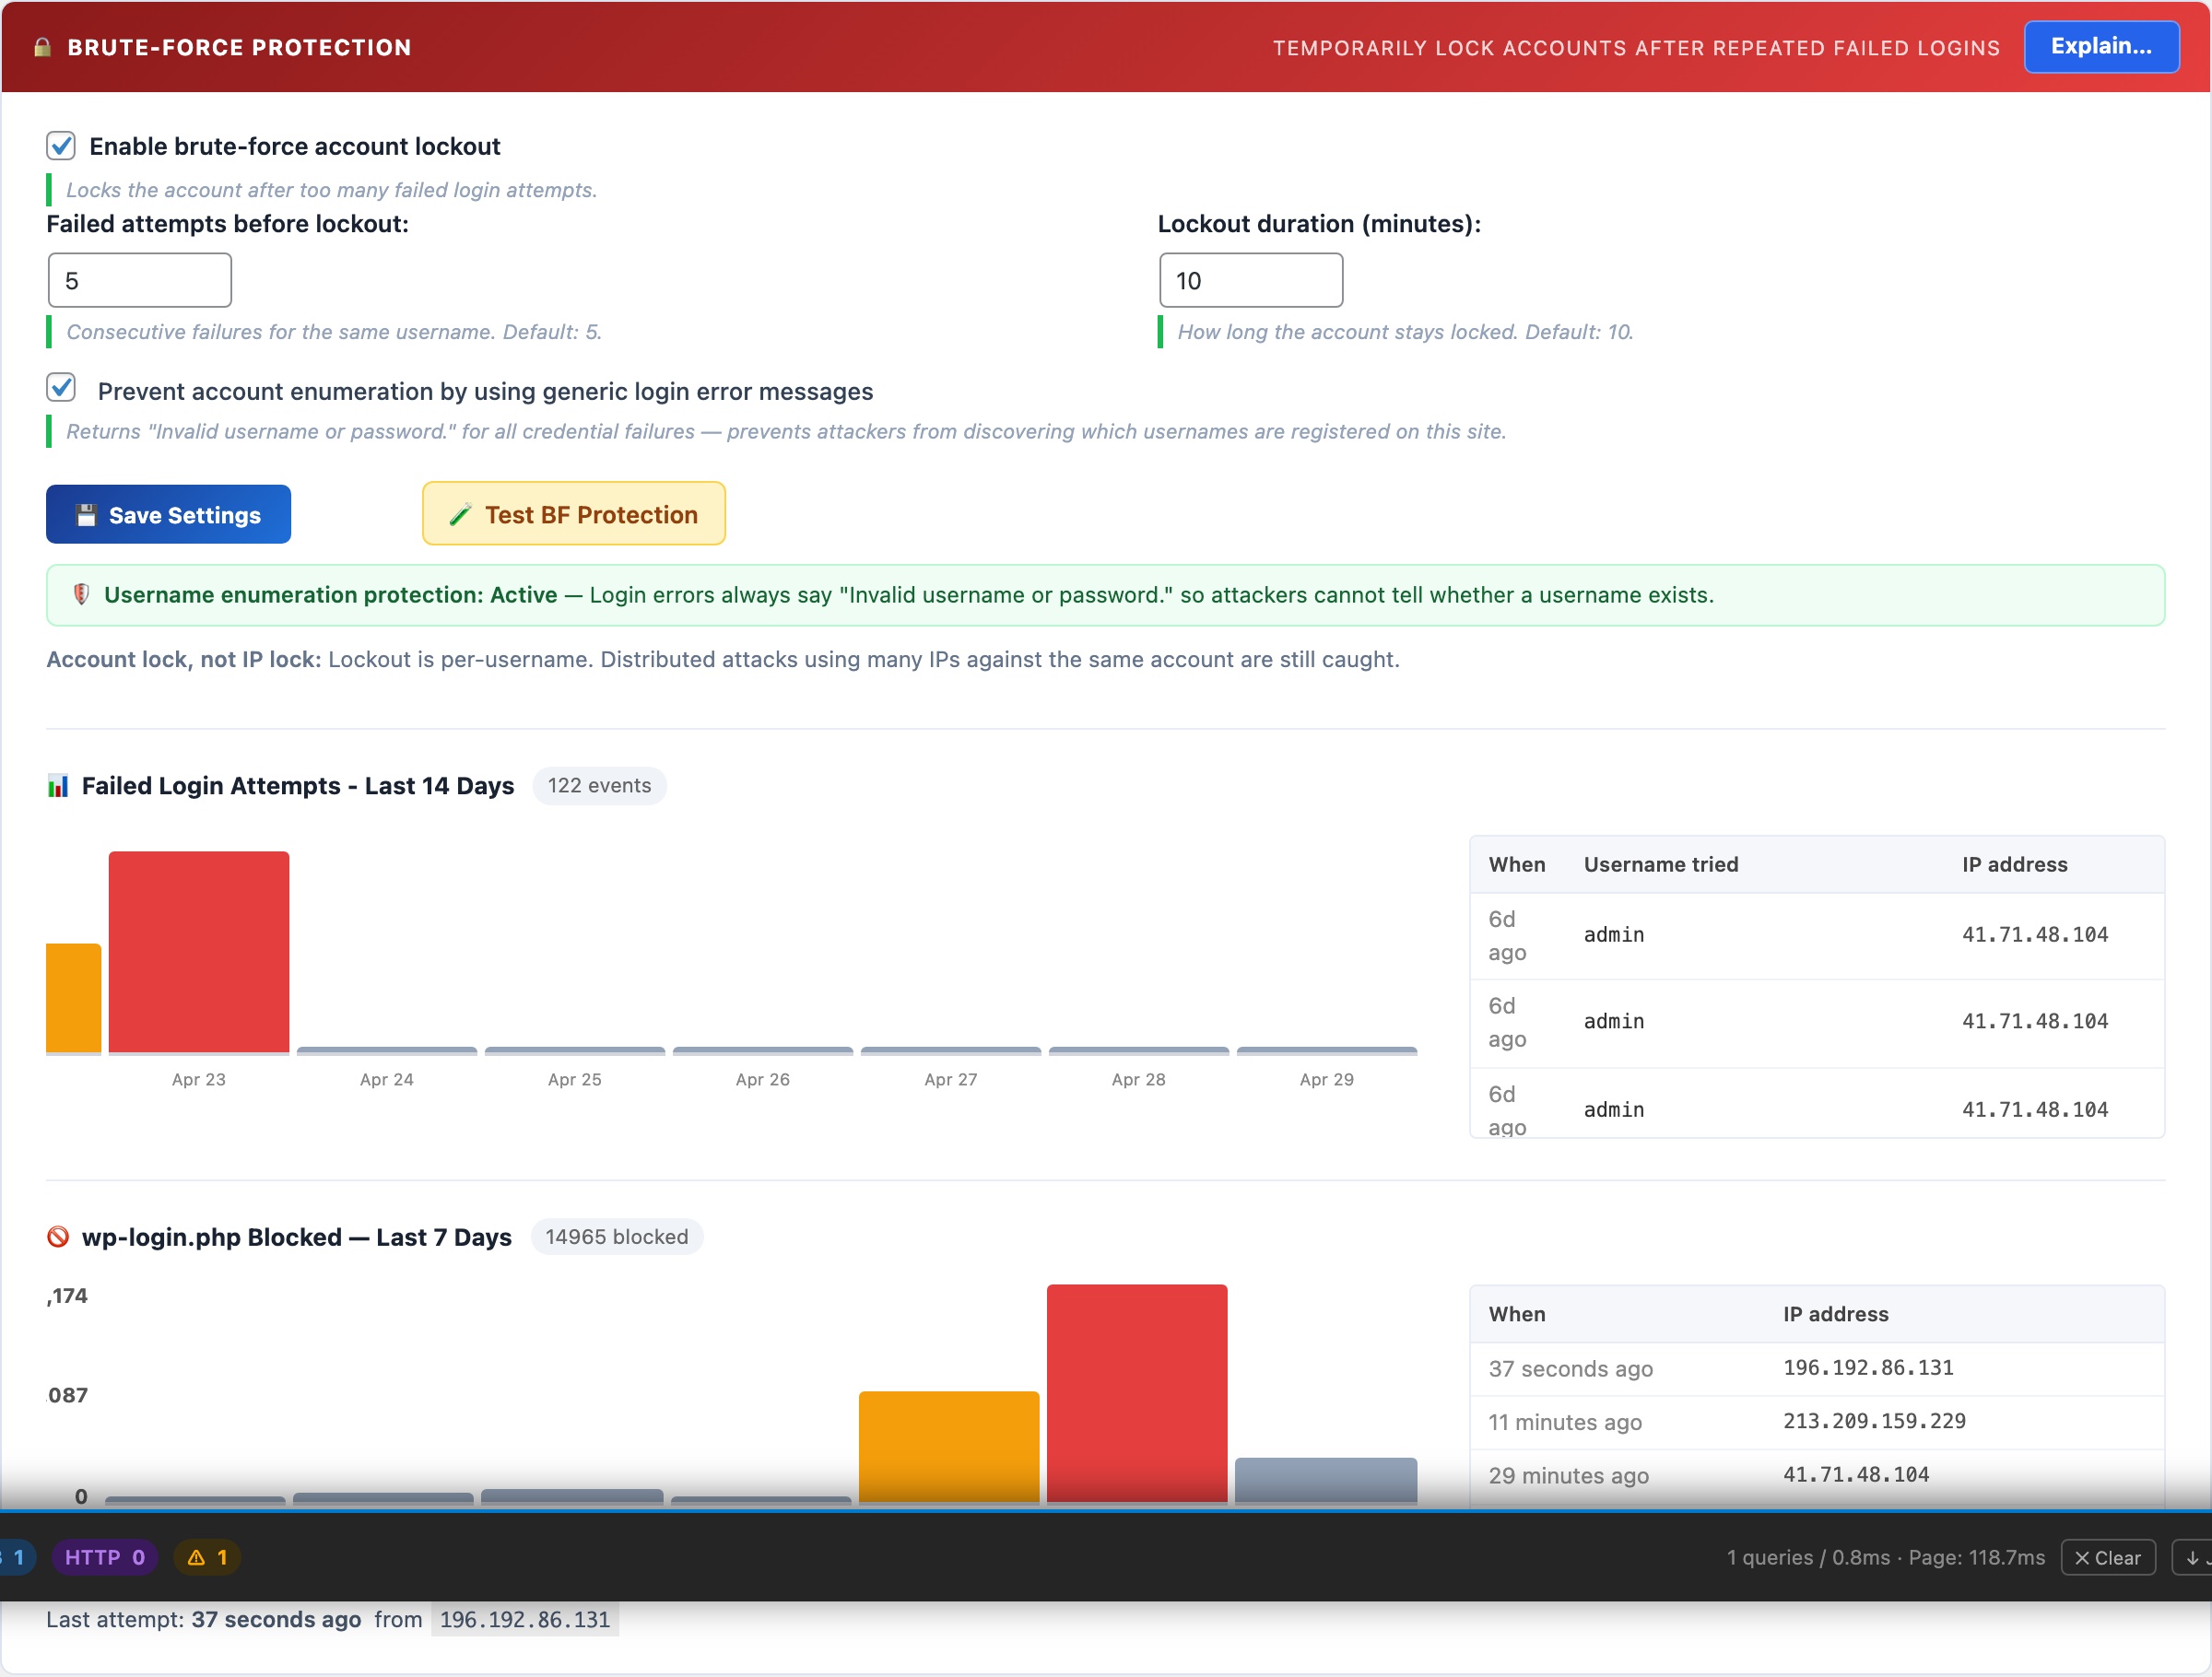
Locks an account temporarily after a configurable number of consecutive failed login attempts. Protection is per-username rather than per-IP, so distributed attacks spread across thousands of IP addresses are blocked just as effectively as single-source attacks.
🔒 Stop Credential-Stuffing Attacks at the Login Form
Automated bots try thousands of username/password combinations against every reachable WordPress login page. Brute-force protection locks an account after a configurable number of failed attempts, making mass credential-stuffing attacks economically unviable – the attacker’s bot moves on to the next target.
The lockout works per-username, not per-IP address. This is the critical difference from IP-rate-limiting: a distributed attack that uses 10,000 different IP addresses (a botnet) is blocked just as effectively as a single-machine attack, because both result in failed attempts for the same target username. Once the threshold is crossed, that account is locked for the configured duration regardless of how many IPs are trying.
Settings
- Maximum login attempts: consecutive failures before lockout. Default is 5. Lower to 3 for maximum security; raise to 10 if legitimate users frequently mistype passwords and you receive lockout support requests.
- Lockout duration: how long the account is blocked. Default is 10 minutes – enough to defeat most automated scripts. For admin-only sites with no public users, 60 minutes or longer adds significant friction to targeted attacks.
- Account enumeration protection: WordPress normally reveals whether a username exists via different error messages (“username not found” vs “wrong password”). Enabling this makes both errors return the same generic message, removing a reconnaissance tool attackers use to build target lists. There is no downside to enabling this.
Unlocking a locked account
If a legitimate user is locked out, you can clear their lockout immediately from the SQL Query Tool or WP-CLI without waiting for the timeout to expire:
DELETE FROM wp_options WHERE option_name LIKE 'csdt_devtools_lockout_%' This clears all active lockouts. To clear a specific username: replace % with the exact username (e.g. csdt_devtools_lockout_johndoe).
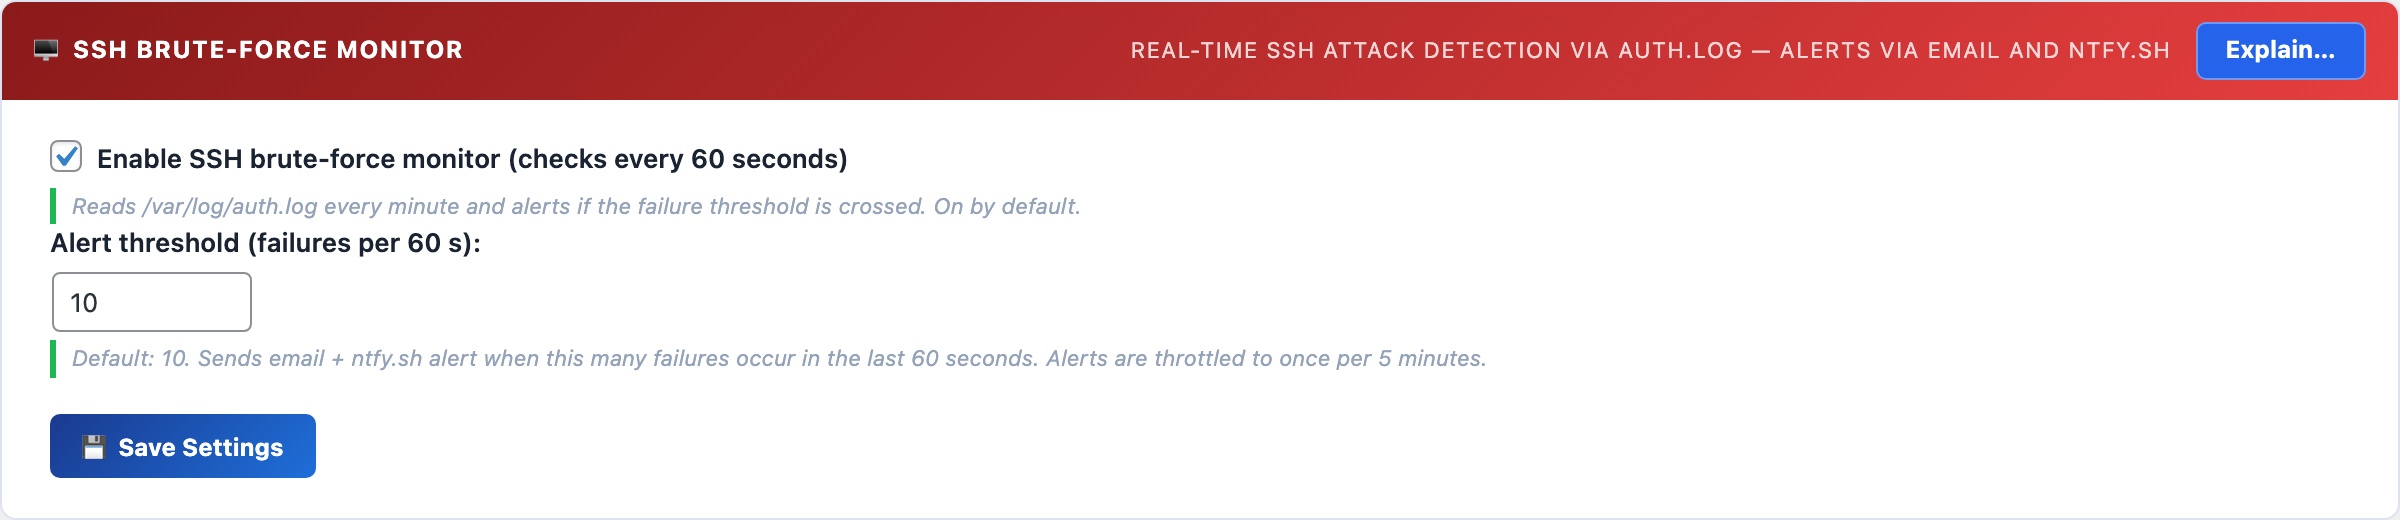
SSH Brute-Force Monitor
Reads your server’s auth.log every 60 seconds to count SSH failed login attempts. When the count exceeds your threshold in a rolling window, it fires an instant alert via email and push notification. Works alongside fail2ban – this plugin detects and alerts; fail2ban does the blocking.
🖥️ Know the Moment Your SSH Port Is Under Attack
A server with SSH port 22 open to the internet will be targeted by automated scanners within minutes of going online. Most sites never know they’re under attack because these attempts are silent unless you’re watching the auth log. The SSH monitor brings that visibility to your WordPress dashboard.
The monitor tails /var/log/auth.log via an AJAX poll every 60 seconds. It counts Failed password and Invalid user entries in a rolling time window. When the count exceeds your threshold, an alert fires to your configured email and ntfy.sh topic. Alerts are throttled to once per 5 minutes to prevent notification floods during sustained attacks.
Setup
- The monitor requires the web server user (
www-data) to be able to read/var/log/auth.log. If the panel shows a warning, run:sudo usermod -a -G adm www-data && sudo systemctl restart php-fpm - Set your alert threshold – default is 10 failures in 60 seconds. This is calibrated to avoid false positives from a user mistyping their password, while catching any automated scanner instantly.
- Save settings. The monitor polls automatically from then on.
Detection vs. Blocking: use fail2ban alongside this
The SSH Monitor detects attacks and alerts you. It does not block IPs. For automatic IP blocking, install fail2ban:
sudo apt install fail2ban && sudo systemctl enable fail2ban With fail2ban’s default configuration, an IP is banned for 10 minutes after 5 failed SSH attempts. The CloudScale monitor shows you when attacks are happening at a volume that exceeds even fail2ban’s tolerance – a sign that you’re under a sustained, distributed attack that warrants additional action (firewall rules, port change, or contacting your hosting provider).
AI Cyber Audit
Uses frontier AI – Anthropic Claude or Google Gemini – to analyse your entire WordPress installation and return a prioritised, scored security report in under 60 seconds. Unlike signature-based scanners, the AI reasons from first principles: it reads your actual configuration and code, identifies risk combinations no database can match, and gives you specific fix steps for your exact setup.
🛡️ A Security Consultant in Your WordPress Dashboard, for Free
A professional WordPress security audit costs $500–$5,000 and takes days to schedule. Generic security checklists from free plugins tell you what to check but not what it means for your specific site. CloudScale connects directly to the world’s most capable AI models: Anthropic Claude 4 and Google Gemini 2.5 Pro. It analyses your entire WordPress installation and delivers a scored, prioritised report with specific remediation steps in under 60 seconds. The same class of AI used by enterprise security teams, working on your site.
Wordfence Premium costs $119/year. Sucuri costs $199/year. WPScan costs $25–$75/month. These tools run signature-based scans; they match known patterns against a database. They cannot identify novel threats, unusual configuration combinations, or the specific risk profile of your setup. CloudScale’s AI audit reasons from first principles: it reads your actual configuration, your actual code, and delivers findings that are specific to you, not generic checklist items.
Standard Scan audits WordPress core settings, active plugins and themes, user accounts, file permissions, and wp-config.php hardening constants. The AI scores each finding Critical / High / Medium / Low and gives you specific steps to fix it: not generic advice, but instructions for your exact configuration.
Deep Dive Scan adds live probes your site’s security team would run manually:
- Static PHP code analysis of every active plugin, flagging
eval(), shell execution functions, code obfuscation, and suspicious patterns that malware authors use - Live HTTP probes: open directory listing, weak TLS (SSLv3, TLS 1.0), CORS misconfigurations, server version header leaks
- DNS security checks: SPF strictness, DMARC policy strength, DKIM probes (skipped entirely for domains with no MX records, so there are no false positives for non-email sites)
- CSP quality analysis: flags
unsafe-inline,unsafe-eval, wildcard sources, and missing directives in your Content Security Policy - SSH hardening: probes port 22, reads sshd_config, checks for fail2ban; unprotected SSH is marked CRITICAL because it is actively used to recruit servers into DDoS botnets
- AI Code Triage: the 10 highest-risk static findings are sent to the AI with surrounding code context; each is classified as Confirmed Threat / False Positive / Needs Review before the main audit runs
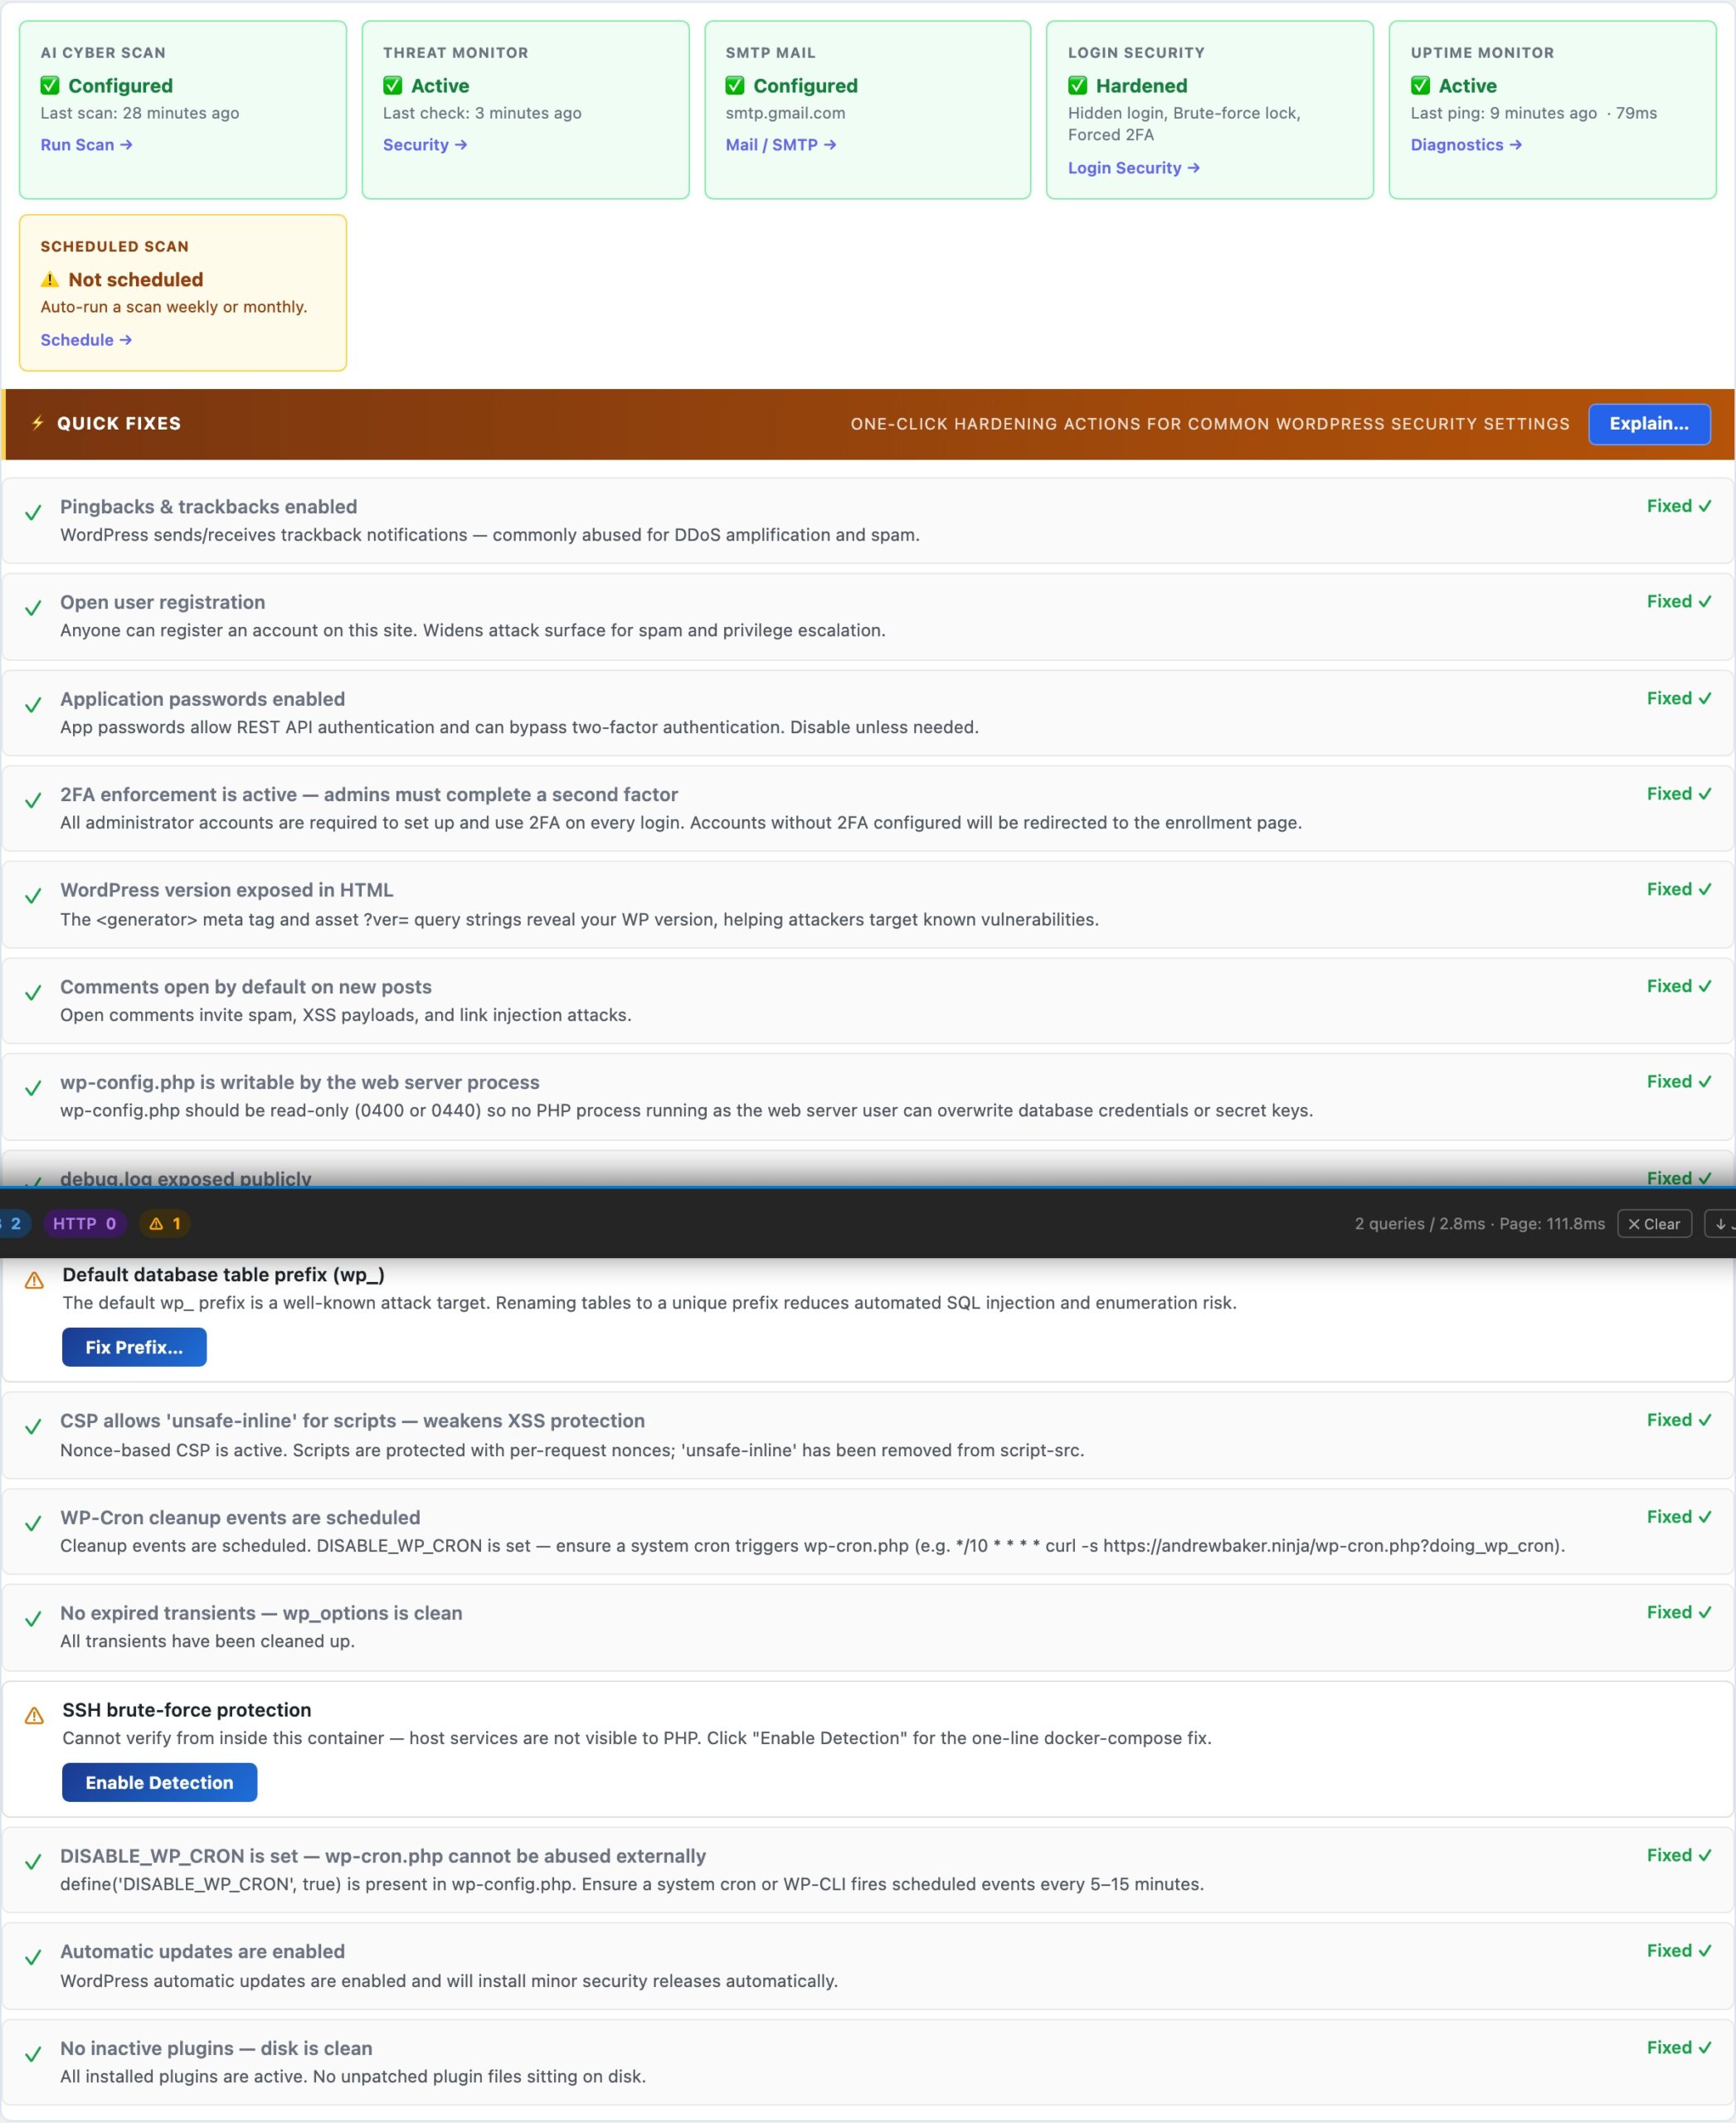
Quick Fixes appear above the scan results, providing one-click remediations for the most common misconfigurations. Each shows green (done) or amber (needs attention) at a glance.
Scheduled Scans run automatically on a daily or weekly schedule with email and push notifications (ntfy.sh supported), so you know about problems before your users or Google do.
Setting Up Your AI Provider
You need one API key to use the AI Cyber Audit. Google Gemini has a free tier with no credit card needed. Anthropic Claude requires a credit card but delivers the deepest analysis. Either works; both are excellent.
Option A: Google Gemini (Free, No Credit Card)
Google AI Studio’s free tier gives you access to Gemini 2.0 Flash with generous daily limits, more than enough for daily WordPress security scans. No billing setup required. This is the recommended starting point if you’ve never used an AI API before.
- Go to aistudio.google.com/app/apikey
- Sign in with your Google account
- Click “Create API key” and select any Google Cloud project (or create a new one)
- Copy the key; it looks like
AIzaSy... - In WordPress: Tools → Cyber and Devtools → Security tab → AI Settings
- Select Google Gemini as provider, paste your key, select model, click Save
Free tier limits: Gemini 2.0 Flash gives you 15 requests/minute, 1,500 requests/day, and 1 million tokens/day. A standard WordPress scan uses approximately 3,000–8,000 tokens. You can run dozens of scans per day at no cost.
Want Gemini 2.5 Pro? That model requires a paid Google AI Studio account. Go to aistudio.google.com, click your account, then Billing, and enable pay-as-you-go. Gemini 2.5 Pro costs approximately $0.01–0.03 per scan.
Option B: Anthropic Claude (Deepest Analysis, Credit Card Required)
Claude Sonnet 4.6 and Opus 4.7 deliver the most thorough security reasoning available. Anthropic does not offer a free tier, but the cost is minimal: a deep dive audit with Claude Opus 4.7 typically costs $0.05–0.15. An entire month of daily scans with Claude Sonnet 4.6 costs under $1.
- Go to console.anthropic.com and create an account
- Go to Settings → Billing and add a credit card
- Add an initial credit ($5 is plenty to get started and covers hundreds of standard scans)
- Go to Settings → API Keys and click “Create Key”
- Give it a name like “WordPress Security” and copy the key; it looks like
sk-ant-api03-... - In WordPress: Tools → Cyber and Devtools → Security tab → AI Settings
- Select Anthropic Claude as provider, paste your key, select model, click Save
Model guide: claude-sonnet-4-6 is fast and excellent for standard scans and daily scheduling. claude-opus-4-7 is the most capable model available and is recommended for deep dive scans and critical sites. Use Auto mode in the plugin to let it pick the right model for each scan type.
⚡ Setting Up Automatic Top-Ups (Anthropic)
If you use scheduled daily scans with Claude, your credit balance will gradually decrease. Automatic top-ups ensure your scans never fail due to an empty balance. Anthropic recharges your account automatically when it drops below a threshold you set.
- Go to console.anthropic.com/settings/billing
- Scroll to “Automatic recharge”
- Toggle it on
- Set “Recharge when balance falls below” to $2 (works well for moderate usage)
- Set “Recharge amount” to $10 (covers several months of daily scans)
- Click Save
Tip: Anthropic sends email receipts for each top-up. Set a usage budget alert at Settings → Limits (e.g. $5/month) so you get notified if usage spikes unexpectedly.
⚡ Setting Up Spend Alerts (Google Paid Tier)
If you upgrade to Gemini 2.5 Pro on Google’s pay-as-you-go tier, Google bills your card automatically as you use the API, with no manual top-up process. Usage is charged to your linked payment method at the end of each billing period.
- Go to console.cloud.google.com/billing
- Select your project, then click Budgets & Alerts
- Click “Create Budget”
- Set a monthly budget (e.g. $5) and email alert thresholds at 50%, 90%, and 100%
- Click Save and Google will email you if spend approaches your limit
Note: Google does not cut off API access when a budget alert fires; it only sends a notification. To hard-cap spend, enable the “Actions” option in the budget and select “Disable billing” (use cautiously, as this will break any Google Cloud services in the project).
AI Site Auditor
One button scans all your published content and database, then returns a prioritised list of SEO gaps, thin content, missing images, database bloat, and security misconfigurations – each with a specific fix instruction. No external crawlers, no data sent to third parties, no Screaming Frog licence required.
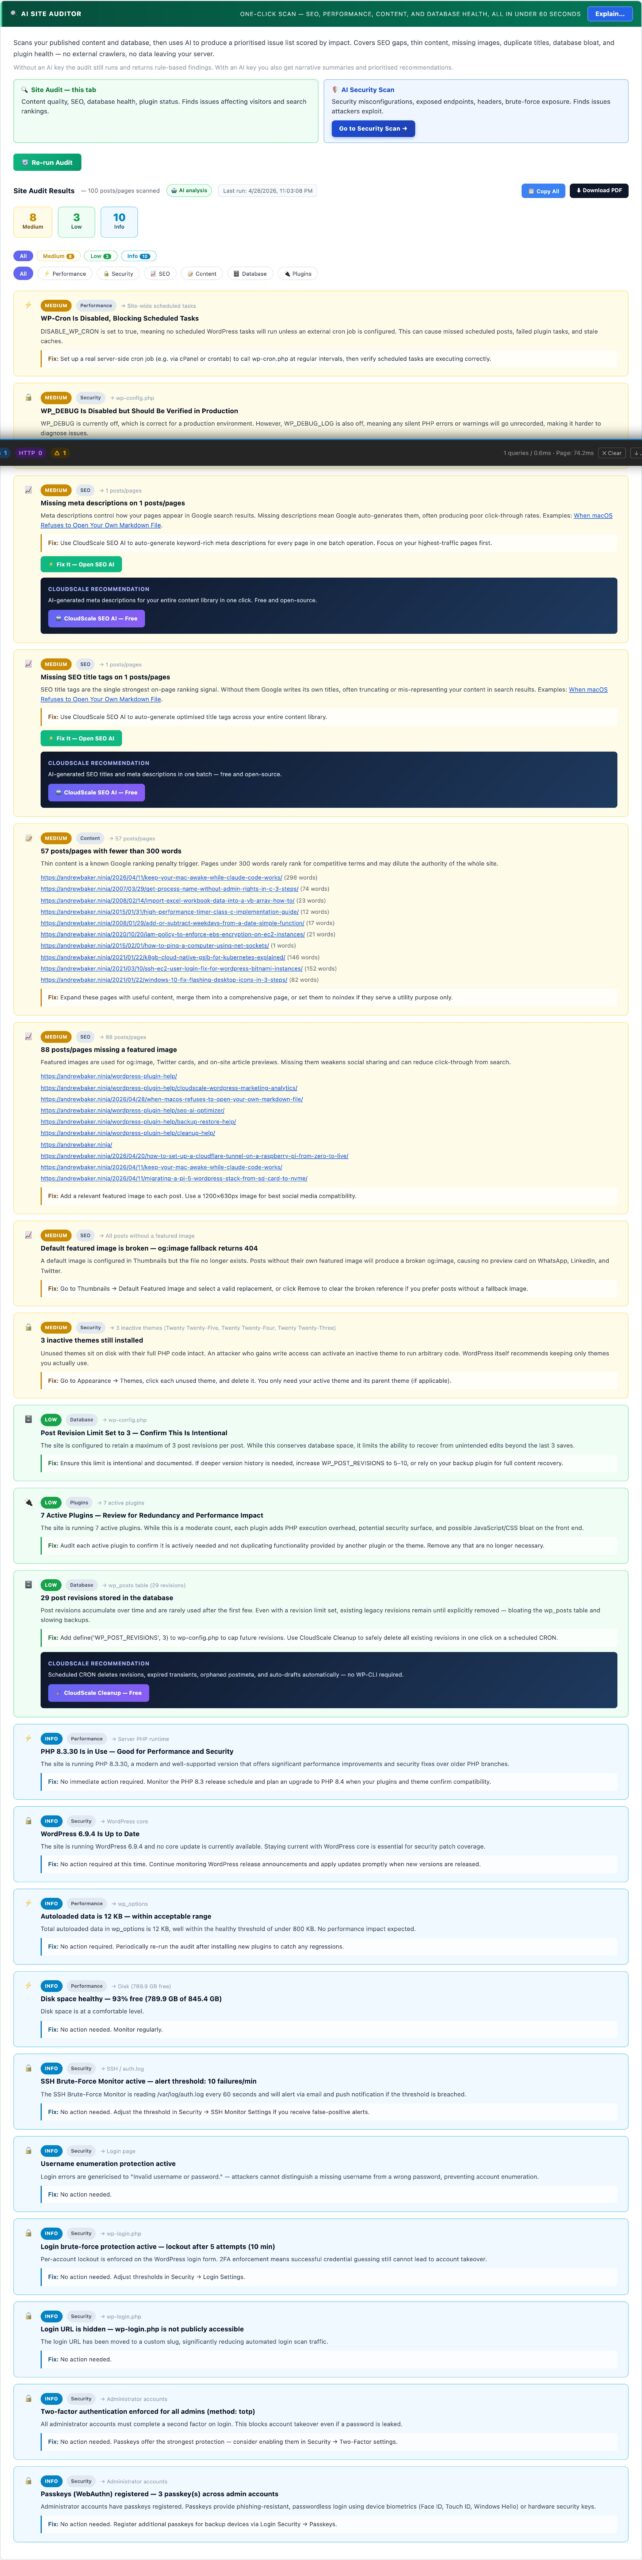
🔍 Your Entire Site Audited in Under 60 Seconds
One button. CloudScale scans all your published content and your database, then uses AI to return a prioritised list of issues scored by impact – SEO gaps, thin content, missing images, database bloat, inactive plugins, security misconfigurations. No external crawlers, no data sent to third parties, no Screaming Frog licence required.
Works without an AI key – rule-based findings run instantly. Add an API key on the Security tab for AI-written summaries, root-cause explanations, and deeper recommendations.
Most WordPress site owners have no idea what their site actually looks like to Google. Their posts feel complete when written, but from the outside the picture is different: a meta description missing on half the posts so Google writes its own (usually a random sentence pulled from the article body that is rarely anyone’s best pitch to a reader), featured images absent on a quarter of posts making social shares look blank, the autoload table quietly growing to 5MB so every admin page loads sluggishly, and post revisions accumulating until they consume 30% of total database storage. None of this is visible when you are reading your own content. The Site Auditor shows you what Google and your database actually see.
The audit runs entirely inside your WordPress installation. No external crawler visits your site, no third party receives your content. The scanner reads your database directly, inspects your published posts, checks your WordPress configuration, and assembles a prioritised findings report in seconds. If you have an AI API key configured, the gathered statistics are sent to the AI for deeper interpretation – but your actual post content is never transmitted, only counts and metadata.
What the audit checks
- SEO – missing meta descriptions: posts and pages with no meta description written. Google writes its own for these pages, pulling a random sentence from your content. That sentence is rarely your best pitch to a reader deciding whether to click. Each finding links directly to the affected posts so you can fix them one by one, or use the AI Meta Description Writer (if you have the CloudScale SEO plugin) to fix them in bulk.
- SEO – missing SEO titles: pages where the title tag defaults to the raw post title with no customisation. A well-written title targets a keyword naturally, includes your brand name where appropriate, and stays under 60 characters. Posts without a custom title are flagged with a link to edit them.
- SEO – duplicate page titles: multiple posts sharing the same title tag. Google treats these as competing for the same search query, which dilutes ranking signals across both. Usually caused by applying the same template title to similar posts without customising the SEO field per post.
- Content – thin pages: published posts under 300 words. Thin content pages are unlikely to rank for competitive queries and can dilute your site’s overall quality score in Google’s assessment. The audit shows each thin post with its word count so you can decide whether to expand it, redirect it to a related page, or mark it noindex.
- Content – missing featured images: posts with no featured image set. Featured images are used for OpenGraph social previews (what LinkedIn, WhatsApp, Slack show when someone shares your link), related article thumbnails, and Google Discover cards. A missing featured image means blank or placeholder previews everywhere your posts are shared.
- Performance – autoloaded options bloat: WordPress loads certain plugin settings on every single page request via the
wp_optionstable withautoload=yes. When deactivated plugins leave their data behind, or when plugins store large amounts of data in autoloaded options, the total grows and slows every page. CloudScale flags this when total autoloaded data exceeds 500KB and tells you the exact size so you can measure improvement after cleanup. - Performance – excess active plugins: sites with more than 20 active plugins. Each plugin adds PHP execution time, potential database queries, and JavaScript or CSS assets to every page request. This is an informational finding – not every plugin is replaceable – but it prompts a review of whether every installed plugin is genuinely active and necessary.
- Database – expired transients: WordPress caches temporary data in the
wp_optionstable as transients with an expiry time. Expired transients should be removed automatically by WP-Cron, but on sites with unreliable cron execution they accumulate as dead rows, contributing to autoload bloat and slower queries on a table that WordPress reads on every request. - Database – post revisions: every draft save or published-post update creates a revision. With no limit configured, a heavily-edited post can accumulate hundreds of revisions. These rows are safe to remove once a post is live and they represent no SEO value. The audit shows the total revision count and the number of rows that can be safely cleaned.
- Database – orphaned post meta: when a post is deleted, its corresponding rows in
wp_postmetaare not always cleaned up by WordPress or the plugin that created them. Orphaned meta rows accumulate over time and slow queries that join against the meta table. - Plugins – inactive plugins on disk: deactivated plugins remain on your server and present an attack surface even when disabled. A plugin with a known CVE is exploitable via direct file access even if it is not active. The audit lists every inactive plugin as a reminder to remove rather than just deactivate plugins you no longer use.
- Security – WP_DEBUG in production: when
WP_DEBUGis enabled on a live site, PHP notices, warnings, and errors are displayed to visitors. This leaks file paths, function names, database structure details, and plugin version information that attackers use to identify and target specific vulnerabilities. WP_DEBUG should only be enabled in local development environments.
Reading the results
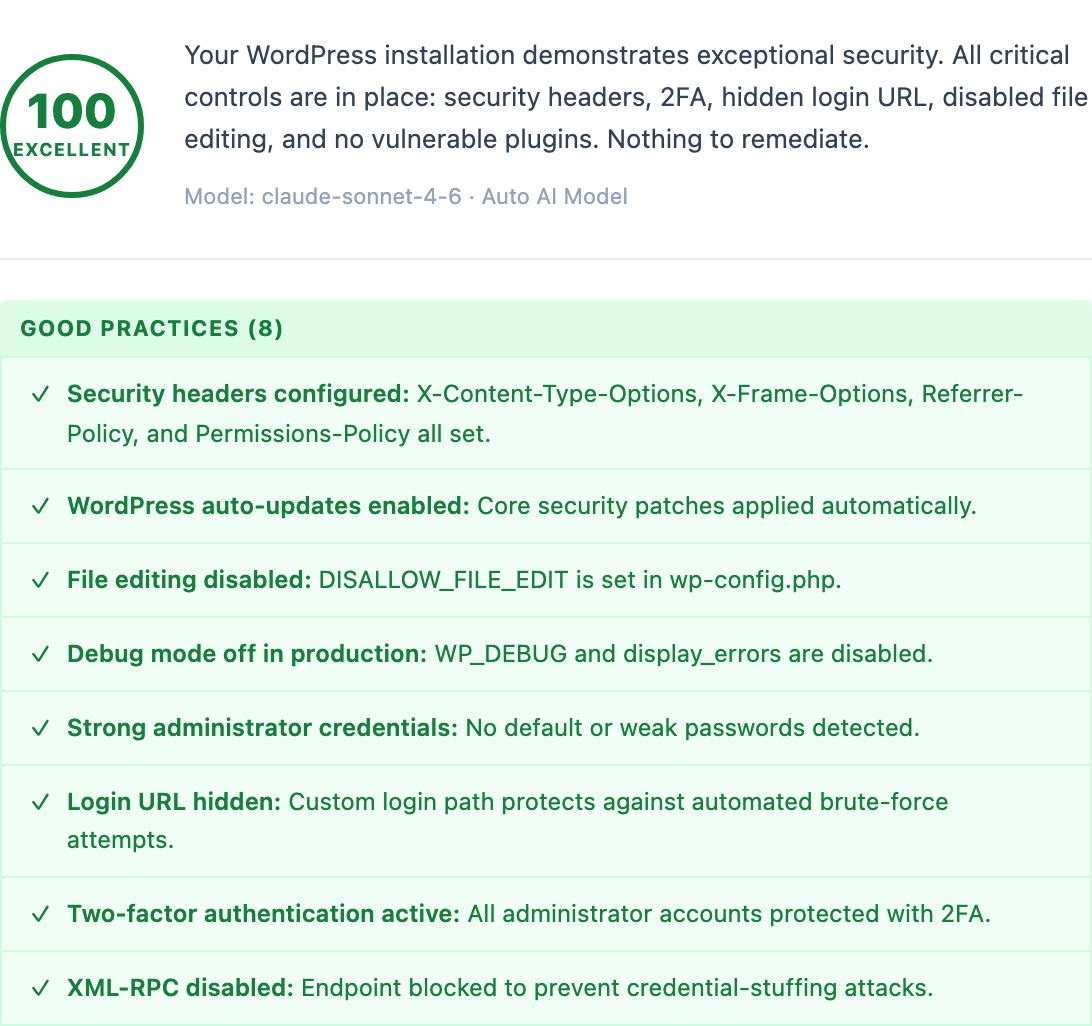
Findings are sorted by severity: Critical → High → Medium → Low → Info. The scorecard at the top shows the count at each level so you know at a glance how much work you have. Each finding card shows the severity badge and category for quick triage, the affected post count or database metric, a plain-English explanation of why the finding matters, and a specific fix instruction. For content findings, clickable post links open the post editor directly so you can address each one without leaving the audit results.
Use the category filter buttons (SEO, Content, Performance, Database, Security) to focus on one area at a time. Run the audit again after each fix session to see your score improve.
Quick Fix buttons
Database findings (expired transients, post revisions, orphaned meta) show a Fix It button that runs the cleanup operation server-side and immediately re-checks the finding. Each operation is safe to run on any live WordPress site. The fix shows you the number of rows removed so you can see the before and after impact on your database size.
Privacy and data handling
All scanning runs inside your WordPress installation – no content or metadata leaves your server during the rule-based analysis pass. If you have an AI API key configured, aggregated site statistics (post counts, word counts, database metrics) are sent to the AI provider for deeper interpretation. Your actual post content is never transmitted – only counts and aggregate measurements.
Run the audit before and after making changes
Run the Site Audit before a major plugin change or cleanup sprint to establish a baseline. After making fixes, run it again and compare the scorecards. This is especially useful before and after cleaning up database bloat – the autoloaded options KB figure should drop measurably after removing redundant plugin data. Save a screenshot of the findings list before a sprint and compare it to the results afterwards to confirm the improvements are real.
Threat Monitor
Runs three passive background checks every 5 minutes: file integrity monitoring (detects unexpected changes to WordPress core files), new administrator alerts (fires the instant an admin account is created or promoted), and web probe detection (counts requests to sensitive endpoints and alerts on sudden spikes).
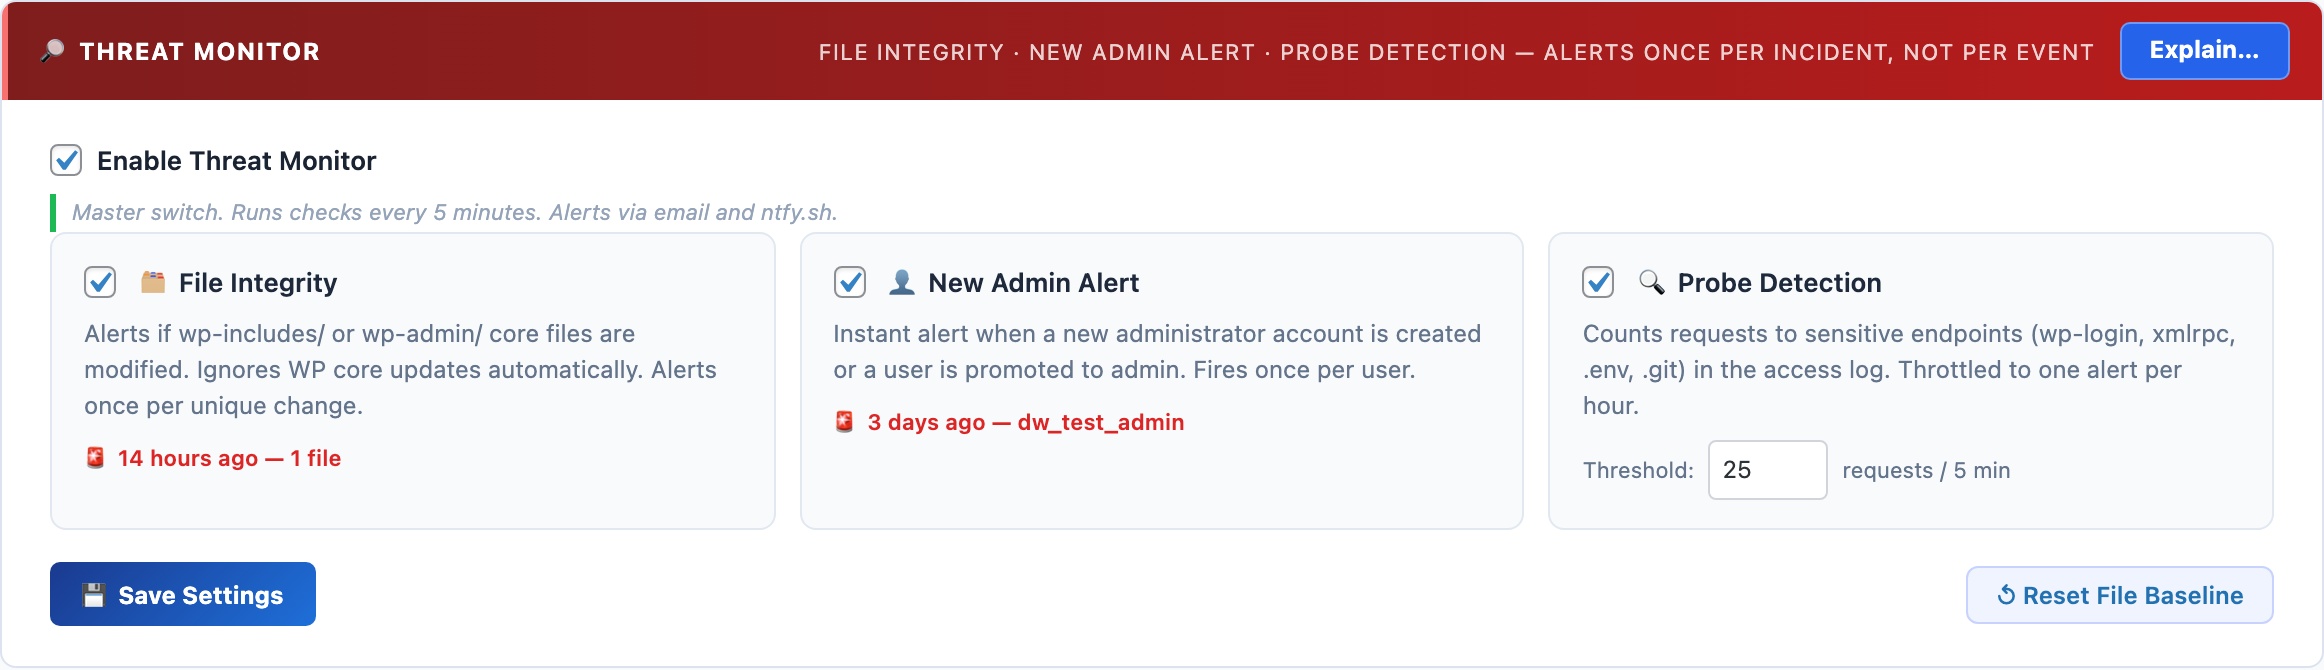
🔎 Passive Threat Detection That Runs While You Sleep
The AI Cyber Audit gives you an on-demand snapshot. The Threat Monitor runs in the background 24/7, watching for the specific events that indicate an active compromise: a core file being modified, a new admin account appearing, or a wave of probe requests hitting your login page.
File Integrity Monitor
Scans wp-includes/*.php and wp-admin/*.php every 5 minutes and compares file modification times against a baseline. If any file changes outside of a WordPress core update, you get an immediate alert. This catches the most common post-compromise action: a backdoor dropped into a core PHP file.
Anti-spam: the baseline is rebuilt silently when WordPress updates (all core files change legitimately during updates). The same modification timestamp is never alerted twice. After a manual code change you authored, click Reset File Baseline to clear the alert state.
New Administrator Alert
Fires the instant a WordPress user is created with the Administrator role, or an existing user is promoted to Administrator. Attacker privilege escalation – gaining admin access – is a critical step in most WordPress compromises. This alert catches it the moment it happens rather than during the next scheduled audit.
Anti-spam: each user ID is alerted exactly once. Acknowledging the alert (or adding the user legitimately) prevents repeated notifications for the same account.
Web Probe Detection
Reads the web server access log (byte-offset tracking, so only new entries are processed each check). Counts requests to sensitive endpoints: wp-login.php, xmlrpc.php, wp-config.php, .env, .git/, and shell-injection patterns. When the count exceeds the threshold (default: 25 in 5 minutes), an alert fires. Throttled to at most once per hour to prevent alert floods during sustained scans.
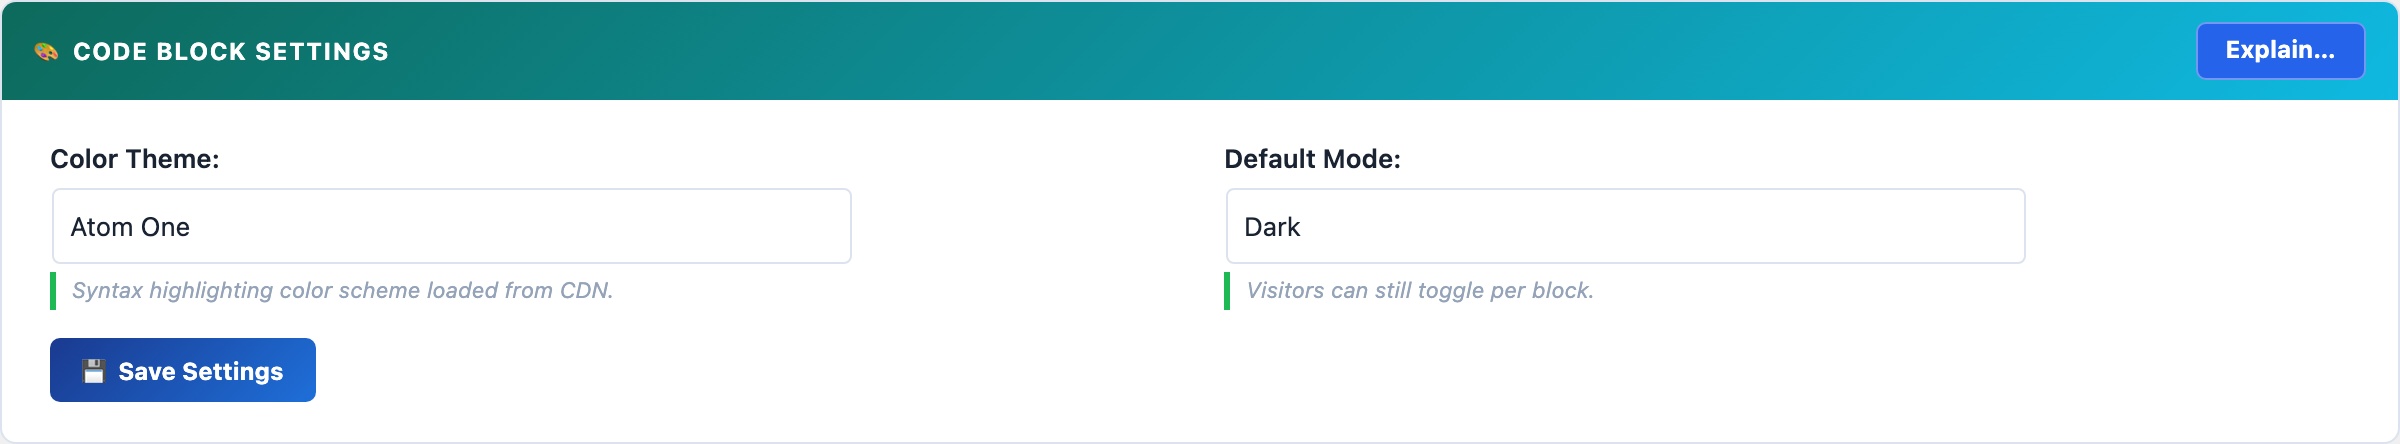
Code Block
Syntax-highlighted code blocks powered by highlight.js, running entirely on your own server with zero CDN calls. Supports 190+ languages and 14 professional colour themes – completely free, with no impact on your Core Web Vitals score.
💻 Beautiful Code Blocks Without Paying $50/Year or Slowing Your Site Down
Most WordPress code highlighting plugins have one of two problems: they load scripts from an external CDN (adding 100–300ms to every page load, hurting your Core Web Vitals score, and breaking if the CDN goes down), or they charge $30–$50/year for features that should be free. Enlighter loads from their own servers. SyntaxHighlighter Evolved loads from WordPress.com’s CDN. Prismatic charges $29/year for a theme switcher.
CloudScale bundles highlight.js 11.11.1 entirely on your own server: zero external HTTP requests, zero CDN dependency, zero annual fee. Your pages load faster, your cache hit rates improve, and your syntax highlighting works even when third-party services are down.
The Code Block is a native Gutenberg block (cloudscale/code) and a [cs_code] shortcode. It works everywhere WordPress renders content.
190+ languages with auto-detection. CloudScale detects the language automatically from the code content. Override it manually in the block sidebar when detection picks the wrong one.
14 professional colour themes: Atom One Dark/Light, GitHub, Monokai, Nord, Dracula, Tokyo Night, VS Code, VS 2015, Stack Overflow, Night Owl, Gruvbox, Solarized, Panda, Shades of Purple. A toggle button switches between dark and light variants, storing the preference in localStorage so it follows the reader across pages.
Copy to clipboard with one click. Line numbers are rendered via CSS counter so they are never included when someone copies the code.
INI/TOML auto-repair: Gutenberg breaks INI and TOML files at bare [section] headers by treating them as block delimiters. CloudScale detects this silently and reassembles the fragments, showing a brief toast so you know it happened.
Code Block Migrator
Converts all posts using legacy code block formats – WordPress core blocks, SyntaxHighlighter, Enlighter shortcodes – to CloudScale blocks in a single batch operation. Scan → preview the diff per post → migrate everything in one click, with no manual post editing.
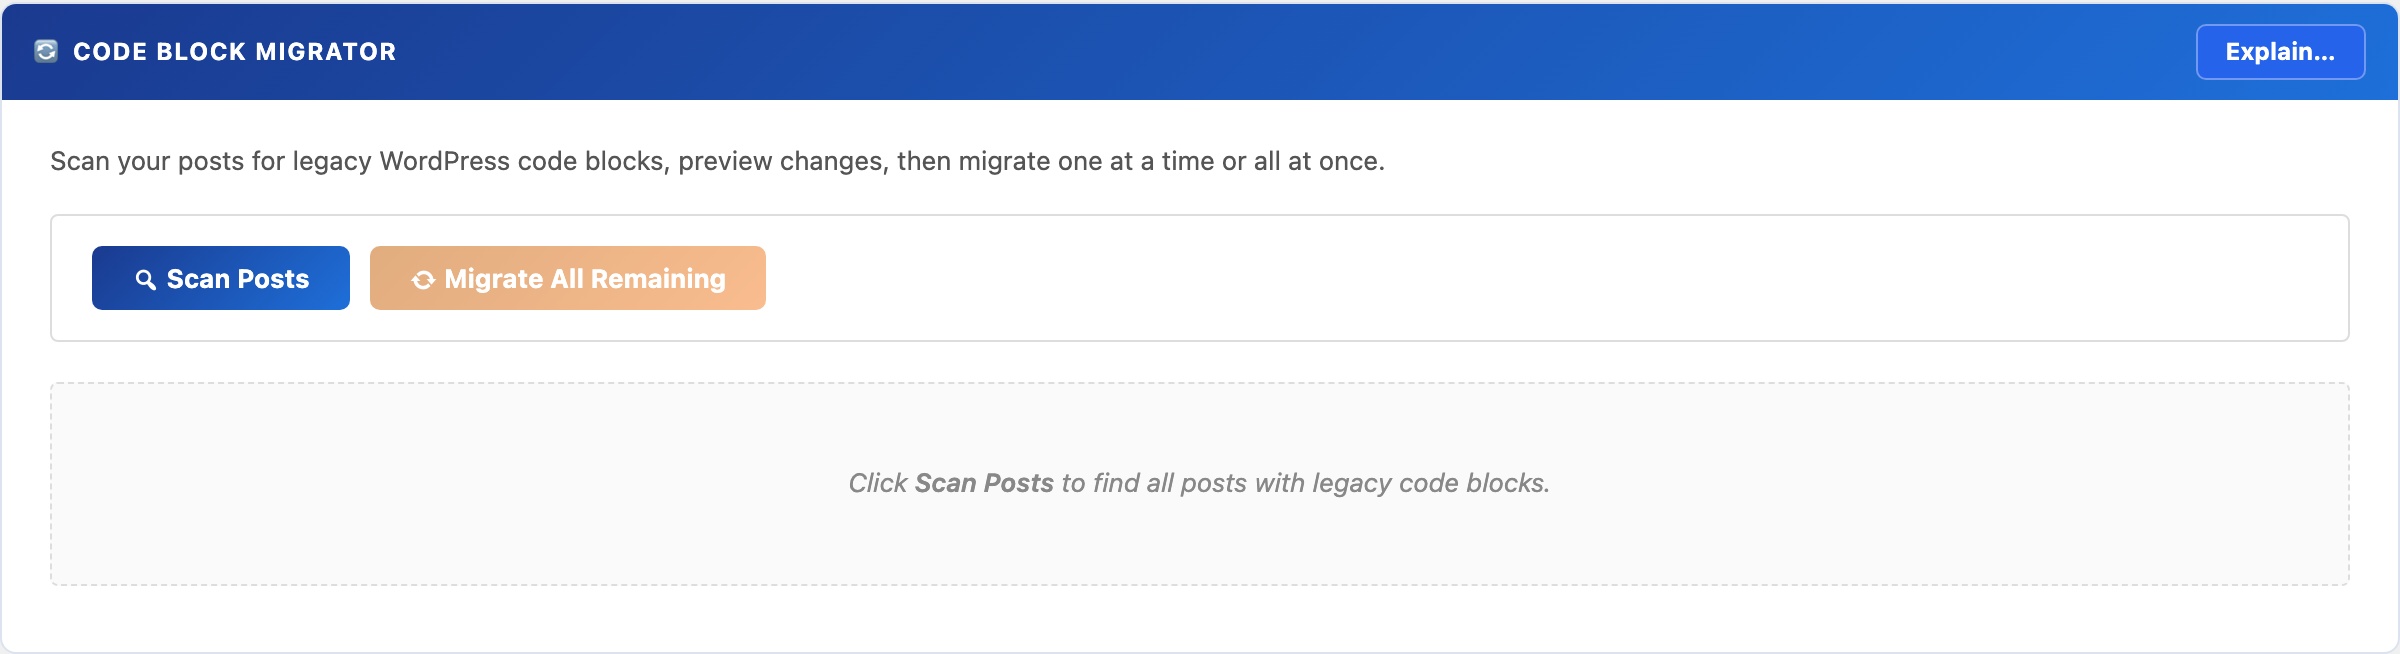
🔄 Switch Plugins Without Touching 100 Posts by Hand
Switching code highlighting plugins normally means opening every post, finding the old block or shortcode, deleting it, re-inserting the new one, and republishing, for every single post on your site. On a blog with 100 posts, that’s hours of tedious work with plenty of room for mistakes.
No other free WordPress plugin offers automated batch migration from multiple source formats with a preview step before committing. CloudScale does it in three clicks: Scan, Preview, Migrate All.
The Migrator scans your database for posts and pages using any supported legacy format, shows you a precise before/after diff, and converts them all to CloudScale blocks in a single operation.
Supported source formats:
- WordPress core
<!-- wp:code -->and<!-- wp:preformatted -->blocks - Code Syntax Block plugin (
<!-- wp:code-syntax-block/code -->) - Legacy shortcodes:
[code],[sourcecode], and common variants
Workflow:
- Scan: finds every post and page with supported blocks. Shows title, status, date, and block count.
- Preview: shows the exact before/after content diff per post. Nothing is written to the database at this stage.
- Migrate: convert one post at a time, or migrate everything in a single click.
⚠ The migrator writes directly to post_content. Always take a database backup first. Use the CloudScale Backup & Restore plugin for a one-click snapshot before you begin.
SQL Query Tool
A read-only SQL query interface inside wp-admin – inspect tables, check row counts, trace slow queries, and find database bloat without phpMyAdmin, SSH access, or exposing your database port. Architecturally impossible to delete or modify data.
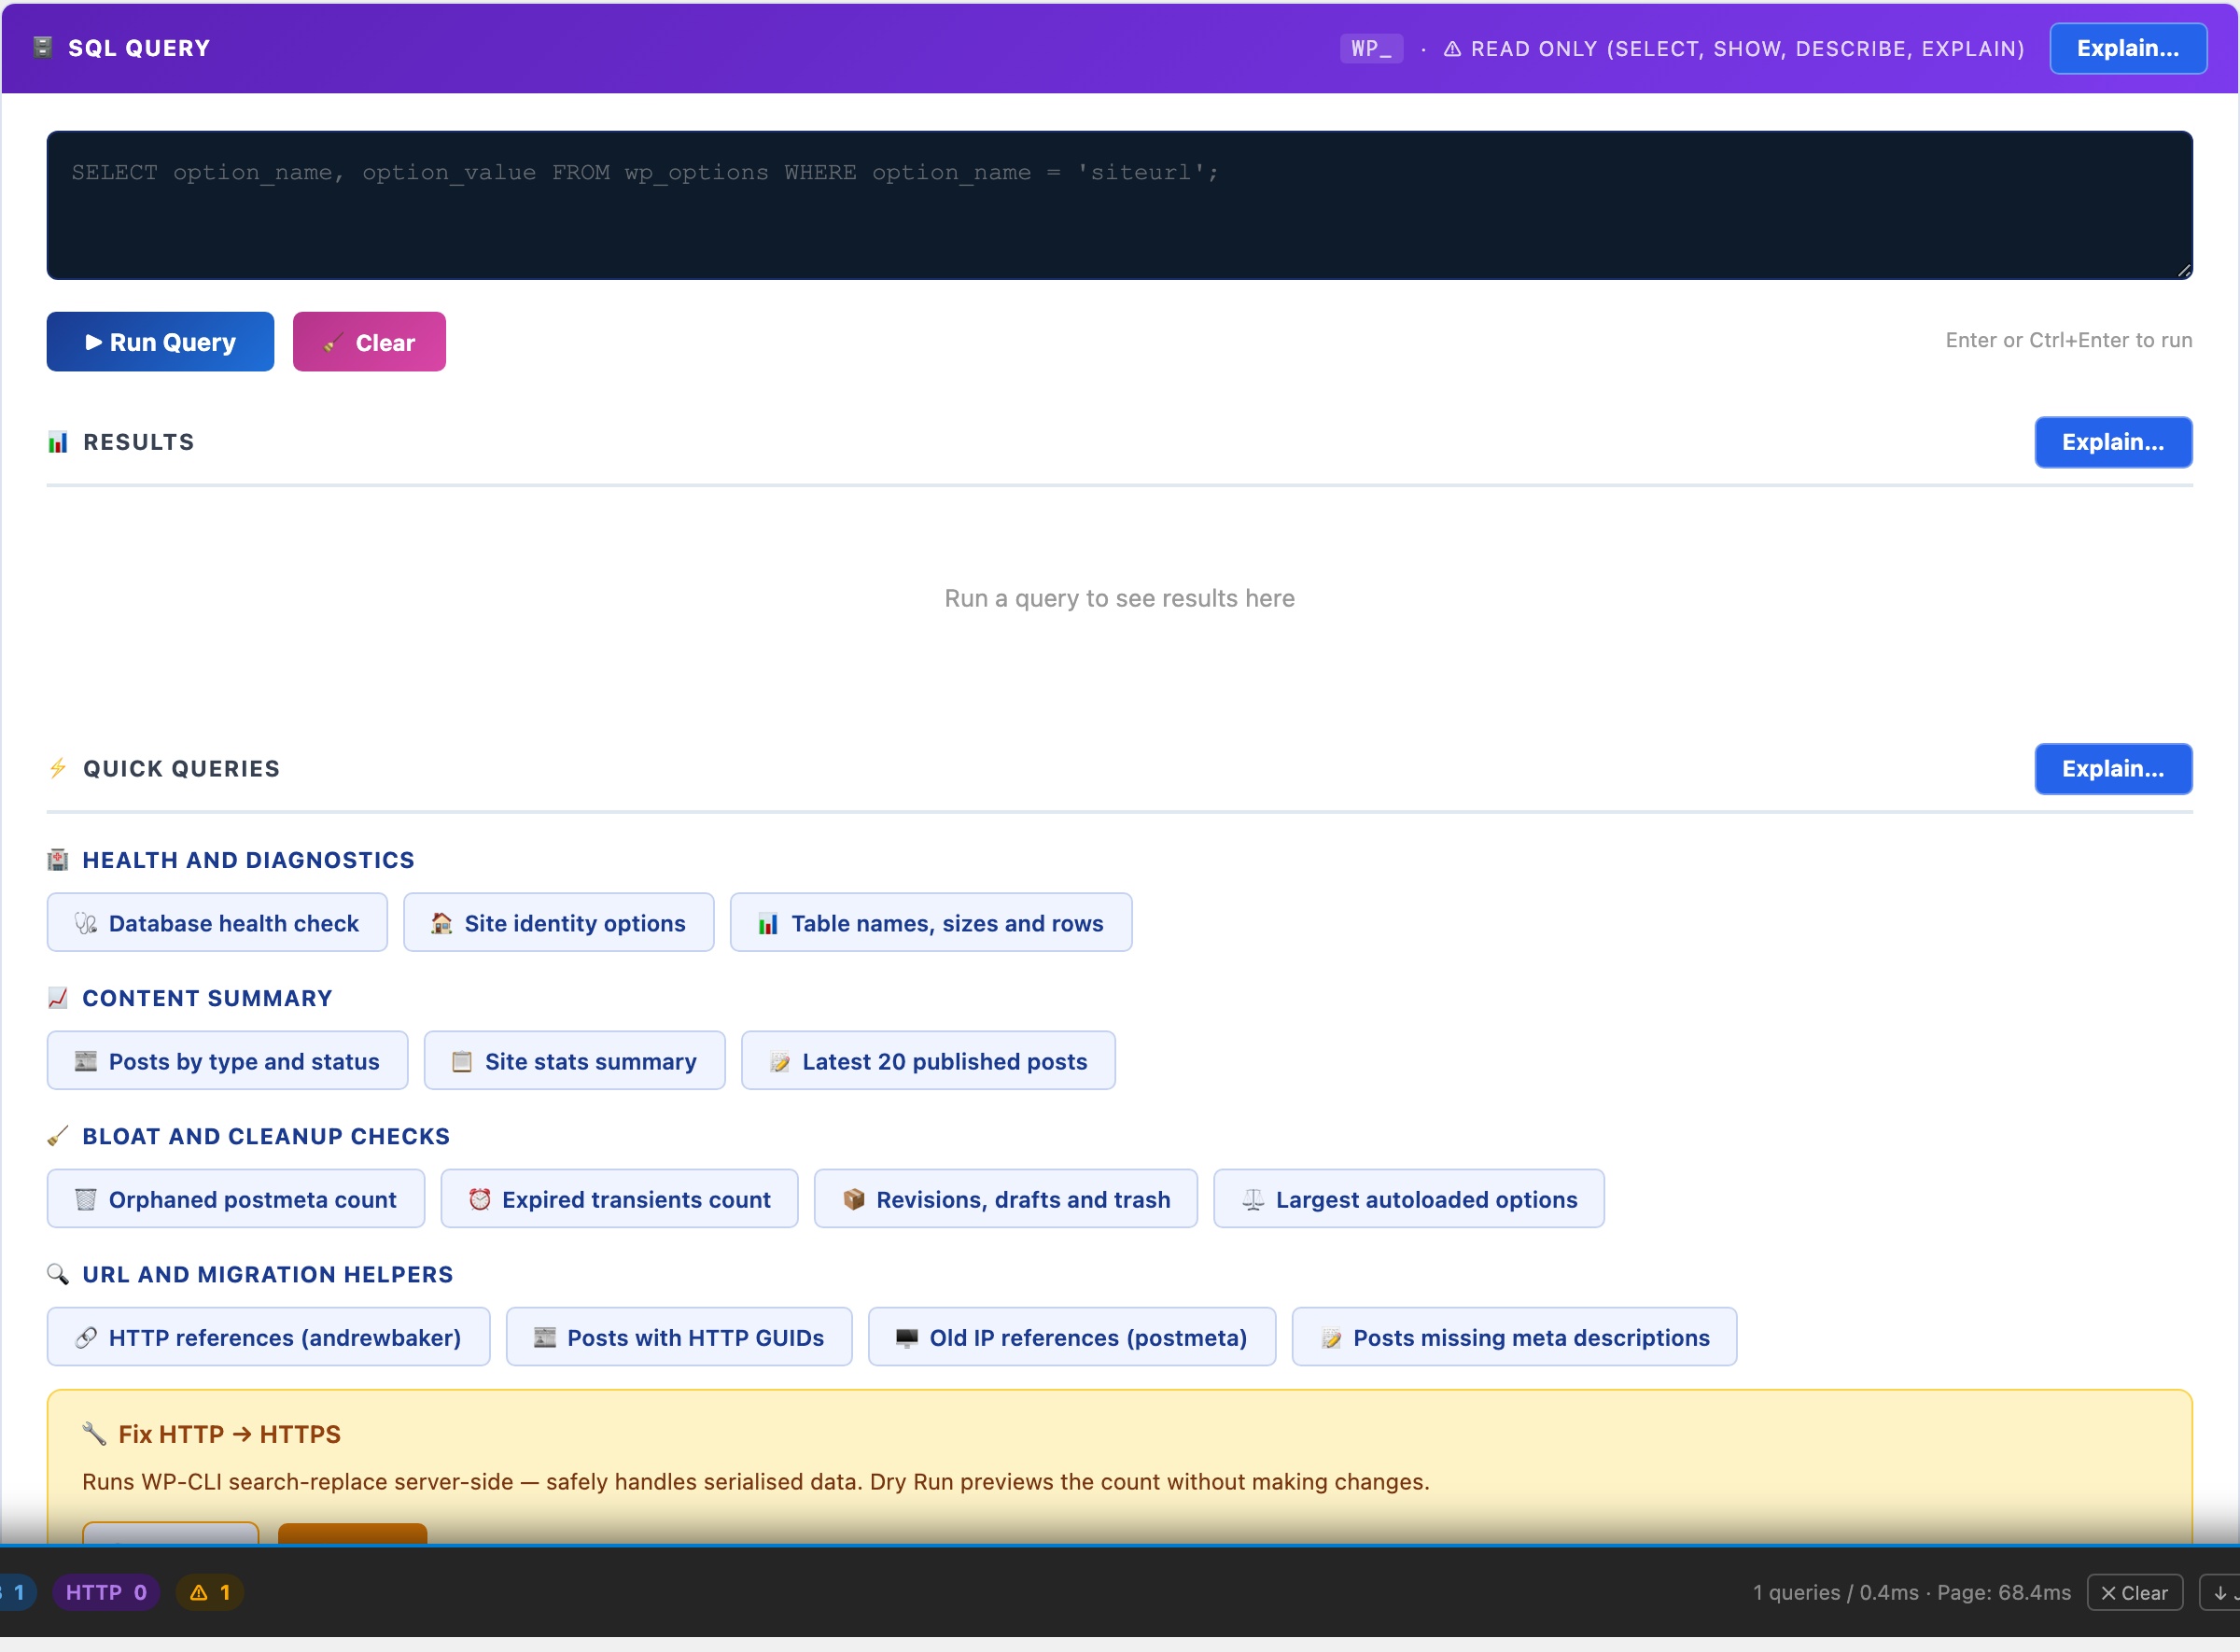
🗄️ Query Your Live Database Safely, Without phpMyAdmin or SSH
phpMyAdmin is powerful but complex to install securely, and leaving it exposed is a serious vulnerability. Adminer is a single PHP file that attackers actively scan for. Desktop tools like TablePlus require you to open a database port to your laptop. For WordPress administrators who just need to check table sizes, find orphaned data, or troubleshoot a slow query, those options are overkill or a security liability.
CloudScale’s SQL tool lives inside wp-admin, accessible only to administrators, and is read-only by design. It is architecturally impossible to delete or modify data through it. No separate installation, no open ports, no exposed files.
Read-only enforcement: Every query passes through is_safe_query() which strips comments, rejects semicolons (blocking statement stacking), blocks INTO OUTFILE and LOAD_FILE, and only permits SELECT, SHOW, DESCRIBE, EXPLAIN. Even if an administrator tries to run a destructive query, it is rejected before reaching the database.
14 built-in quick queries cover the most common diagnostic tasks without writing a single line of SQL:
- Health & Diagnostics: database status, site options, table sizes and row counts
- Content Summary: posts by type and status, latest published content
- Bloat & Cleanup: orphaned postmeta, expired transients, revisions, largest autoloaded options (the most common cause of slow WordPress admin)
- URL & Migration Helpers: HTTP references (for HTTP→HTTPS migrations), posts with old IP references, posts missing meta descriptions
Keyboard shortcuts: Enter or Ctrl+Enter runs the query. Shift+Enter inserts a newline for multi-line queries.
Server Logs
Browse your PHP error log, WordPress debug log, and web server logs directly in the dashboard – with live search, severity filtering, and auto-refresh tail mode. No SSH, no cPanel, no asking your hosting provider to email you a file.
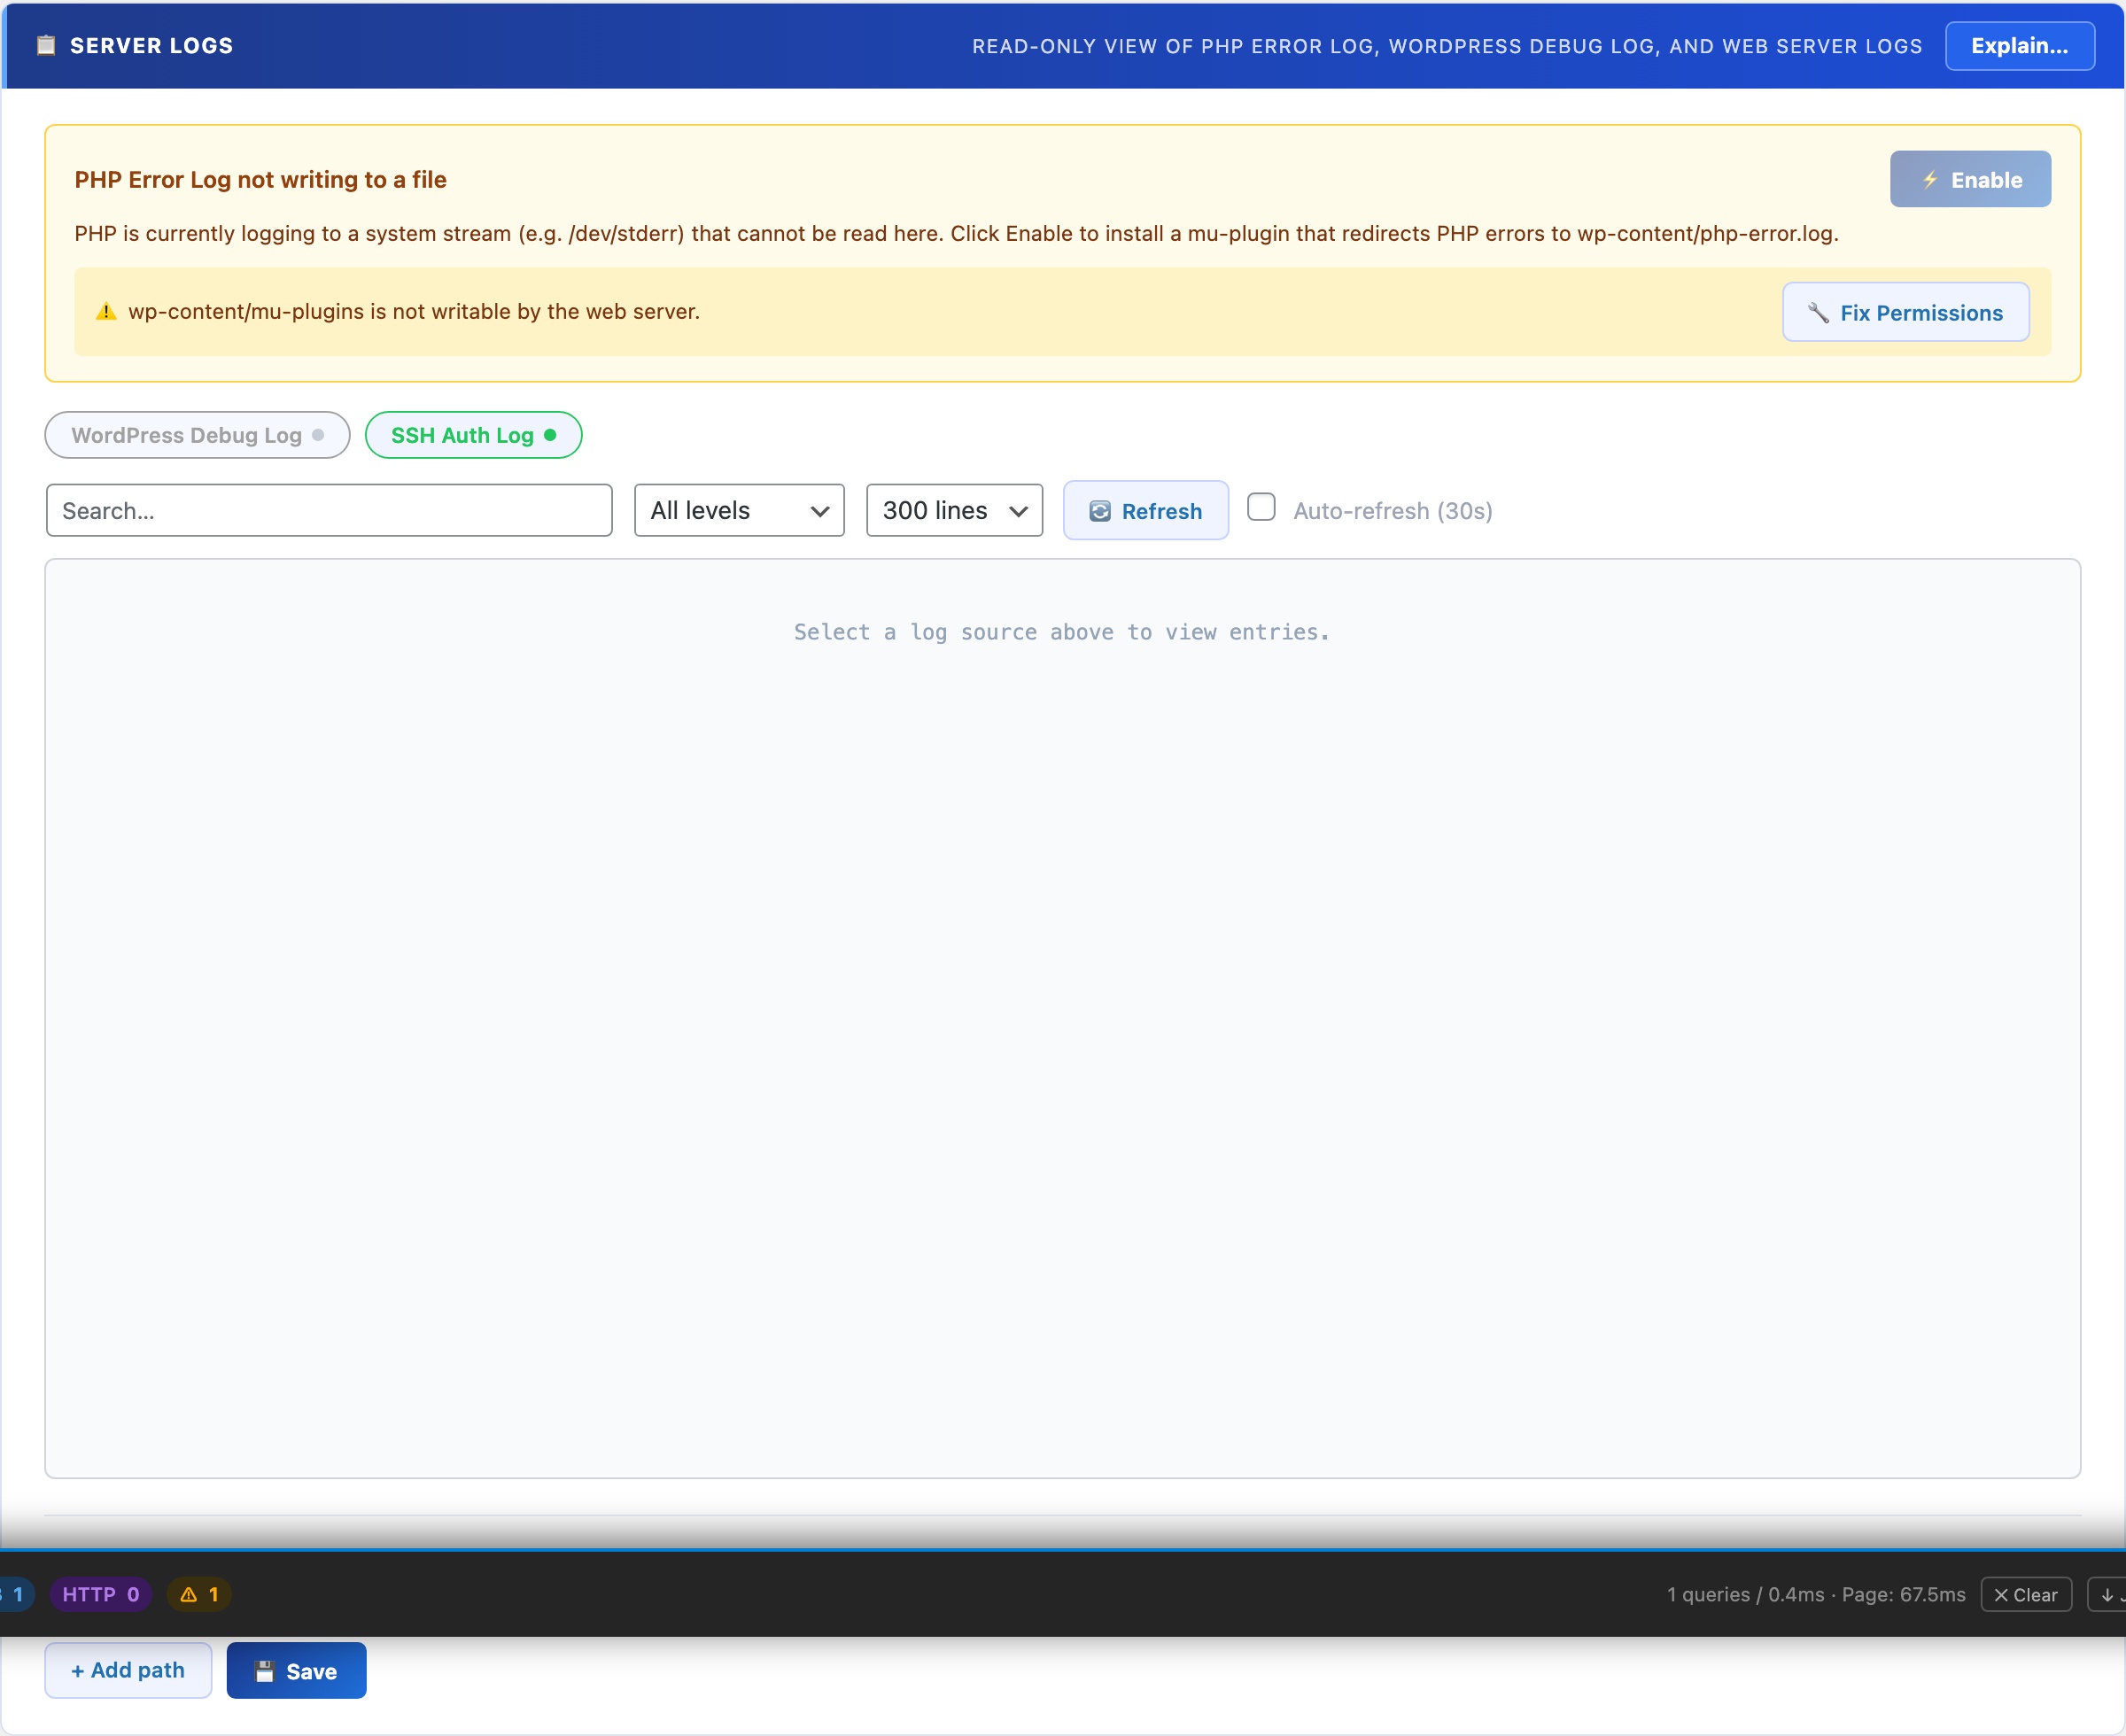
📋 Read Your Server Logs Without Leaving WordPress
When something breaks on a WordPress site, the answer is almost always in a log file. But accessing logs normally means SSH access (which many hosting plans don’t provide), navigating a cPanel file manager, or asking your hosting provider to email you a file. For agency developers, that means waiting. For site owners on shared hosting, that means never seeing the logs at all.
Query Monitor shows database queries and hooks but not server-level PHP or Nginx/Apache logs. Debug Bar only surfaces WP_DEBUG output. Neither replaces direct log access. CloudScale gives you the actual log files (PHP errors, WordPress debug output, and web server logs) in a clean, searchable interface inside wp-admin, with no SSH required.
All your log sources in one place: The source picker lists every available log file with a live status indicator (readable, not found, permission denied, or empty). Switch between PHP error log, WordPress debug log, and web server access/error logs with a single click.
Live search filters entries as you type with highlighted matches, which is essential for finding a specific error in a log with thousands of lines.
Severity filter narrows results to Emergency, Alert, Critical, Error, Warning, Notice, Info, or Debug. Cuts through noise on busy production sites where Info and Debug lines dominate.
Auto-refresh tail mode polls for new entries every 30 seconds. Reproduce a bug in one browser tab while watching the log update in real time in another. It’s the fastest way to trace an intermittent error.
Custom log paths: add any file path (Nginx error log, a custom application log, a cron output file). Paths persist across sessions.
One-click PHP error logging setup: if PHP error logging isn’t configured on the server, a button writes the required php.ini directives automatically. No server configuration knowledge required.
Server Logs as a Performance and Debugging Tool
The Server Logs panel is not just for security incidents. It’s the fastest way to trace a performance problem to its root cause without SSH access. Load a slow-performing page in one tab, watch the PHP error log update in tail mode in another, and see exactly which hook or database query is generating warnings on that specific page. Reproduce an intermittent 500 error and catch the exception the moment it fires. Find the exact plugin throwing deprecated notices that is degrading your PHP performance score.
For growth and marketing teams: the auth log source (where SSH brute-force attempts are recorded) gives you a real-time picture of attack traffic against your server – useful context for understanding infrastructure load and the value of the protection CloudScale provides.
Plugin Optimizer
Two tools in one tab: a plugin stack scanner that maps your installed plugins against everything CloudScale already replaces (so you know exactly which ones to remove), and an AI debugging assistant that diagnoses PHP errors, stack traces, and WordPress warnings instantly with step-by-step fix instructions.
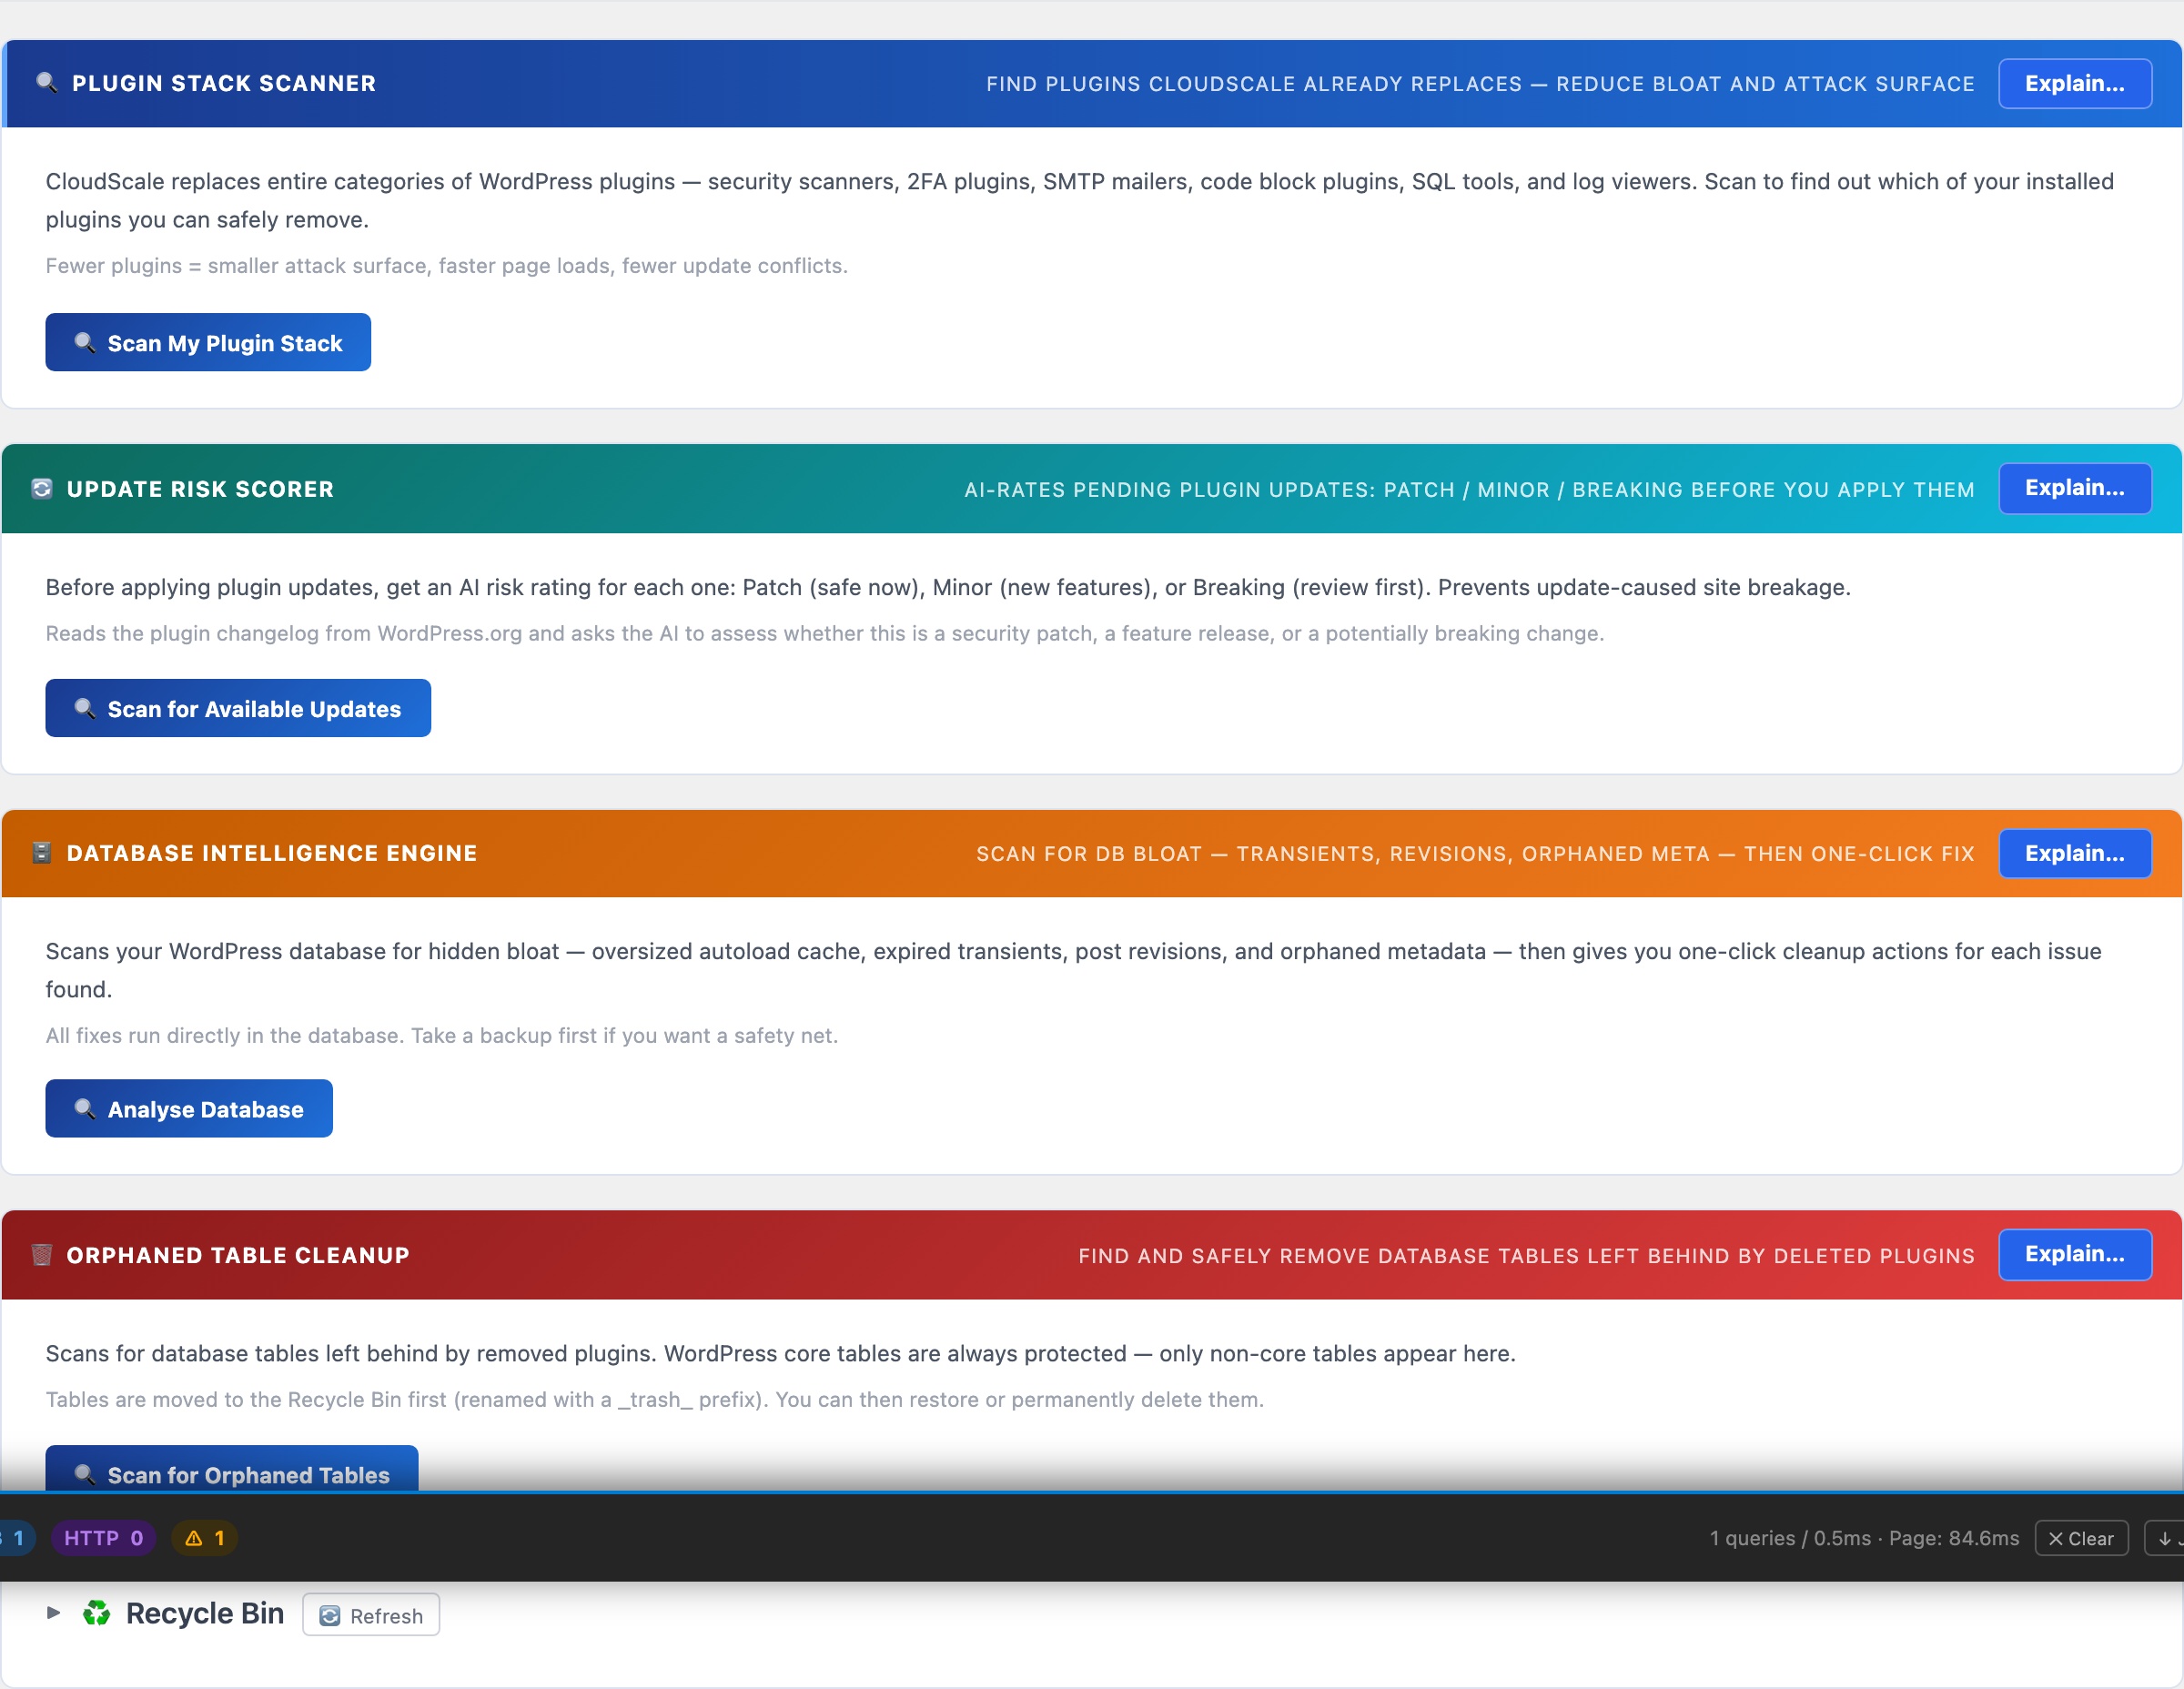
🔧 Reduce Your Plugin Stack. Fix Errors Faster.
The average WordPress site runs 17 active plugins. Each one adds HTTP requests, CSS, JavaScript, and potential conflict vectors to every page load. The Optimizer tab gives you two tools to fight back: a plugin scanner that finds redundancy, and an AI assistant that diagnoses errors instantly.
No other plugin does this. The Plugin Stack Scanner is the only tool that maps your installed plugins against a known replacement table and tells you which ones to remove – with direct links to the CloudScale features that replace them.
Most WordPress sites accumulate plugins the same way: one plugin gets installed to solve an immediate problem, then another, then another. Each one made sense in isolation. Together they form a stack of 15-20 plugins where nobody is sure which ones are still needed, several are doing overlapping jobs, and the combined page weight and PHP load is measurably slower than it needs to be. The Plugin Stack Scanner makes this visible: it shows you exactly which of your current plugins CloudScale already replaces, what the annual saving is for premium ones, and gives you a direct link to the CloudScale equivalent so you can verify it before deactivating anything.
The AI Debugging Assistant solves a different problem: PHP errors, stack traces, and WordPress warnings that require reading documentation, searching Stack Overflow, or posting in a forum and waiting. Paste the error, get a structured diagnosis with the root cause and numbered fix steps in under 10 seconds. The AI receives your WordPress and PHP version as context so the answer is specific to your environment rather than generic.
Plugin Stack Scanner
Click Scan My Plugin Stack. CloudScale reads your active and inactive plugin list and checks each against a database of 30+ categories it replaces: security scanners, 2FA plugins, SMTP mailers, code block plugins, SQL tools, log viewers, and social preview tools.
The results show:
- Plugin name and version: what you currently have installed and whether it is active or inactive
- CloudScale replacement: the specific feature within CloudScale that covers this plugin’s function, with the tab name so you can find it immediately
- Annual saving: the cost of the premium licence for paid plugins. Free plugins show a dash. This figure is useful for quantifying the value of consolidation when making the case to a client or a budget holder
- Go to tab link: a direct link to the CloudScale equivalent so you can set it up and verify it is working before deactivating the original plugin
Safe process for removing a plugin:
- Click the CloudScale tab link and configure the equivalent feature
- Test the CloudScale version works correctly on your site
- Take a full backup with CloudScale Backup and Restore
- Deactivate the original plugin
- Verify nothing broke, then delete the plugin entirely rather than leaving it deactivated (inactive plugins still present an attack surface)
AI Debugging Assistant
Paste any PHP error, WordPress warning, stack trace, deprecation notice, or plain-language problem description into the text area. Good inputs to try:
- A PHP fatal error from your server log (copy the full error including file and line number)
- A WordPress admin notice you don’t understand
- A plugin conflict description (“when I activate X, Y breaks”)
- A 500 server error message
- An unexplained behaviour (“checkout page goes blank after placing an order”)
Click Diagnose with AI. The AI returns a structured response with three sections:
- Root Cause: what is actually broken, in plain English – not the error message itself but what it means
- Why It Happens: the underlying mechanism so you understand the problem and can prevent it recurring, not just fix it blindly this time
- How to Fix It: numbered steps specific to the error you provided, tailored to your WordPress and PHP version
The AI receives your WordPress version, PHP version, and active plugin list as context with every query. This means it can identify that an error is caused by a known incompatibility between two specific plugins you have installed, rather than giving a generic answer that applies to every WordPress site.
Using the AI Debugging Assistant with the CS Monitor
The CS Monitor panel (visible on every admin page for logged-in administrators) has a clipboard copy button on every tab. If you see a PHP error in the CS Monitor’s Logs tab, click Copy to get the full error text, then paste it directly into the Debugging Assistant. The two tools are designed to work together: CS Monitor catches the error in real time, the Debugging Assistant explains it and tells you how to fix it.
Requires an AI API key. Add one on the Security tab under AI Settings. Google Gemini’s free tier works perfectly for debugging queries – a single debugging session uses a fraction of the free daily quota.
Plugin Stack Scanner
Scans your installed plugins against a curated list of functionality that CloudScale already provides – security scanners, 2FA plugins, SMTP mailers, code highlighting, SQL tools, and log viewers. Shows exactly which plugins are now redundant and safe to remove, reducing your attack surface and update burden.
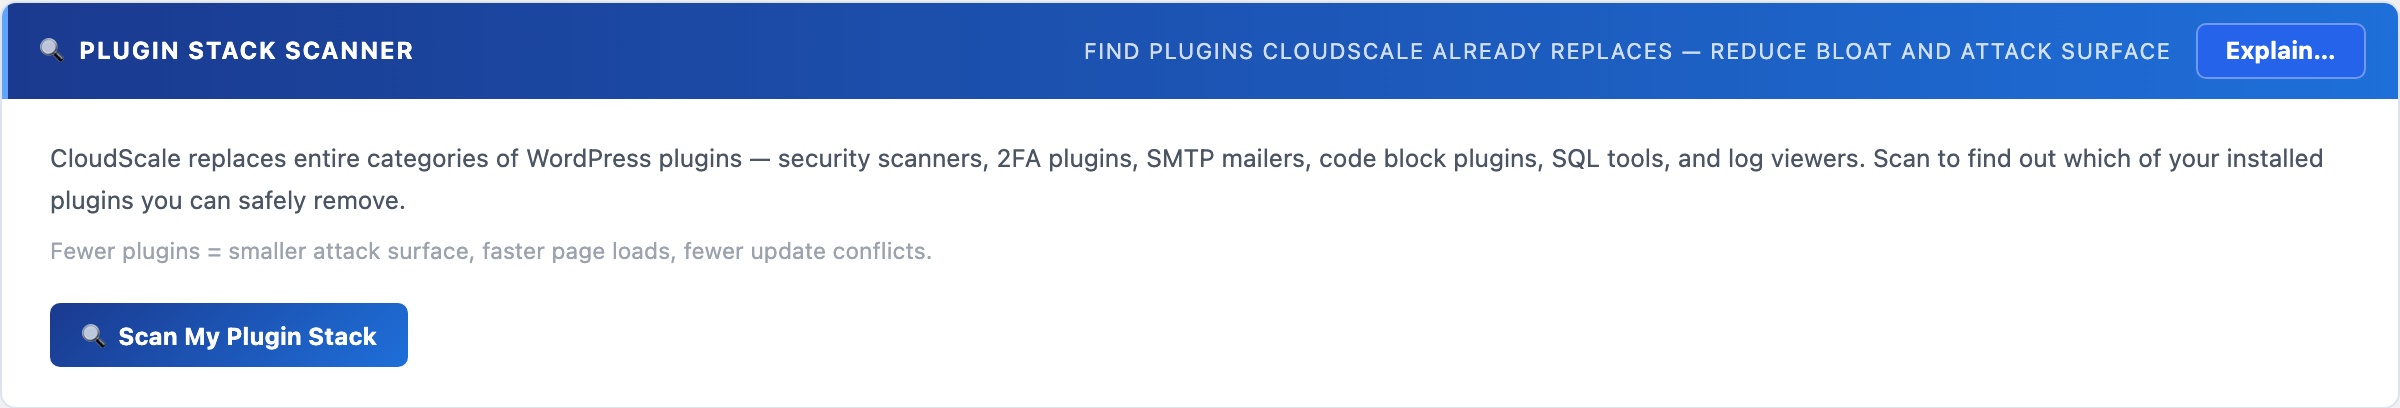
🔍 Fewer Plugins = Smaller Attack Surface
Every plugin you run is a piece of code you trust to not get hacked, not conflict with anything, and not slow your site down. CloudScale already replaces entire categories of plugins. The Plugin Stack Scanner tells you exactly which of your current plugins are now redundant.
Click Scan My Plugin Stack to compare your active and inactive plugins against CloudScale’s replacement list. The scan checks for plugins in these categories:
- Security scanners – Wordfence, iThemes Security, All In One WP Security
- 2FA plugins – WP 2FA, Google Authenticator, Duo Security
- SMTP mailers – WP Mail SMTP, Easy WP SMTP, FluentSMTP
- Code highlighting – SyntaxHighlighter, Enlighter, Prismatic
- SQL tools – Adminer, WP phpMyAdmin
- Log viewers – Error Log Monitor, WP Log Viewer
Each flagged plugin shows why it’s redundant and which CloudScale feature replaces it. Inactive plugins are flagged with an extra warning: inactive plugins still load autoloaded code on every page request and are still scanned for vulnerabilities – deactivate and delete, don’t just deactivate.
Update Risk Scorer
Uses AI to read each pending plugin update’s changelog from WordPress.org and classify it as Patch (safe to apply now), Minor (new features, review first), or Breaking (major changes, test on staging). Prevents the most common cause of site breakage: blindly applying all updates at once.
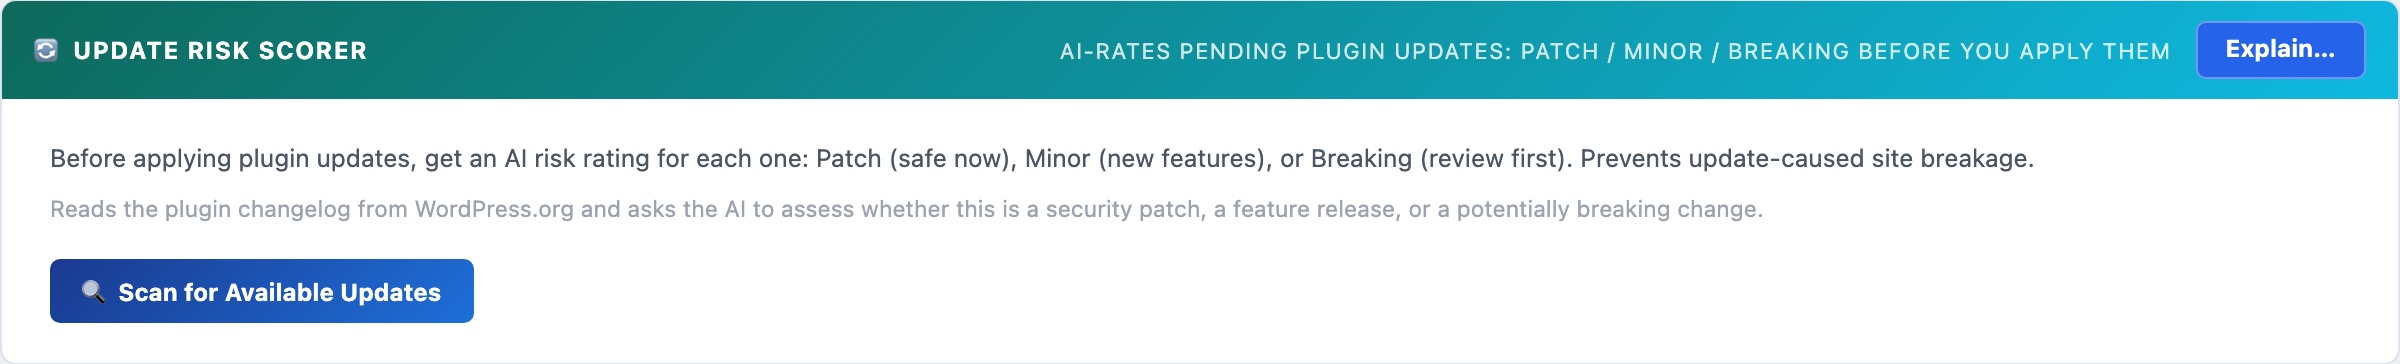
🔄 Know What You’re Applying Before You Apply It
Blindly applying all pending plugin updates is the most common cause of WordPress site breakage. A “minor” version bump can contain breaking API changes. A patch release can contain schema migrations. The Update Risk Scorer reads the changelog and tells you which updates are safe to apply right now and which need staging first.
Click Scan for Available Updates to fetch the list of plugins with pending updates from WordPress. For each one, the scorer reads the changelog from WordPress.org and sends it to the configured AI provider for risk assessment.
Risk Rating Meanings
- 🟢 Patch – security fix or bug fix with no API changes. Safe to apply immediately on your live site.
- 🟡 Minor – new features added. Low risk but review the changelog for anything that affects your configuration. Apply during off-peak hours.
- 🔴 Breaking – major version bump or significant API change. Test on a staging site before applying to production. The AI will describe what specifically changed and what to check.
Requires an AI API key configured on the Home tab. Uses your configured provider (Claude or Gemini) to read and assess each changelog. The assessment runs locally on your server – no update decisions are sent to or logged by CloudScale.
Uptime Monitor
Deploys a Cloudflare Worker that probes a deep readiness endpoint every 60 seconds from the Cloudflare edge. Unlike basic uptime monitors that only check for a 200 response, this endpoint verifies database connectivity, PHP-FPM worker saturation, and WordPress boot. Alerts fire via push notification even if your server is completely offline.
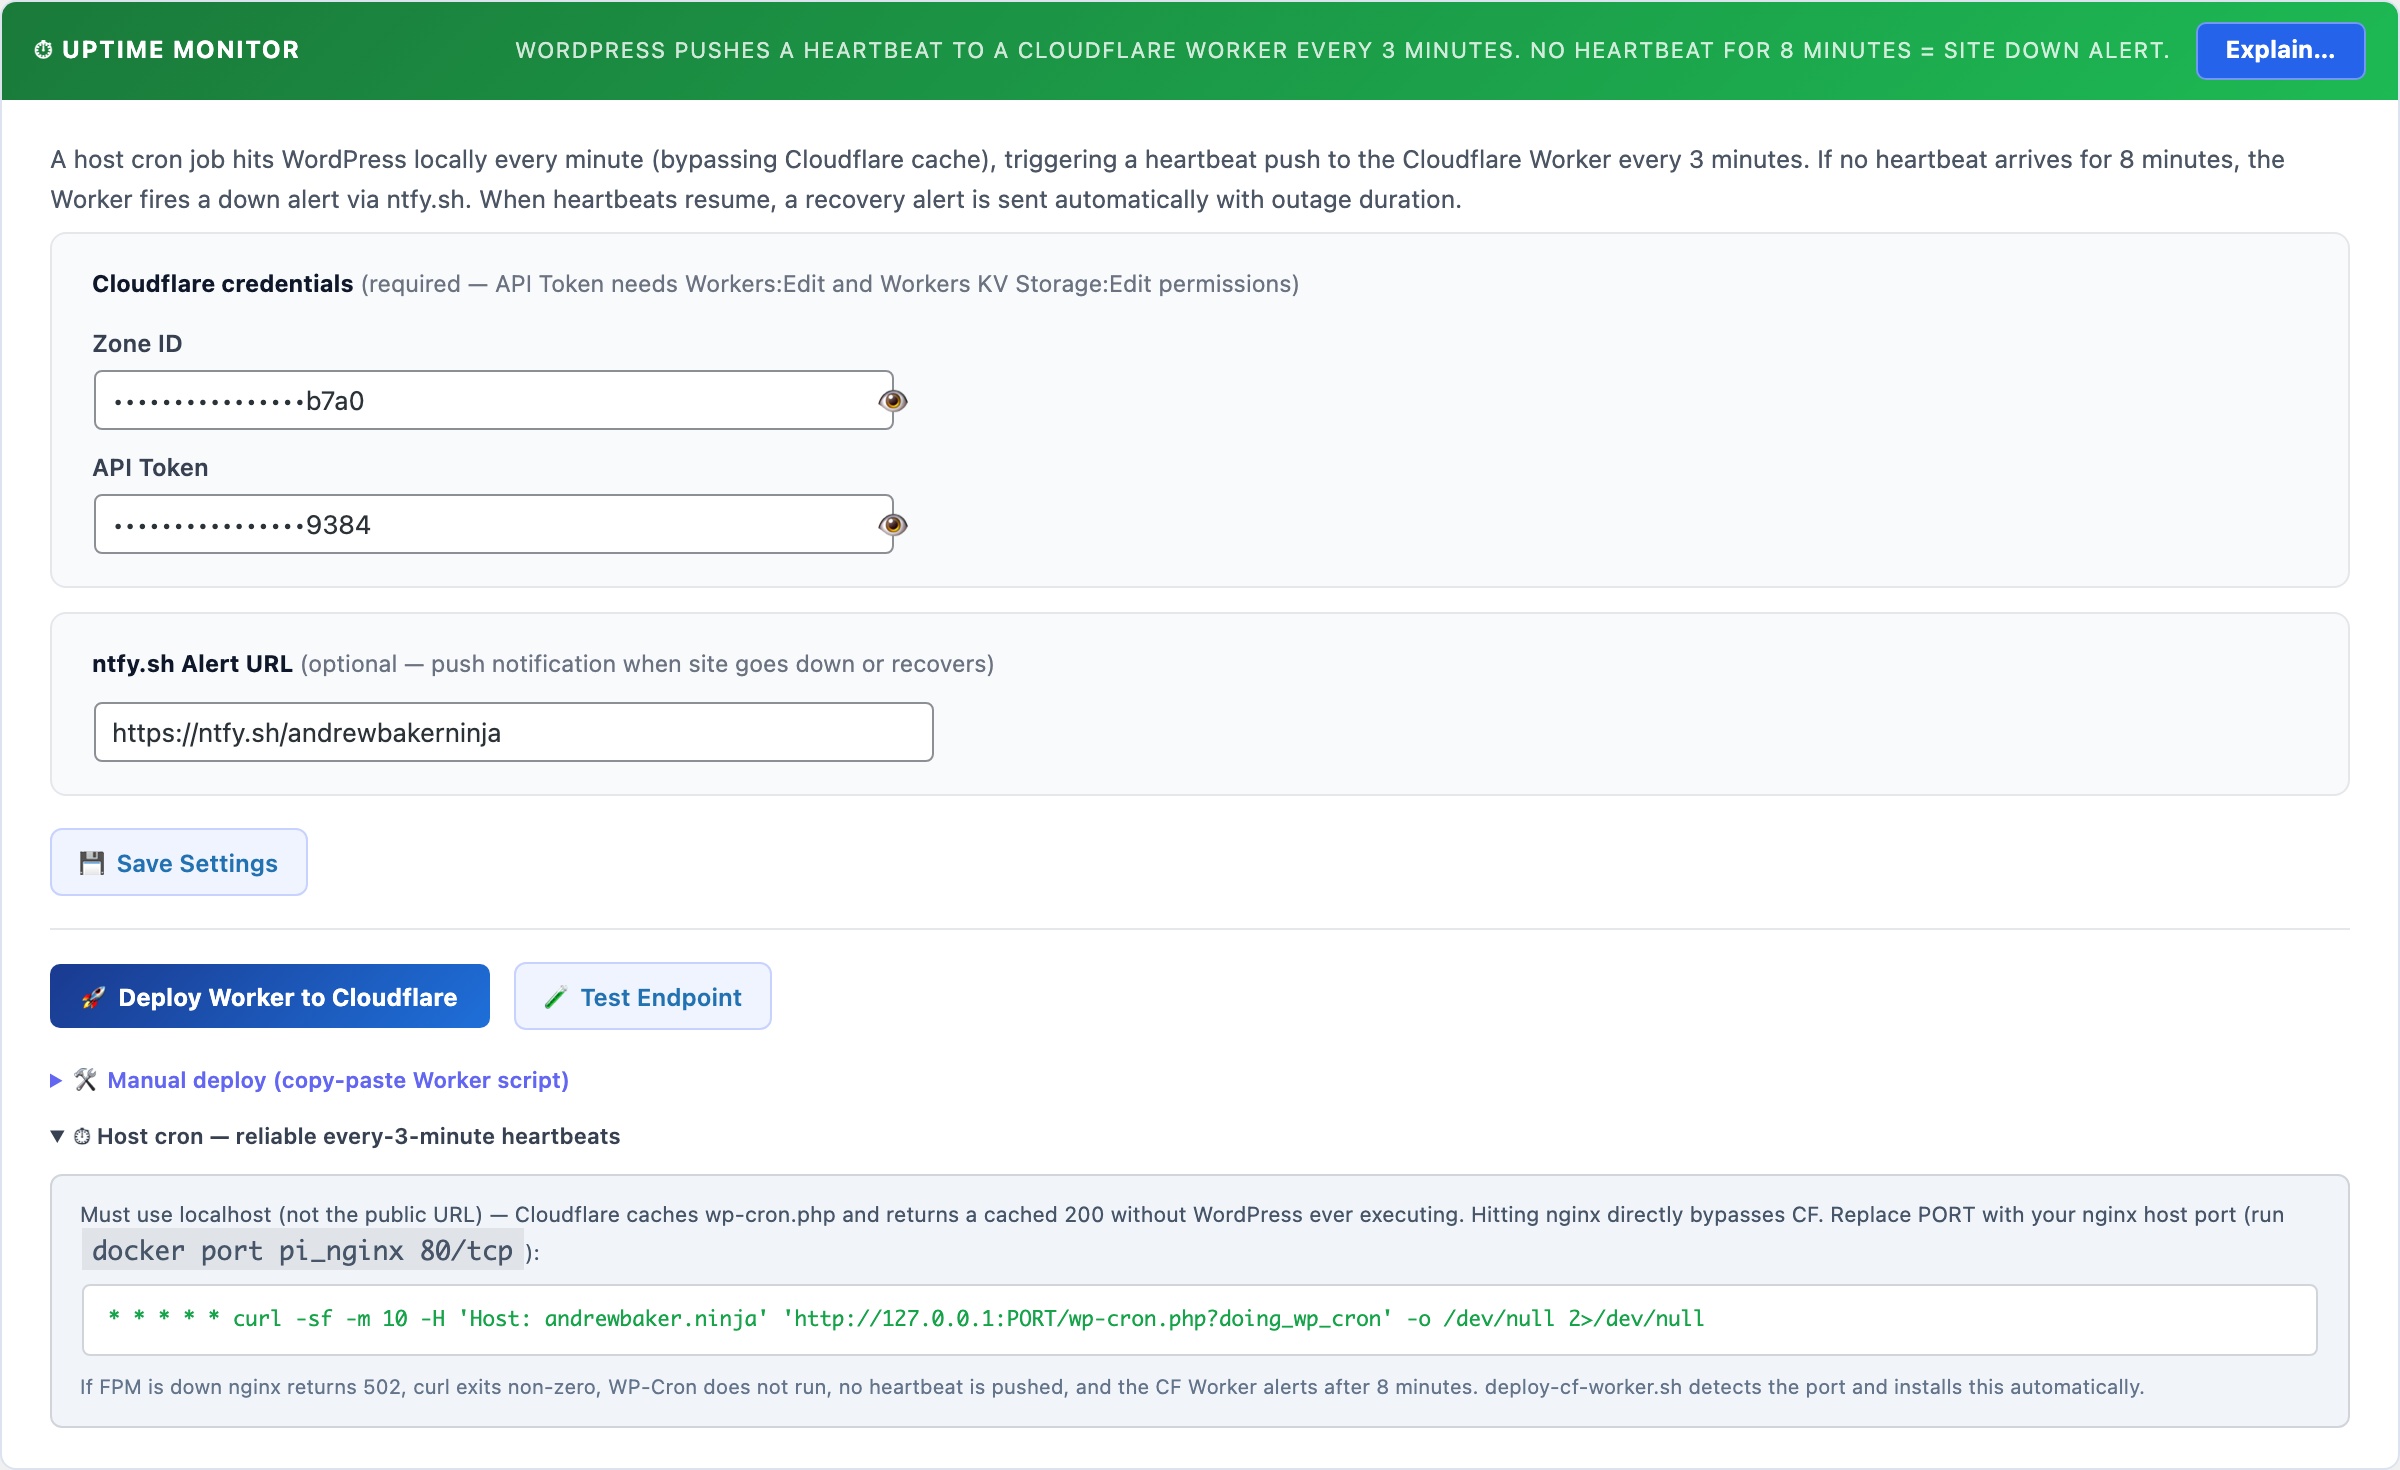
⏱ Deep Uptime Monitoring – From the Cloudflare Edge
Traditional uptime monitors check whether your site returns a 200 status code. That tells you nothing about whether WordPress is actually healthy – your site can return 200 while the database is failing, PHP-FPM workers are exhausted, or the application is silently broken.
The CloudScale Uptime Monitor probes a built-in readiness endpoint every 60 seconds from the Cloudflare edge. Each probe checks: database connectivity, PHP-FPM saturation, and WordPress boot. If any check fails, you get an alert immediately – even if your server is completely offline.
How It Works
- A Cloudflare Worker runs on a 60-second cron from the Cloudflare edge – completely independent of your server, your hosting provider, and WP-Cron.
- Every minute, the Worker sends a
GETrequest to your site’s readiness endpoint (/wp-json/csdt/v1/ready) with a secret Bearer token in the Authorization header. - The readiness endpoint runs three checks internally and returns
HTTP 200if all pass orHTTP 503if any fail. - The Worker posts the result back to your WordPress site, recording it in the uptime history and triggering alerts if the site is down.
- The uptime panel shows Last Queried (last time Cloudflare successfully called your endpoint) and Last Failed Query (last time someone called with an invalid token) so you can see at a glance that the Worker is running and no unauthorised probing is happening.
The Readiness Endpoint
The readiness endpoint is a public REST API route at /wp-json/csdt/v1/ready. It requires a Bearer token – requests without a valid token return 401 Unauthorized and the timestamp is logged as “Last Failed Query”.
Checks performed on each probe:
- Database – executes
SELECT 1against your WordPress database. Fails if the DB is unreachable or returning errors. - PHP-FPM saturation – reads the
/fpm-statuspage (if configured) and fails if active workers exceed 90% of total pool size. This catches the scenario where your site is technically reachable but is about to freeze under load. - WordPress boot – implicit: if the endpoint responds at all, WordPress initialised successfully.
Response format (200 – healthy):
{
  "ok": true,
  "checks": {
    "db":  { "ok": true, "message": "Connected" },
    "fpm": { "ok": true, "active": 2, "total": 10, "saturation_pct": 20 },
    "wp":  { "ok": true, "version": "6.8" }
  },
  "site": "https://yoursite.com",
  "checked_at": 1745000000
}
Response format (503 – degraded):
{
  "ok": false,
  "checks": {
    "db":  { "ok": false, "message": "Query failed" },
    "fpm": { "ok": false, "active": 10, "total": 10, "saturation_pct": 100 },
    "wp":  { "ok": true, "version": "6.8" }
  },
  "site": "https://yoursite.com",
  "checked_at": 1745000000
}
You can call this endpoint manually at any time (with the token) to check your site’s health.
One-Click Setup
Prerequisites: a Cloudflare account with your site’s domain proxied through Cloudflare. Enter your Cloudflare Zone ID and API Token in the Thumbnails tab – the token needs Workers:Edit permission.
- Go to Tools → Cyber and Devtools → Optimizer tab.
- Scroll to the Uptime Monitor section.
- Optionally enter an ntfy.sh alert URL (e.g.
https://ntfy.sh/your-topic) to receive push notifications on your phone when the site goes down. This is the same ntfy URL used by the scheduled security scan. - Click Deploy Worker to Cloudflare. The plugin will:
- Generate a secure random token (or reuse an existing one)
- Resolve your Cloudflare account ID from your Zone ID
- Upload the Worker script with all environment variables pre-configured (SITE_URL, PING_URL, READY_URL, PING_TOKEN, NTFY_URL)
- Set the cron trigger to run every minute
- Within 60 seconds, the Last Queried timestamp in the status panel will update, confirming the Worker is running and probing your endpoint.
That’s it. No command line required.
Manual Setup (CLI)
If you prefer Wrangler, click Generate Token first, then expand Manual deploy. You’ll get a worker.js file and a pre-filled wrangler.toml with all variables set. Run:
npm install -g wrangler
wrangler login
wrangler deploy
Then set the cron trigger in the Cloudflare dashboard: Workers → cloudscale-uptime → Triggers → Cron Triggers → Add Cron → * * * * *
Alerts and Notifications
- ntfy.sh push – sent directly from the Cloudflare Worker when the readiness probe fails. This fires even if your server is completely offline, because the Worker runs on Cloudflare’s infrastructure independently.
- Email alert – sent from WordPress when the ping callback receives a down status. Falls back to the WordPress admin email if no specific alert email is configured.
- Recovery alert – sent when the site comes back up after a confirmed outage, including how long the site was down.
- 5-minute alert cooldown – prevents notification spam during extended outages.
Security
The readiness endpoint is public (accessible without a WordPress login) but protected by a Bearer token. All token comparisons use hash_equals() to prevent timing attacks. Requests with a missing or incorrect token return 401 and log the time of the attempt as Last Failed Query – visible in the uptime panel. If you see unexpected failed queries, regenerate your token using the Generate Token button and re-deploy the Worker.
The endpoint does not expose sensitive data – it only returns health check pass/fail status and version numbers.
CS Monitor
A floating DevTools-style performance panel that appears on every WordPress admin screen and frontend page for logged-in administrators. Surfaces database queries, HTTP calls, hook timings, PHP errors, assets, and template resolution in one overlay – without switching tools or tailing log files.

⚡ A DevTools-Style Performance Panel, Built Into Every WordPress Page
Query Monitor shows database queries. Debug Bar surfaces WP_DEBUG output. Neither one shows you everything happening on a single page request – HTTP calls, hook timings, PHP errors, asset inventory, transients, and template resolution – in one panel without switching tools or reading raw logs. CS Monitor does.
It appears automatically for logged-in administrators on every wp-admin screen and every frontend page. No configuration required. Toggle it off under Code Settings → Show the CS Monitor performance panel if you need a clean view.
Performance problems on WordPress sites typically involve one of a small number of root causes: too many database queries (especially N+1 query patterns from plugins iterating through posts), slow external HTTP calls blocking page generation, PHP errors generating notices that get logged and cause overhead, or an asset-heavy theme loading scripts on every page whether they are needed or not. The difficulty is that none of these are visible from the outside – your site’s pages load slowly and you cannot tell from the browser why. CS Monitor captures all of these simultaneously for every page request and surfaces them in a single overlay so you can pinpoint the cause without SSH access, log file analysis, or installing additional profiling tools.
CS Monitor only activates for logged-in administrators. Regular visitors see no difference and incur no overhead. This means you can leave it enabled on live production sites without any impact on visitor experience or page load times. It is always-on for you, invisible to everyone else.
Panel Tabs
- Issues: auto-detected problems ranked by severity – N+1 query loops, slow queries over 100ms, high total query count, OPcache not enabled, missing database indexes on common lookup columns, and high memory usage. Each issue links directly to the relevant tab for investigation. Start here to see if there is anything worth investigating before browsing the raw data.
- DB Queries: every database query executed during this request, with execution time in milliseconds, the calling plugin or theme, and the PHP call stack. Click any SELECT query to run
EXPLAINinline and see the query execution plan – instantly shows whether a full table scan is occurring. N+1 query patterns (the same query fired repeatedly in a loop) are grouped and flagged automatically, making them easy to spot even if no individual query is slow. - HTTP / REST: all outbound HTTP calls made via
wp_remote_get,wp_remote_post, and internal REST API requests, with the full URL and response time. Slow external API calls (payment gateways, social embed fetches, external font requests) that block PHP page generation are immediately visible here. If your pages feel fast in the browser but slow to generate server-side, this tab often shows the culprit. - Logs: PHP notices, warnings, deprecation notices, and errors captured for the current request, with the originating file and line number. No need to tail a log file or wait for a scheduled scan. If a plugin is generating deprecation warnings on every page load, you will see exactly which plugin and which line is responsible.
- Assets: every script and stylesheet registered and enqueued for the current page, with its source plugin or theme. Use this to identify asset bloat – plugins loading their full CSS and JS on pages where they have no UI, themes loading icon fonts for icons that don’t appear on the current template.
- Hooks: all WordPress action and filter hooks that fired during the request, with execution time per hook. A hook taking 200ms on every page request is a performance problem regardless of how fast the database queries are. Find the slow hooks and trace them back to the plugin responsible.
- Request: current request details including HTTP method, full URL, the matched WordPress rewrite rule, active query variables, and key WordPress globals. Useful for debugging routing problems, custom post type URL issues, and template selection.
- Template: the full chain of template files WordPress evaluated to serve the current page, in the order they were loaded. Use this to understand which theme file is generating the current page and trace layout problems back to the right file without guessing.
- Transients: every transient read, write, and delete operation triggered during the request, with the transient name and expiry. Shows which plugins are caching data and whether caches are hitting or missing.
- Browser: JavaScript console errors and unhandled promise rejections captured client-side and reported back to the panel via a small inline script. Catch JS exceptions and React hydration errors without opening browser DevTools. Useful on pages where you cannot easily open DevTools (mobile admin, certain embedded views).
- Summary: the request totals at a glance – total query count, combined query execution time, hook count, HTTP call count, peak memory usage, and total wall-clock page generation time. Use this for before/after comparison when profiling plugin changes.
Copy and Export
Every tab has a Copy button that puts the current tab’s data on your clipboard as plain text, ready to paste into a bug report, a support ticket, or the AI Debugging Assistant. A full-panel JSON export is available from the Summary tab for sharing complete request profiles with developers or hosting support.
Performance Impact
CS Monitor adds a small overhead from hooking into SAVEQUERIES and the WordPress shutdown action to collect data. This overhead is only incurred for logged-in administrators – regular visitors are completely unaffected. The panel can be disabled globally under Tools → Cyber and Devtools → Code Settings → Show the CS Monitor performance panel, or closed on a per-page basis using its close button.
FPM Monitor
PHP-FPM (FastCGI Process Manager) is the process pool that serves every WordPress page request. When all workers are occupied – during a traffic spike, a slow database query, or a runaway loop – new requests queue and the site freezes. The FPM Monitor shows live worker counts and memory usage, and alerts you the moment saturation builds – running as a host-level script outside PHP so it fires even when every PHP worker is consumed.
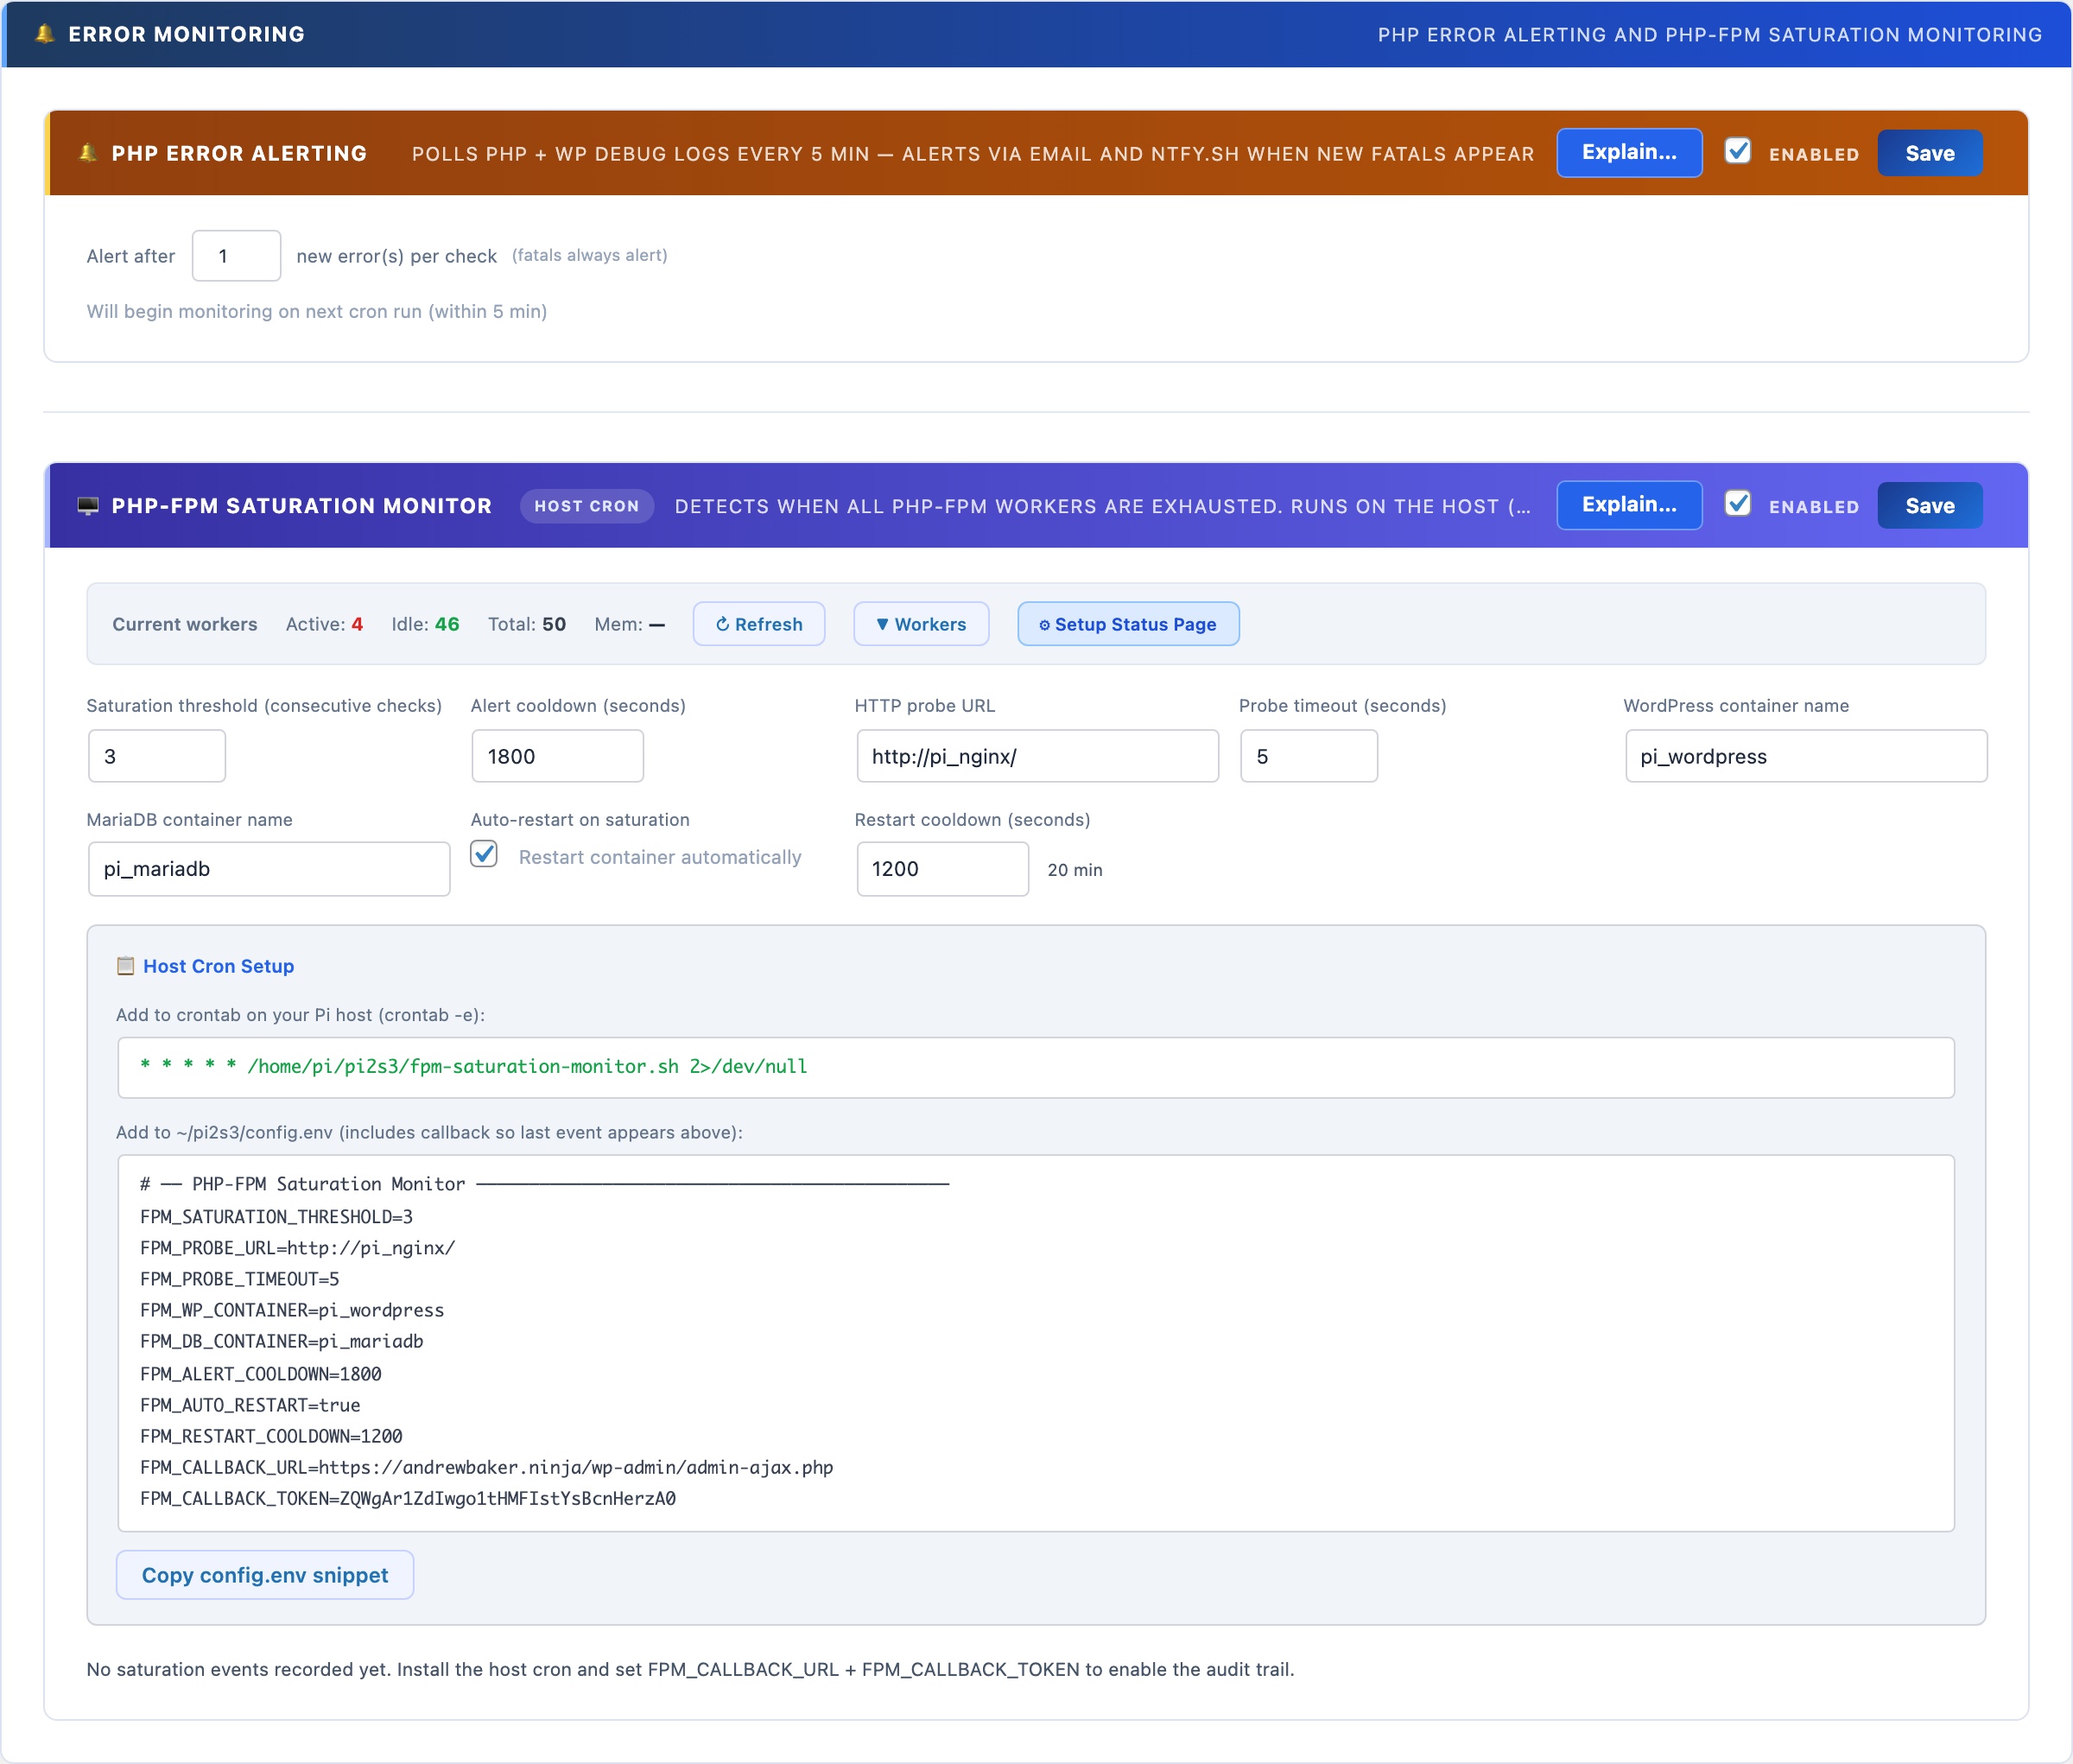
🖥️ Know When Your PHP Workers Are Exhausted – Before Your Site Goes Down
PHP-FPM (FastCGI Process Manager) maintains a fixed pool of worker processes. When all workers are busy – during a traffic spike, a slow query holding workers open, or a runaway loop – new requests queue and the site freezes. WP-Cron can’t alert you when this happens because WP-Cron itself runs inside PHP-FPM. The FPM Monitor runs as a shell script on the host OS, outside Docker, so it fires even when every PHP worker is consumed.
No other WordPress plugin does this. External uptime monitors just tell you the site is down after it’s already down. The FPM Monitor tells you saturation is building while you can still act – and can restart the container automatically.
Live Worker Status
The worker bar at the top of the FPM Monitor section shows real-time counts polled from your PHP-FPM status page:
- Active – workers currently processing a request (shown in red when high)
- Idle – workers ready to accept a new request (shown in green)
- Total – pool size: active + idle + any in graceful-finish state
- Mem – total memory consumed across all workers combined
Click ▼ Workers to expand a per-worker table showing PID, state, request count, running time, last URI, last script, last CPU%, and memory per worker. Running workers show — for CPU% because their current request hasn’t completed yet. Click ↻ Refresh to re-poll at any time.
Enabling the Status Page
Worker data requires pm.status_path = /fpm-status in your PHP-FPM pool config (www.conf) and a matching Nginx location block. Click ⚙ Setup Status Page and the wizard will detect whether your setup is already configured, show you the exact config changes needed, and offer to apply them automatically.
Saturation Detection and Alerts
The monitor runs as a host-level cron job (not WP-Cron) that probes your site’s HTTP URL every minute. If the probe times out or fails N consecutive times (the saturation threshold), saturation is declared. On saturation it:
- Sends an ntfy.sh push notification to your phone instantly
- Sends an email alert to the WordPress admin address
- Optionally restarts the WordPress Docker container (with a configurable restart cooldown to prevent thrashing)
- POSTs an event back to this panel via the callback URL, logging the incident in the event log
Setup
Configure the settings in the panel, then copy the crontab line and config.env snippet from the Host Cron Setup section. The config includes the callback URL and a secret token that authenticates events back to this panel. Add the crontab line to your host’s crontab with crontab -e, and source the config.env from your cron script. The monitor starts detecting saturation immediately.
Auto-restart: when enabled, the script issues docker restart {container} after declaring saturation. Use with care on production – a restart drops all in-flight requests. The restart cooldown (default: 20 minutes) prevents the script from restarting more than once per incident.
Test Account Manager
Creates dedicated WordPress test users for Playwright and automated testing. Provides a session API that generates temporary admin cookies without triggering 2FA – so your test suite can log in as a real administrator without disabling the two-factor authentication protecting your live site.
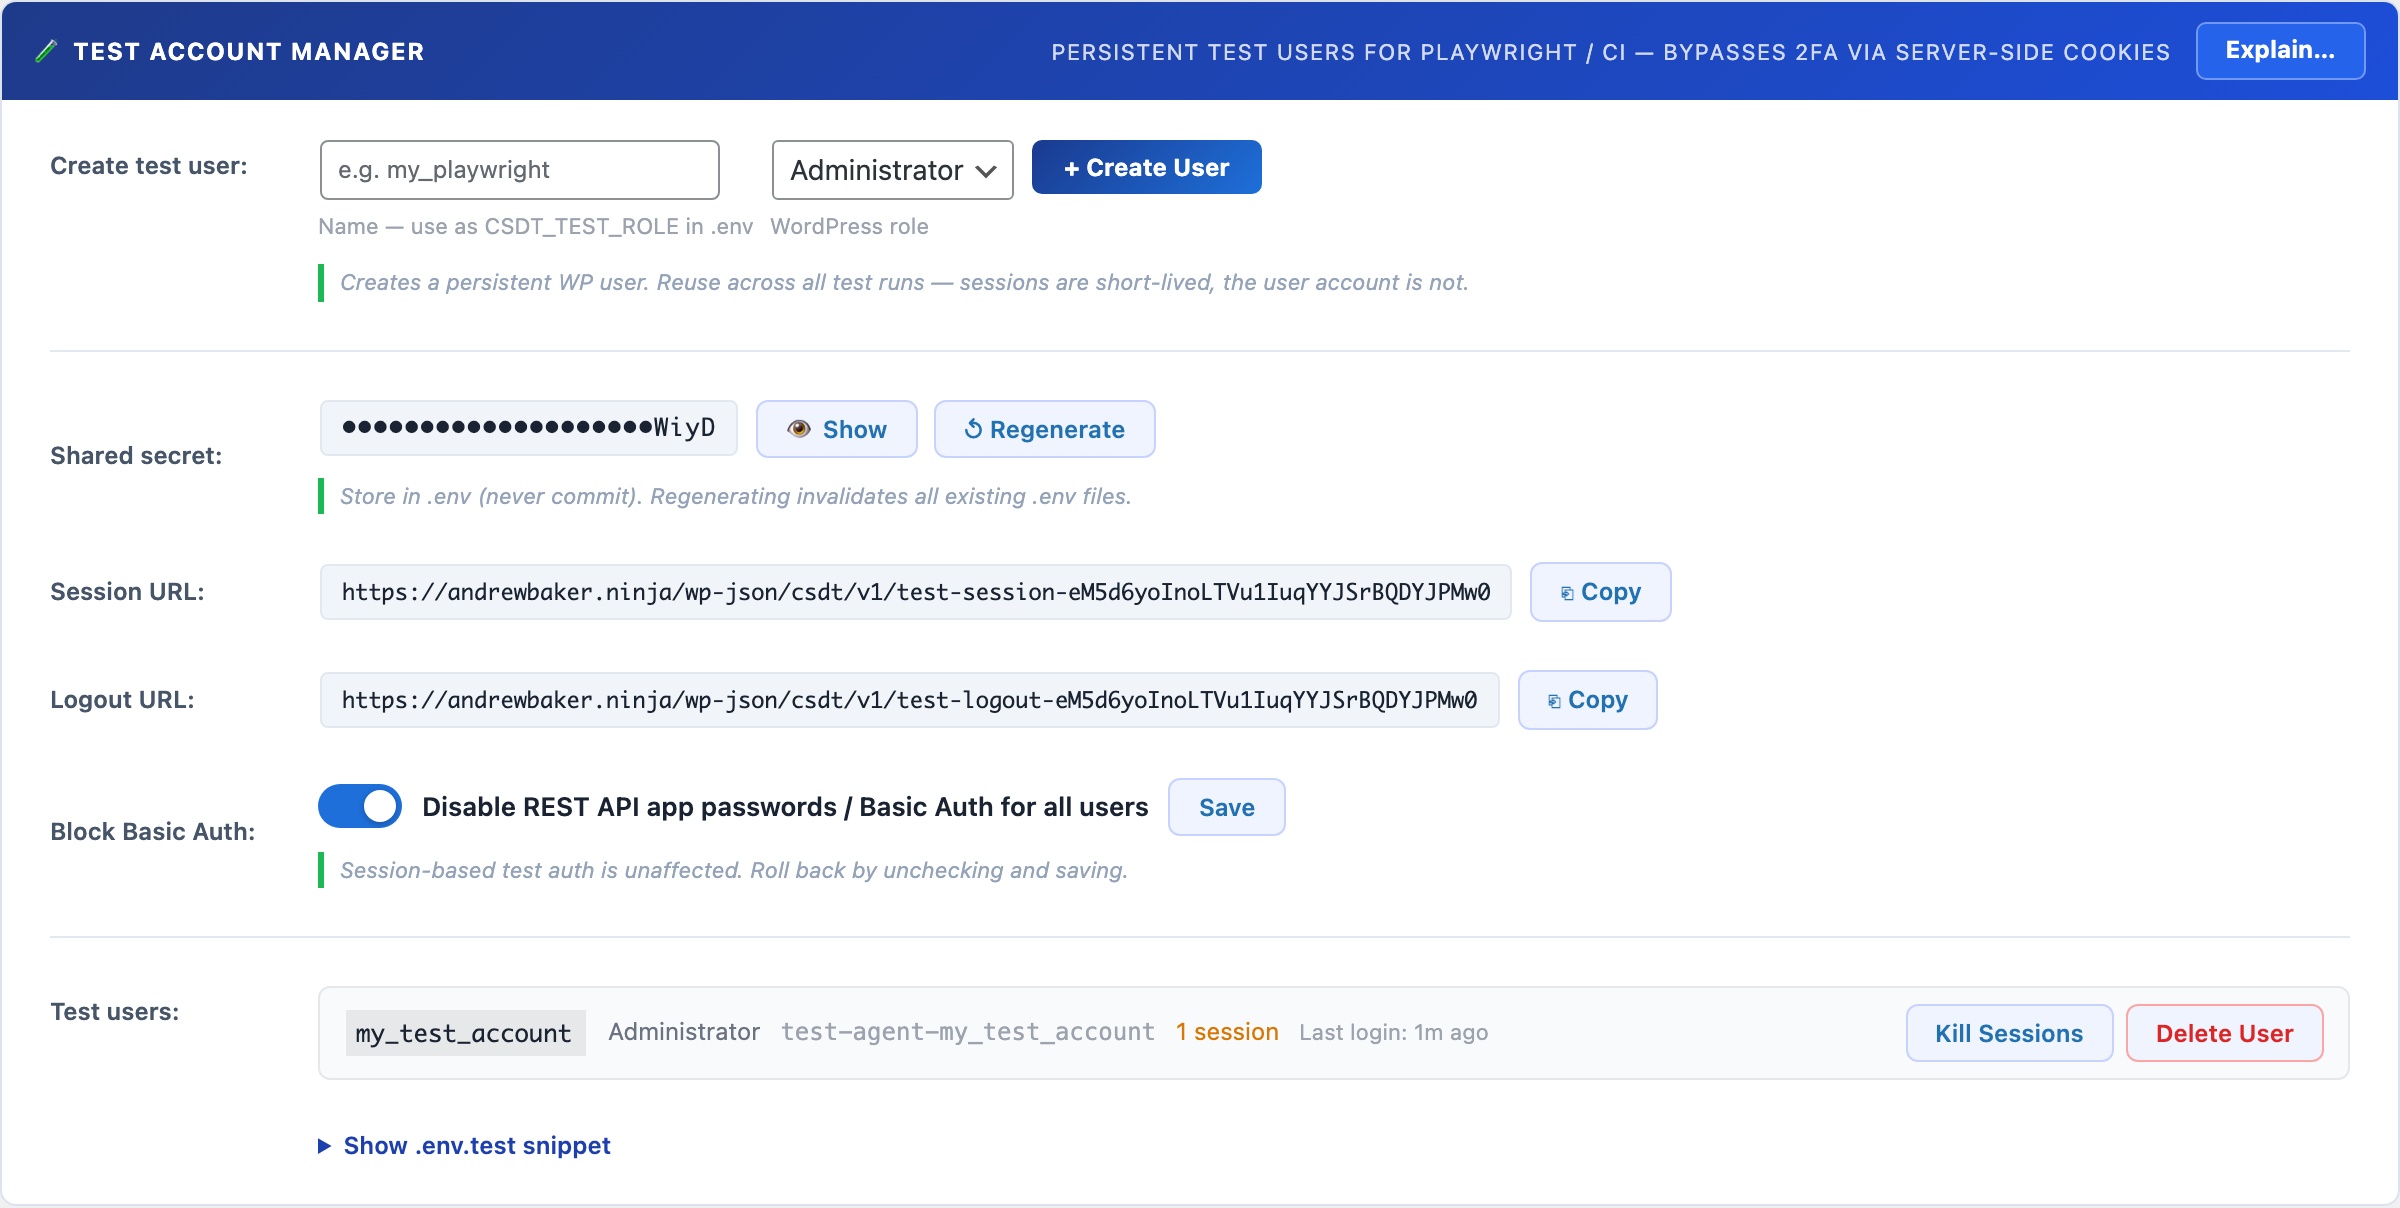
🤖 Playwright Testing on a Live Site Without Disabling 2FA
Automated end-to-end testing with Playwright requires logging in as a real WordPress user. But if 2FA is enabled on your admin accounts (which it should be), your test suite cannot log in using a username and password alone. The standard workarounds – disabling 2FA for testing, creating a permanent admin account with weak credentials, or patching the login flow – all introduce real security risks on your production site.
The Test Account Manager solves this properly. It creates dedicated test users with real WordPress roles, and provides a session API that generates temporary authenticated cookies without going through the login flow at all. Your 2FA stays active. Your live admin accounts are never touched. Your test suite gets a real session it can use, and the session is invalidated when the test run finishes.
The mechanism works through a server-side session API: a secret-protected REST endpoint that accepts a role name and TTL, then returns a set of WordPress authentication cookies issued directly by the server for a designated test user. The cookies are indistinguishable from a real browser session, so Playwright can inject them and access the WordPress admin as a fully authenticated user. No login page, no password, no 2FA prompt. The session expires after the configured TTL and can be explicitly invalidated at the end of a test run via the logout endpoint.
Test users are real WordPress accounts using standard WordPress roles (Administrator, Editor, Author, Subscriber, etc.). They are named with a unique identifier so they are clearly recognisable as test accounts and are never confused with real user accounts. One session API endpoint serves all test users – the caller specifies which role to get a session for in the request body, authenticated by the shared secret.
The Four-Step Flow
- Create a test user: enter a name (e.g.
my_playwright), choose the WordPress role the tests need (default: Administrator), and click + Create User. CloudScale creates a WordPress user account namedcsdt-playwright-my_playwrightwith a randomly generated password you never need to know. The user appears in your test users list immediately. - Configure your .env.test file: copy the pre-filled snippet from the panel. It contains your site URL, the shared secret, the role name, and the session and logout endpoint URLs. Store this file in your project root and load it in your Playwright config with
dotenv. Never commit the shared secret to version control. - Call the session API in your tests: at the start of your test suite, POST to the session endpoint with the shared secret and role name. The API returns WordPress authentication cookies. Inject them into a Playwright browser context. Your tests now run as a fully authenticated WordPress user. The Playwright helper code is shown in the .env.test snippet section below the user list.
- Log out when done: at the end of your test suite (in an
afterAllhook), POST to the logout endpoint with the same secret and role. The session is invalidated server-side. The test users list shows active session counts so you can verify cleanup worked.
Settings and Controls
- Name: a short identifier for this test user (e.g.
playwright,e2e_admin,ci_editor). The actual WordPress username will becsdt-playwright-{name}to make test accounts identifiable in the Users list. - WordPress Role: the role this test user will have. Choose the minimum role your tests actually need. If you are testing editor-only flows, create an Editor account rather than an Administrator to limit the blast radius if the shared secret is ever leaked.
- Shared Secret: a randomly generated 32-character secret used to authenticate all API requests. Click Show / Hide to reveal it for copying. Click Regenerate to issue a new secret – all .env.test files using the old secret will need to be updated. The secret is stored in your WordPress database and is never transmitted in an API response (only used to authenticate incoming requests).
- Session URL: the POST endpoint for obtaining a session. The URL contains a 32-character random path token so it is not guessable. Each request must also include the shared secret in the POST body. Copy the URL with the copy button.
- Logout URL: the POST endpoint for invalidating a session. Call this in your test suite’s afterAll hook. Accepts the shared secret and role, and optionally a specific session token to invalidate a single session rather than all sessions for that user.
- Active sessions: each test user row shows the number of currently live sessions, colour-coded amber when non-zero. Click Kill Sessions to manually invalidate all sessions for a user without calling the logout endpoint – useful during development when you want to force a fresh session.
- Last Login: the timestamp of the most recent session creation via the API for that test user. Shows relative time (e.g. “5m ago”) for recent activity and the date for older entries.
- Delete User: permanently removes the WordPress test account. Any active sessions are also invalidated. Cannot be undone.
The .env.test Snippet
The panel generates a ready-to-use .env.test file snippet based on your current configuration. Copy it into a file at the root of your test project:
WP_SITE=https://yoursite.com
CSDT_TEST_SECRET=your_secret_here
CSDT_TEST_ROLE=my_playwright
CSDT_TEST_SESSION_URL=https://yoursite.com/wp-json/csdt/v1/test-session-{token}
CSDT_TEST_LOGOUT_URL=https://yoursite.com/wp-json/csdt/v1/test-logout-{token}
Load this in your Playwright config with require('dotenv').config({ path: '.env.test' }) and access the values as process.env.CSDT_TEST_SECRET etc.
Security: what is and is not protected
The session endpoint is publicly accessible (no WordPress login required) but requires both the shared secret in the POST body AND the correct path token in the URL. An attacker would need to know both the secret and the path to request a session. Keep the .env.test file out of version control (.gitignore it) and regenerate the shared secret if you suspect it has leaked.
Test sessions created via the API are real WordPress sessions with full role permissions. Keep TTLs short (1200 seconds is the recommended default for most test runs) and always call the logout endpoint at the end of your suite. The test users list shows active session counts so you can spot stale sessions and kill them manually.
OPcache Monitor
Displays the current PHP OPcache status: memory usage, hit rate, and the number of cached vs. uncached scripts. A hit rate below 90% or a full cache means PHP is recompiling scripts on every request, significantly slowing your site. Includes a one-click Reset button to flush the cache after code deployments.
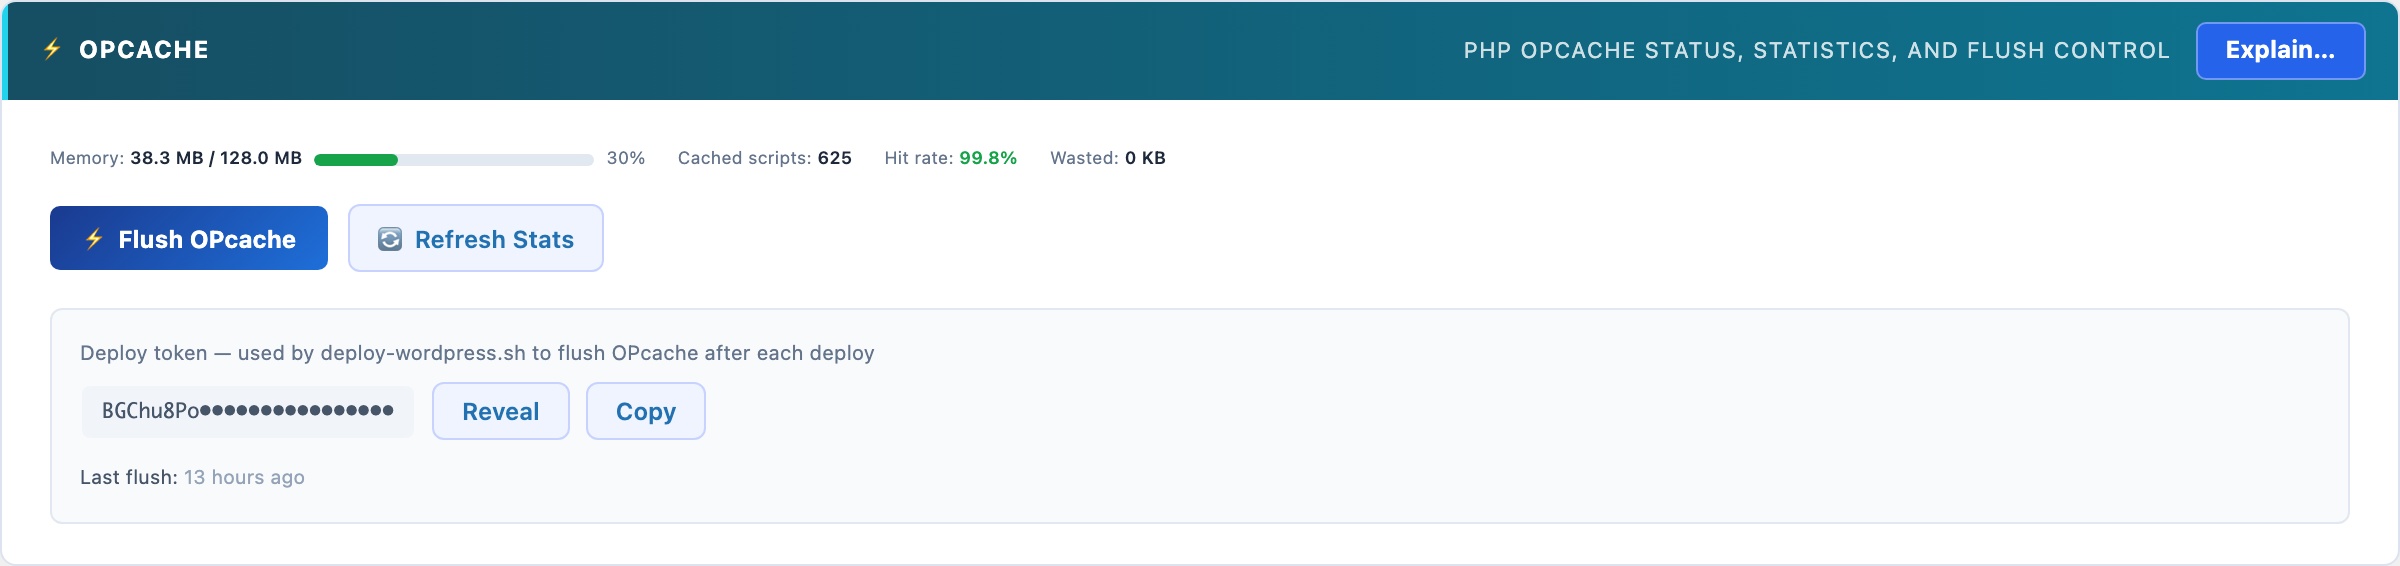
PHP OPcache: the Single Biggest PHP Performance Win
PHP compiles source code to bytecode every time a script runs – unless OPcache is enabled. With OPcache, the bytecode is compiled once and stored in shared memory. Every subsequent request skips compilation entirely. On a WordPress site with 200+ PHP files loading per request, this typically cuts PHP execution time by 30-50%.
Reading the Status Panel
- Hit rate: the percentage of PHP script requests served from cache. A healthy hit rate is 95% or higher. Below 90% means either the cache is too small, too many unique scripts are being loaded, or OPcache is not configured correctly.
- Memory usage: how much of the configured OPcache memory is currently in use. If this is above 90%, increase
opcache.memory_consumptionin your php.ini – a full cache means PHP starts evicting cached scripts, causing recompilation and dramatically degrading performance. - Cached scripts: the number of PHP files currently compiled and stored in the cache. For a standard WordPress installation, expect 400-800 scripts.
- Interned strings: OPcache also caches repeated string values (class names, function names, etc.) to reduce memory duplication across worker processes.
Reset button
After deploying code changes (new plugin versions, theme updates, custom code), the cached bytecode may no longer match the files on disk. Click Reset OPcache to flush all cached scripts. WordPress will recompile them on the next few requests. The site remains available during the reset – there’s no downtime.
SMTP Mailer
Replaces WordPress’s unreliable PHP mail() function with authenticated SMTP delivery. Supports Gmail, Outlook, Amazon SES, Mailgun, and any standard SMTP server. Includes a test-send button and a persistent activity log showing every outgoing message with delivery status.
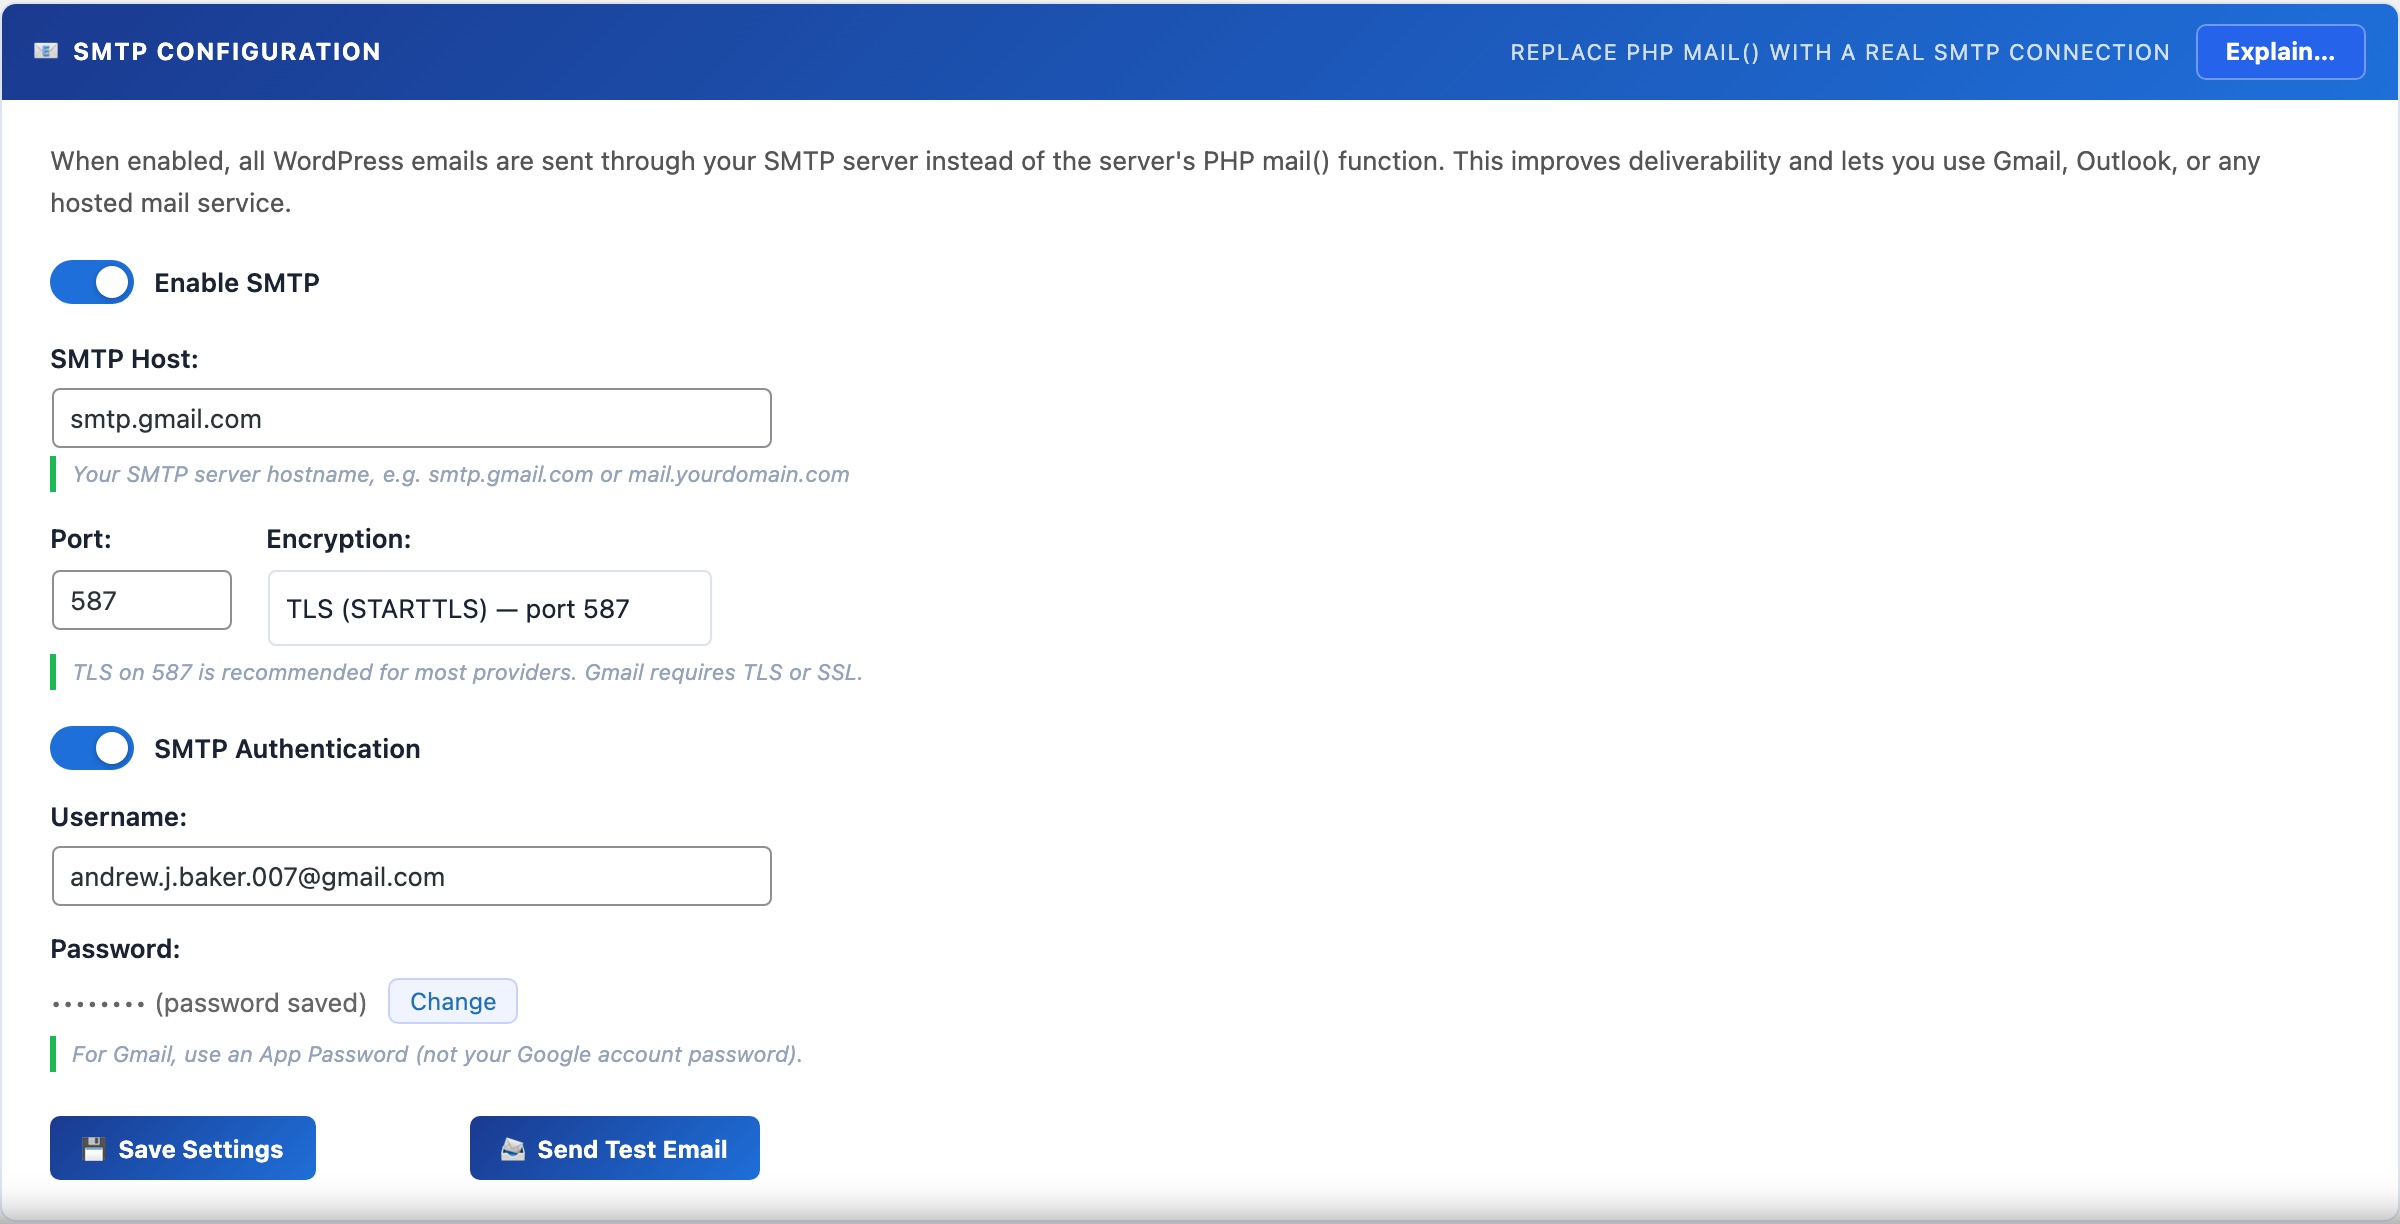
📧 Stop Losing Emails to the Spam Folder
By default, WordPress sends email via PHP’s mail() function. Email sent this way – directly from your server’s IP with no authentication – is rejected by Gmail, Outlook, and most modern mail services, or silently dropped into spam. Authenticated SMTP delivery solves this permanently.
Once configured, all WordPress email goes through your SMTP server: WooCommerce order confirmations, password reset links, admin notifications, CloudScale scan alerts, 2FA OTP codes, and any plugin that calls wp_mail(). No code changes required anywhere else.
Supported providers
- Gmail (Google Workspace): use an App Password (not your account password). Enable 2-Step Verification in your Google account first, then go to Google Account → Security → App passwords → create one for “Mail”. Host:
smtp.gmail.com, Port:587, Encryption: TLS. - Outlook / Microsoft 365: Host:
smtp.office365.com, Port:587, Encryption: TLS. Use your full email address as the username. - Amazon SES: create SMTP credentials in the SES console (IAM user with SMTP permissions). Host varies by region, e.g.
email-smtp.us-east-1.amazonaws.com, Port:587. - Mailgun, SendGrid, Postmark: use the SMTP relay settings provided in your account dashboard. All use standard SMTP with API key as the password.
- Custom SMTP server: enter your host, port, encryption type, username, and password directly.
Test before you save
Use the Send Test Email button to confirm delivery before saving. The test sends a real email to your WordPress admin address. Check the Email Log tab if you don’t receive it within a few minutes – the log shows whether the send was attempted and what error (if any) was returned.
Email Activity Log
Logs every email sent by WordPress – regardless of whether SMTP is enabled – with the subject, recipient, timestamp, and delivery status. Click any row to view the full email body. Invaluable for debugging WooCommerce order notifications, password reset failures, and contact form delivery issues.
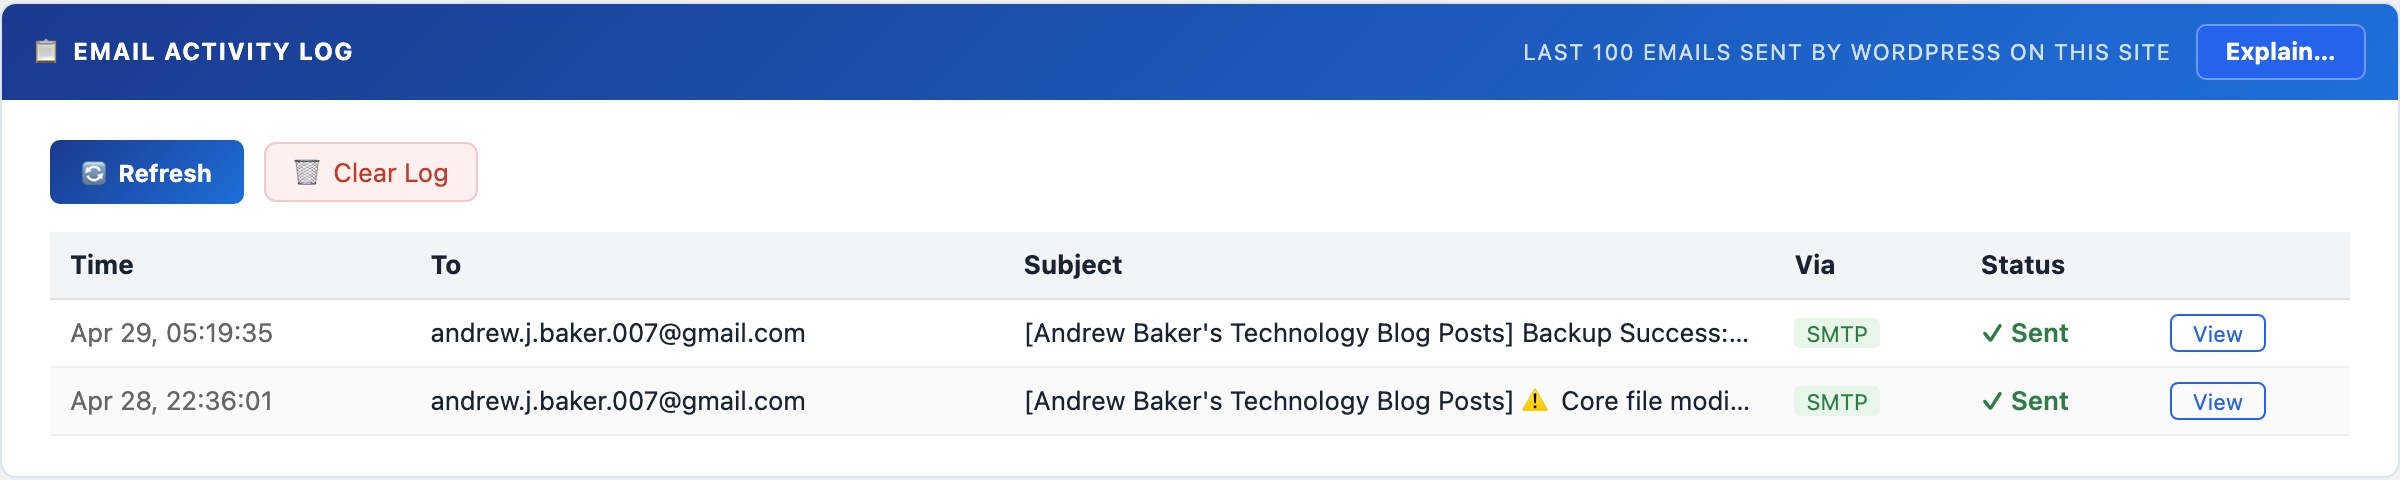
📬 See Every Email WordPress Has Sent
The email activity log captures every outgoing email regardless of delivery method – PHP mail(), SMTP, or any third-party mailer that hooks into wp_mail(). If a user says they didn’t receive a password reset or a WooCommerce order notification, this is the first place to look.
Each log entry records: timestamp, recipient address, subject line, and delivery status (sent successfully or failed with error). Click any row to open a modal showing the full email body – useful for verifying the content of automated emails without having to trigger them again.
Diagnosing email problems
If a recipient says they didn’t get an email:
- Check the log for their address and the expected subject – if it shows “Sent”, WordPress delivered it to your SMTP server. The problem is downstream (spam folder, SPF/DKIM failure, recipient’s mail server).
- If the log shows “Failed” or the email isn’t in the log at all, check the SMTP settings on the Mail tab. A common cause is an incorrect App Password or an outbound port blocked by the hosting provider.
- If the log is empty for a plugin’s emails, that plugin may be bypassing
wp_mail()and using its own mailer – in that case, CloudScale cannot intercept it.
The log retains the last 200 entries. Use the Clear Log button to reset it after debugging.
Thumbnails & Open Graph
Diagnoses social sharing thumbnail failures: checks your Open Graph meta tags and featured image setup, scans recent posts for missing images, and audits your Cloudflare image caching configuration. Social media platforms and link preview tools (Slack, Teams, WhatsApp) rely on Open Graph tags to generate preview cards – when these are wrong, links share as plain text with no image.
🖼️ Why Your Links Share Without a Preview Image
When someone shares a WordPress post link on Slack, Twitter, WhatsApp, or LinkedIn, the platform fetches your page to build a preview card. That card is driven entirely by Open Graph meta tags – specifically og:image. If the tag is missing, wrong, or pointing to an image that Cloudflare is caching with a wrong content-type, the link shares as bare text. This diagnostic panel finds and fixes those problems.
Open Graph URL Checker
Enter any public URL on your site to inspect its Open Graph tags. The checker fetches the page, parses the <head>, and reports all OG meta tags found (title, description, image, type) along with a visual preview of how the link will appear when shared. Immediately shows if og:image is missing or pointing to a non-existent URL.
Recent Posts Scan
Scans your 20 most recently published posts and checks each one for a set featured image. Posts without a featured image are listed so you can add images before they’re shared on social media.
Cloudflare Image Cache
Cloudflare’s aggressive caching can serve stale or incorrectly-typed image responses to social platform crawlers. This panel lets you configure Cloudflare cache settings for image URLs to ensure social crawlers always get a fresh, correctly-typed response. Enter your Cloudflare Zone ID and API token to enable the cache management tools.
Media Library Audit
Lists orphaned attachment records in your database – images that exist in wp_posts as attachments but whose files are missing from the uploads directory. These cause 404 errors when social crawlers try to fetch the referenced og:image. The audit lets you identify and clean up broken attachment records.