CloudScale Cleanup
CloudScale Cleanup
WP-Optimize and Advanced Database Cleaner charge $39–$99/year for features that are straightforward to implement. CloudScale Cleanup gives you full database cleanup, media library orphan removal, image optimisation, PNG-to-JPEG conversion, and a live cron management console — with a dry-run preview so you never delete anything by accident. Completely free, open source, no subscriptions, no premium tier.
Site Health
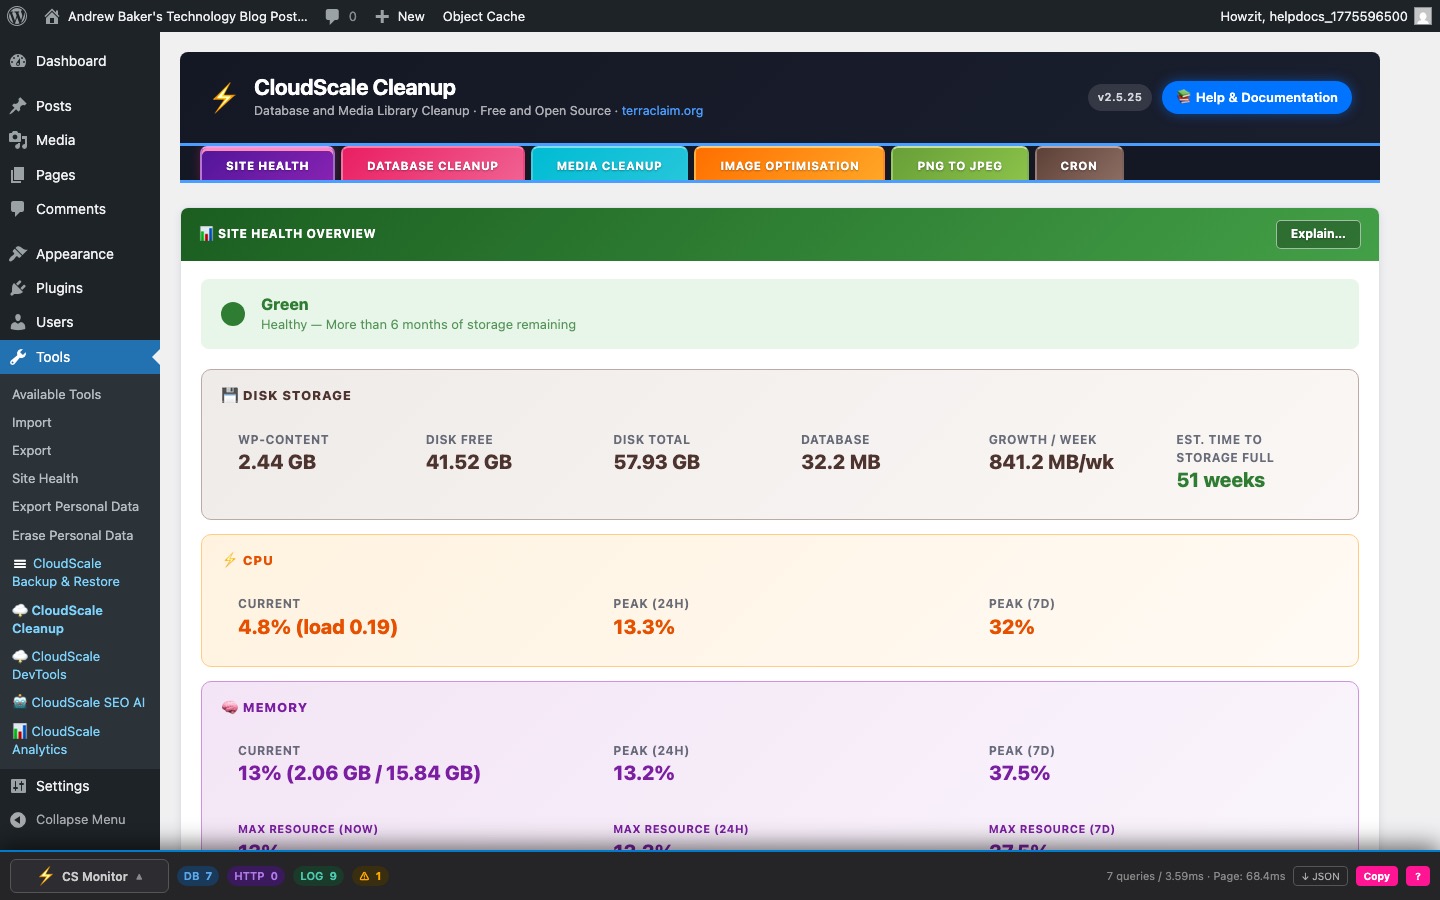
The Site Health tab is a live server metrics dashboard. It collects disk storage, CPU, and memory data automatically in the background and presents it as a RAG (Red/Amber/Green) status indicator so you can spot problems before they affect your site.
Storage RAG indicator
The coloured banner at the top of the tab summarises your storage runway:
- Green — 6 or more months of disk space remaining at current growth rate.
- Amber — 3–6 months remaining. Consider running a cleanup or archiving old uploads.
- Red — under 3 months remaining. Immediate action recommended.
- Grey (Collecting) — fewer than two weekly snapshots have been recorded yet. The estimate requires at least two data points to calculate a growth rate.
Metric groups
Disk Storage
- Used — total disk space consumed by the entire server filesystem.
- Free — available disk space.
- Total — total filesystem capacity.
- Database Size — the combined size of all tables in the WordPress database.
- Growth/Wk — average weekly storage increase, calculated from up to 3 months of weekly disk snapshots. Shown as “Stable / shrinking” if growth is zero or negative.
- Est. Wks to Full — at the current growth rate, how many weeks before the disk fills. Shown as “>> 2 Years” when the estimate exceeds 104 weeks. Colour-coded to match the storage RAG.
Note — local backups inflate the growth figure: If your backup plugin stores backup files on the same disk (inside wp-content or the server filesystem), each backup run adds to the measured disk usage. This pushes the Growth/Wk figure up and makes the Est. Wks to Full shorter than the real runway. If you store multiple backup generations locally, the growth rate only stabilises once the backup rotation reaches its maximum — at that point old backups are deleted as new ones are created, and net growth flattens. For example, if you allow 5 backup copies and each copy is 2 GB, the disk will grow by ~10 GB before the rotation kicks in and growth levels off. The Est. Wks to Full will appear alarming until that equilibrium is reached. The most accurate solution is to store backups on an external destination (S3, remote FTP, cloud) — tools like CloudScale Backup can be configured with a maximum number of retained copies so that once the limit is reached, the oldest backup is deleted before the new one is written, keeping net disk growth at zero from backups.
CPU
- Now — current CPU usage percentage, with the load average in parentheses when sysstat is available.
- 24h Peak — highest CPU usage recorded in the last 24 hours.
- 7d Peak — highest CPU usage recorded in the last 7 days.
Memory
- Now — current memory usage percentage with used/total bytes.
- 24h Peak — highest memory usage in the last 24 hours.
- 7d Peak — highest memory usage in the last 7 days.
Autoload RAG — a separate indicator in the dashboard header tile shows the current WordPress autoload size (the data loaded from wp_options on every page request). Green = healthy, amber = elevated, red = excessive. This is a quick-glance signal to visit the Database Cleanup tab’s Autoloaded Options panel.
Data collection
Metrics are collected automatically by two WordPress Cron jobs registered by the plugin:
- Hourly (
csc_health_hourly_collect) — records current CPU percentage and memory percentage. Up to 180 days of hourly samples are stored. - Weekly (
csc_health_weekly_snapshot) — records disk used, disk free, disk total, and database size. Up to 3 months of weekly snapshots are stored.
All data is stored in wp_options with autoload=no so it does not add to the per-request payload. No data leaves your server.
Buttons
- Refresh — reloads the dashboard from stored data without running a new collection job.
- Collect Metrics Now — immediately fires both the hourly and weekly collection jobs. Use this on a fresh install to seed the first data points instead of waiting for the scheduled cron to run. A confirmation modal explains what will happen.
- Test Sysstat — runs a server-side check to determine whether the
sarcommand from thesysstatpackage is installed, active, and returning data. Results are shown inline with colour-coded status and, where applicable, installation instructions.
sysstat (sar) — accurate CPU and memory peaks
Without sysstat, the plugin takes an instantaneous snapshot of the load average from /proc/loadavg and memory from /proc/meminfo at the exact moment the hourly cron job runs. On a quiet server these snapshots are often 0% because they capture a single idle second rather than the busiest period of the last hour.
sysstat samples the system continuously every 10 minutes and writes the data to /var/log/sa/. When it is installed and active, the plugin queries sar for the actual per-minute maximum over the past 60 minutes — a far more accurate representation of real CPU and memory usage.
Install and enable on Amazon Linux / RHEL:
sudo yum install sysstat -y
sudo systemctl enable sysstat && sudo systemctl start sysstat
sudo systemctl enable sysstat-collect.timer && sudo systemctl start sysstat-collect.timer
Install and enable on Ubuntu / Debian:
sudo apt install sysstat -y
sudo systemctl enable sysstat && sudo systemctl start sysstat
sudo systemctl enable sysstat-collect.timer && sudo systemctl start sysstat-collect.timer
Verify data is being collected:
LC_ALL=C /usr/bin/sar -u 2>&1 | tail -5You should see rows of CPU timestamps and percentages. If you see only a header with no data rows, the sysstat-collect.timer is not running. On Amazon Linux 2023, enabling the sysstat service alone is not sufficient — the collect timer must also be enabled separately. Use the Test Sysstat button to confirm the plugin can read data successfully.
Database Cleanup
Why CloudScale Cleanup?
WordPress databases grow silently. Post revisions, expired transients, spam comments, orphaned metadata, and unused term relationships accumulate over months and years. On a busy site the database can balloon to 10× its necessary size, slowing every query and inflating every backup.
WP-Optimize locks most of its cleanup options behind a $39/year paywall. Advanced Database Cleaner charges $49/year. CloudScale Cleanup does everything they do — and adds media library orphan detection, image optimisation, and cron management — at zero cost.
Every operation has a dry-run preview mode. You see exactly what will be deleted before anything is removed. No data leaves your server.
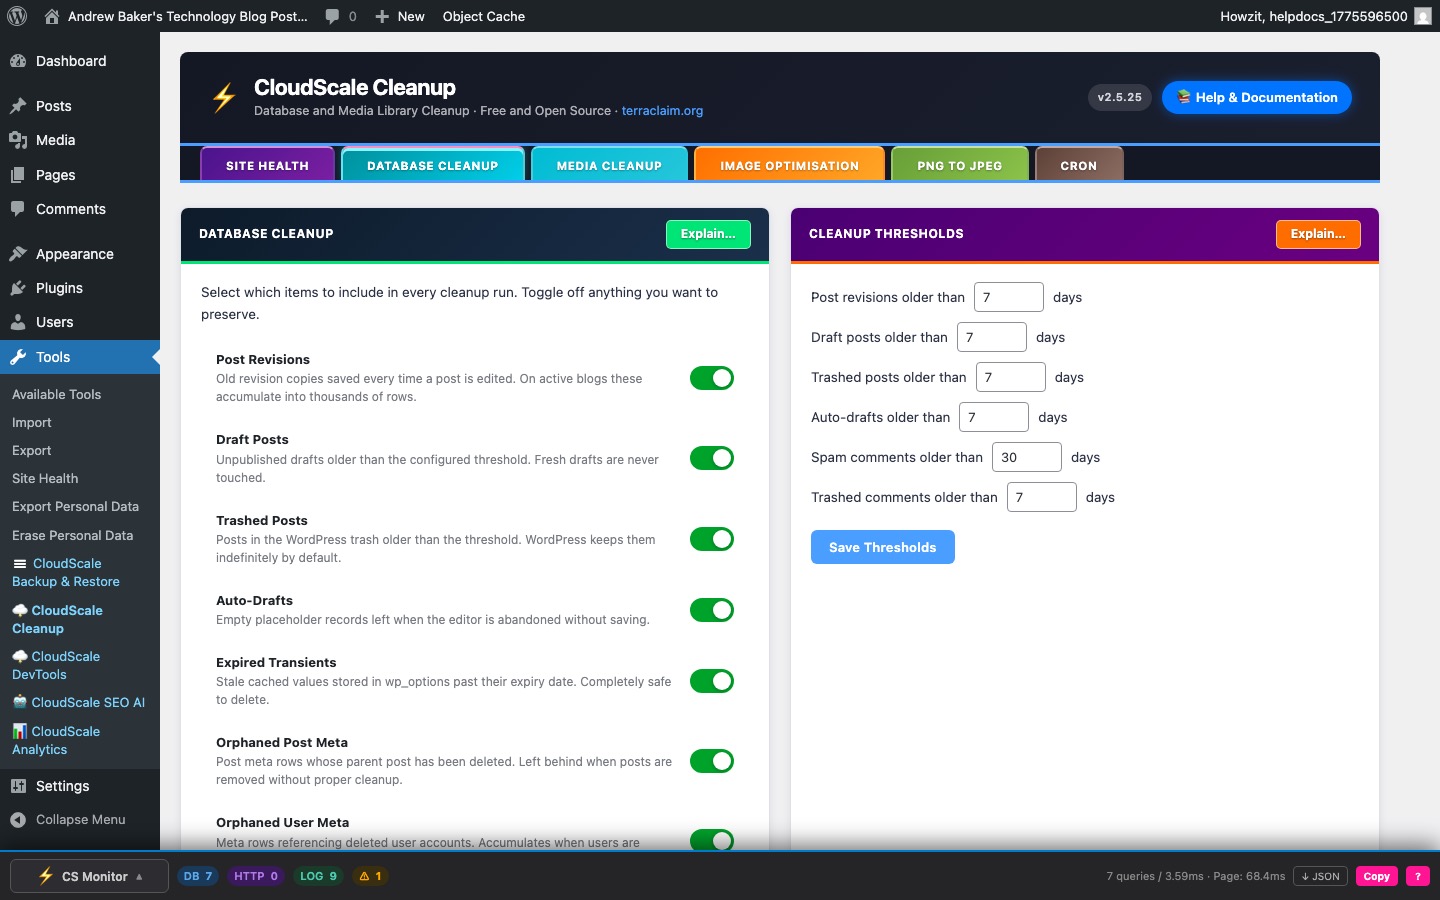
The Database Cleanup tab contains four panels, each targeting a different category of database bloat. Use the Explain… button in each panel header to get a description of every item type.
Main Cleanup
Removes accumulated junk rows from your WordPress database that slow down queries and inflate backup sizes. On a WordPress site with 3–5 years of active editing, these items routinely account for 30–70% of total database size.
Always run Dry Run first. It shows exactly what will be deleted (with row counts per category) without making any changes. Cleanup then runs in batches of 50 rows per AJAX request, with the remaining queue stored in a transient between requests — so no single PHP request can time out regardless of how much data needs processing.
Item types and the database tables affected:
- Post revisions (
wp_postswherepost_type = 'revision', pluswp_postmeta) — WordPress saves a revision on every manual save and autosave. A single post edited 50 times generates 50 revision rows. A configurable age threshold controls which revisions are eligible; fresh revisions are never touched. - Draft posts (
wp_postswherepost_status = 'draft') — posts saved as drafts but never published. Age threshold configurable; recent drafts are protected. - Trashed posts (
wp_postswherepost_status = 'trash') — content moved to the Trash. WordPress does not auto-purge trash by default. - Auto-drafts (
wp_postswherepost_status = 'auto-draft') — created by Gutenberg every time you open the Add New Post screen. Accumulate invisibly with no user action required. - Spam comments (
wp_commentswherecomment_approved = 'spam') — high-traffic sites accumulate tens of thousands. - Trashed comments (
wp_commentswherecomment_approved = 'trash'). - Expired transients (
wp_optionsrows matching_transient_timeout_%whose value is in the past, plus their corresponding_transient_%rows) — on sites using a persistent object cache (Redis, Memcached) transients are stored there instead; this cleanup is a no-op in that case. - Orphaned post meta (
wp_postmetarows whosepost_idno longer exists inwp_posts) — generated when posts are force-deleted without triggering the standard WordPress delete hook. - Orphaned user meta (
wp_usermetarows whoseuser_idno longer exists inwp_users) — accumulates when users are removed directly from the database rather than through WordPress.
Each item type has an independent toggle — green means included in the next run, grey means skipped. Toggle states are saved and respected by both Dry Run and the actual cleanup. All output appears in the Database Console: a dark terminal panel at the bottom of the tab that logs every step with row counts. Use Copy to export the full log.
Cleanup Thresholds
Every time-based item type has a configurable age cutoff in days. Items newer than the threshold are never touched, even if their status would otherwise qualify them for deletion. Defaults are conservative:
- Post revisions: 30 days
- Draft posts: 90 days
- Trashed posts: 30 days
- Auto-drafts: 7 days
- Spam comments: 30 days
- Trashed comments: 30 days
Adjust these to match your workflow, then click Save Settings.
Autoloaded Options
WordPress loads every row in wp_options marked autoload = yes on every page request — including pages that never use those values. Plugins add rows here for caching and configuration but often forget to clean up expired or stale entries. On a site with many installed plugins, autoloaded data can reach 500 KB–2 MB, adding measurable overhead to every single request.
The panel shows the current autoload size with a RAG badge (green = healthy, amber = elevated, red = excessive) and lists the largest individual rows by size.
What the cleanup does:
- Deletes expired transients — removes transient rows whose timeout has already passed. Identical to the main cleanup’s transient deletion but scoped specifically to autoloaded rows.
- Disables autoload on live transients — transient rows that haven’t yet expired don’t need to be autoloaded. WordPress fetches them on demand when a plugin calls
get_transient(). Settingautoload = noremoves them from the per-request payload without deleting any data or breaking any plugin.
This cleanup is non-destructive — no valid plugin data is removed or altered. Run Dry Run — Preview first to see the current size breakdown before applying.
Orphaned Plugin Options
When a plugin is deleted without a proper uninstall routine, its configuration rows remain in wp_options forever — including autoloaded rows that bloat every page request. WordPress never removes these automatically.
The Orphaned Plugin Options panel scans wp_options using prefix matching against a built-in list of known plugin slugs. Rows whose option name prefix matches a plugin that is no longer installed are flagged. Results appear as a checklist — rows matched by a known plugin prefix are pre-selected; unrecognised prefixes are unchecked for manual review.
Always review results carefully before deleting. Some plugins use option names that don’t obviously match their slug. Uncheck anything you’re unsure about. The panel uses a recycle bin so no deletion is permanent by default:
- Scan for Orphans — runs the detection scan and displays results. No changes are made.
- Move to Recycle Bin — moves selected rows to a temporary holding area (stored in a separate
wp_optionskey). Original values are fully preserved. - View — shows all items currently in the recycle bin with their names and values.
- Restore All — moves all recycled options back to their original state.
- Empty Bin — permanently removes all recycled rows. This cannot be undone.
Table Overhead Repair
Every time WordPress deletes rows, MySQL/InnoDB marks that space as free but does not immediately return it to the filesystem. Over time, tables accumulate fragmented gaps that waste disk space and slow down full-table scans used by queries that don’t have a covering index.
OPTIMIZE TABLE physically rewrites each table, reclaiming the free space. On InnoDB (the default MySQL storage engine for WordPress installations), this runs online on MySQL 5.6+ with no table locks and no downtime.
The panel shows current total overhead across all tables with a RAG badge (green = negligible, amber = moderate, red = significant). Run Dry Run — Preview first to see a per-table breakdown before repairing.
Scheduled Database Cleanup
When enabled, the plugin registers a WordPress Cron job that runs the full database cleanup automatically on the selected days at the configured hour — without requiring you to log in.
- Day selection — choose one or more days per week. Default: Monday, Wednesday, Friday.
- Hour — server local time (0–23). Most cloud VPS hosts default to UTC.
- Auto-reschedule — after each run, the plugin automatically registers the next execution so the schedule stays active indefinitely.
The Cron tab shows the current status and next run time for this job. See the Cron tab documentation for information about real server cron setup and how to avoid the limitations of WordPress pseudo-cron on low-traffic sites.
Media Library Cleanup
The Media Library Cleanup tab identifies and safely removes media attachments and upload files that are no longer used, freeing disk space and reducing backup sizes. All removal operations use a recycle bin — nothing is permanently deleted until you explicitly choose to empty it.
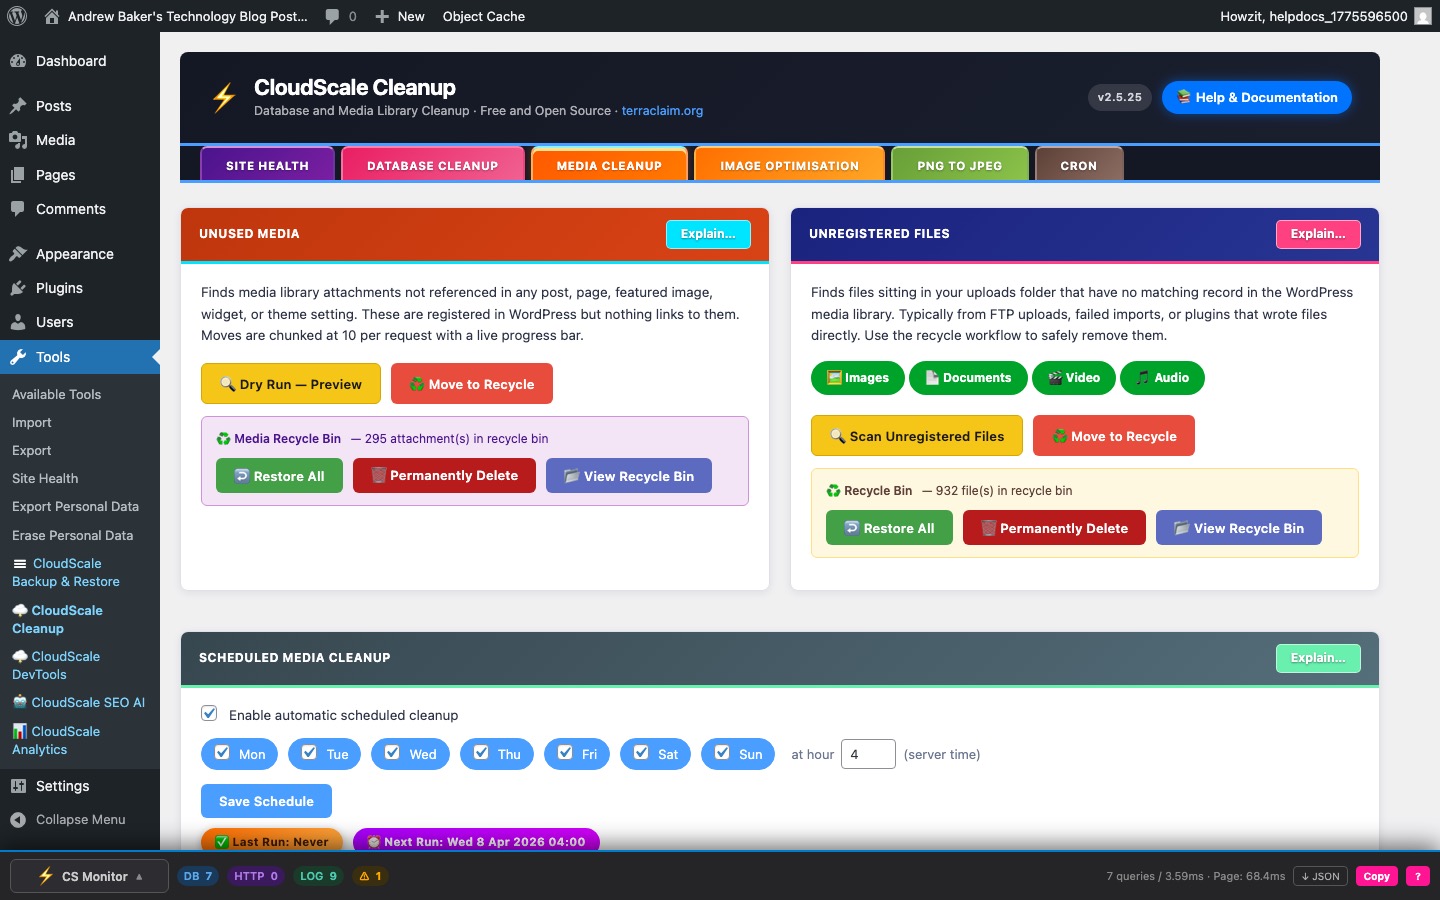
Unused Media
Finds attachments that exist in the WordPress database but are not referenced anywhere on the site. The scan checks all of these locations for every attachment:
- Post content (
wp_posts.post_content) — direct<img>tags, Gutenberg block attributes, and shortcode references. - Post meta (
wp_postmeta) — featured image (_thumbnail_id), WooCommerce product gallery images (_product_image_gallery), and any meta value containing the attachment ID or its URL. - Options (
wp_options) — widget configurations, theme customizer settings, and site logo/icon settings. - Site logo and site icon — always protected regardless of whether they appear elsewhere.
Note: some page builders and slider plugins store image references in custom tables not covered by this scan. When in doubt, move items to the recycle bin and use View Recycle Bin to restore anything needed later.
Workflow:
- Dry Run — Preview — scans the media library and lists all attachments flagged as unreferenced. Review the list carefully. No files are moved at this stage.
- Move to Recycle — moves flagged attachments to a protected recycle bin folder. The original file, all generated thumbnail sizes, the database record, and all attachment metadata are preserved. Processing runs at 10 attachments per AJAX request to stay within PHP memory limits on any server.
Recycle bin actions (shown after a move):
- Restore All — moves all recycled media back to the active media library, exactly as before the move. Database records are re-inserted.
- Permanently Delete — removes recycled files from disk and their database records permanently. This cannot be undone. Always confirm the recycle bin contains only items you want to lose.
- View Recycle Bin — opens a modal listing all recycled attachments with filenames and original sizes, so you can verify before committing to permanent deletion.
The recycle bin persists between page loads. Items remain recycled until you either restore or permanently delete them.
Unregistered Files
Finds files that exist physically on disk inside wp-content/uploads but have no corresponding record in the WordPress media library. These are different from unused media: unused media has a database record with no content references; unregistered files have no database record at all.
Common causes:
- Files uploaded via FTP without being registered in WordPress.
- Partially completed uploads that left temporary files on disk.
- Images imported from another CMS without running the media importer.
- Files left behind by deleted plugins that created their own upload subdirectories.
Use the file type filter pills — Images, Documents, Video, Audio — to include or exclude each category before scanning. The same Dry Run → Move to Recycle → Restore / Permanently Delete workflow applies as for Unused Media.
Broken Image Links
A read-only scan that checks all published posts and pages for <img> tags referencing files in your uploads directory and verifies each file actually exists on disk. Detects broken images caused by deleted files, renamed files, failed optimisation runs, or incomplete migrations.
Results show the post title, the missing file path, and the post edit URL so you can fix the content directly. Use Copy Results to export the full list for bulk repair.
Scheduled Media Cleanup
When enabled, automatically runs the unused media cleanup on the selected days at the configured hour. Flagged attachments are moved to the media recycle bin — not permanently deleted. The same detection logic as the manual scan is used; the site logo and site icon are always protected. After each run the next execution is automatically registered.
Image Optimisation
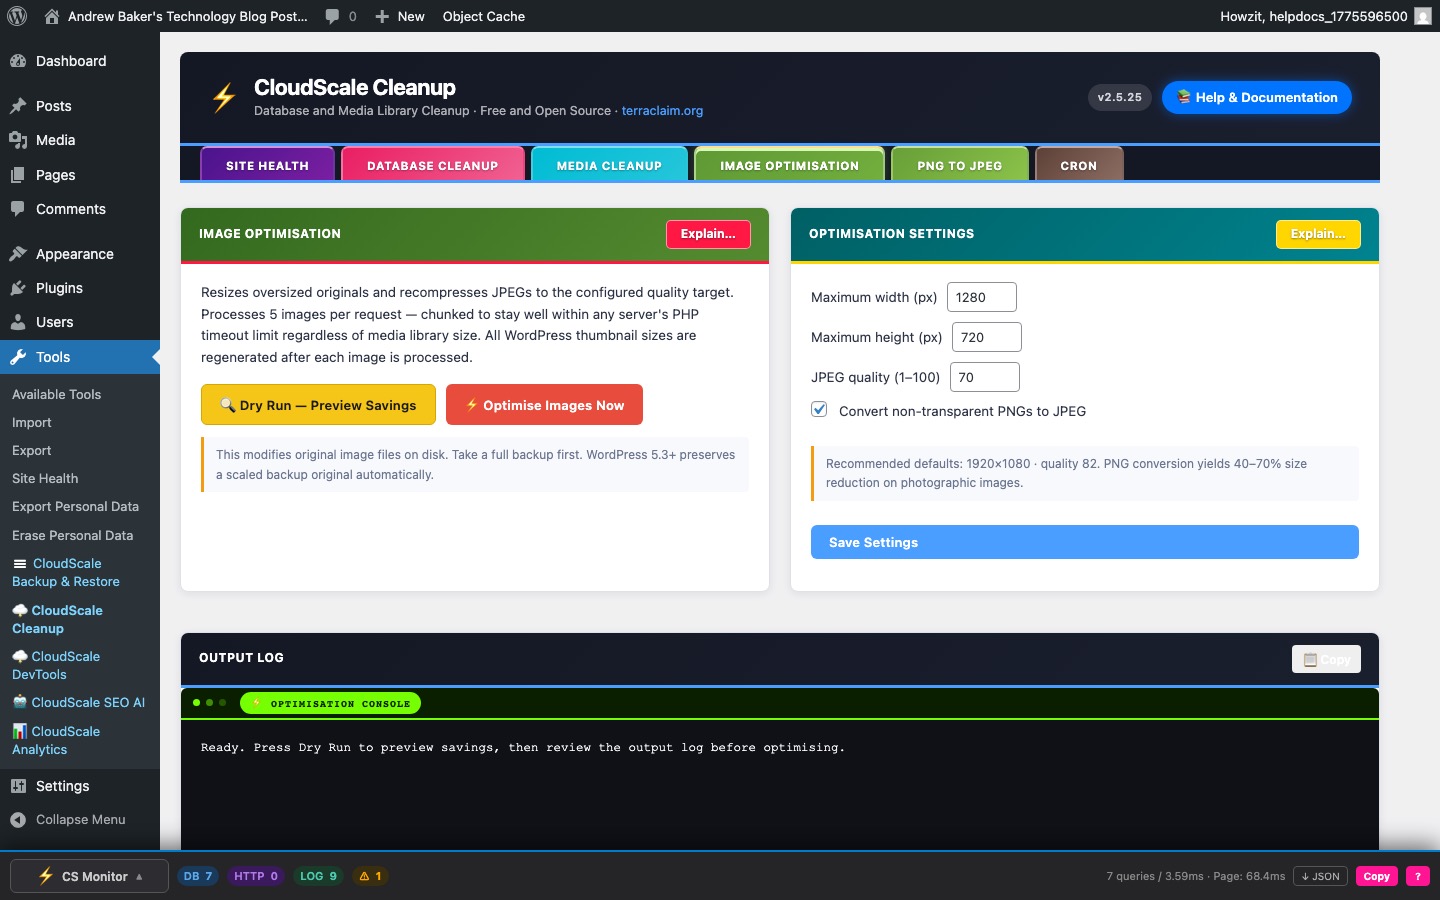
The Image Optimisation tab reduces the on-disk file size of images already in your media library using PHP’s GD or Imagick library. No external service, API key, or data transfer is involved — all processing runs locally on your server.
How it works
The optimiser processes original uploaded images in two passes:
- Resize — any image whose width or height exceeds the configured maximum is scaled down proportionally. The aspect ratio is preserved. Smaller images are left untouched.
- Recompress — the image is re-saved as JPEG at the configured quality level. PNG images are left as PNG unless the Convert non-transparent PNGs to JPEG setting is enabled on the Settings tab.
After each image is processed, all registered WordPress thumbnail sizes are regenerated from the new optimised original to ensure every size on the site stays consistent.
Processing runs at 5 images per AJAX request. The JavaScript engine queues all images and fires requests in sequence until the entire library has been processed, showing a live progress bar and per-image savings in the console.
Always run Dry Run first. The dry run previews estimated file size savings for each image (resize savings, recompress savings, and total) without modifying any files. Check the savings column to identify images where the gain is marginal before committing.
Important: this operation modifies original image files on disk. Take a full backup of your wp-content/uploads directory before running on a production site. WordPress 5.3+ automatically preserves a -scaled backup copy of very large originals, but this is not a full backup.
Optimisation Settings
- Maximum width (px) — any image wider than this value is scaled down proportionally. The height is recalculated to preserve aspect ratio. Default: 1920 px. If your theme never displays images wider than 1200 px, setting this to 1200 will produce better storage savings.
- Maximum height (px) — any image taller than this value is scaled down. Default: 1080 px.
- JPEG quality (1–100) — controls JPEG compression when saving. 80–85 is the recommended range for web photography. Default: 82. Below 70 introduces visible banding in gradients. Above 90 produces diminishing returns with disproportionately larger file sizes.
- Convert non-transparent PNGs to JPEG — when enabled, PNG files without an alpha-channel are converted to JPEG. PNG files with any transparency pixel are automatically detected and skipped to prevent white-box artefacts. Typical size reduction for photographic PNGs: 40–70%. WordPress attachment metadata (post record, URLs, thumbnail paths) is updated so all existing references continue to work. This setting lives on the Optimisation Settings panel on this tab.
Conversion Settings (PNG to JPEG inline conversion)
The same PNG-to-JPEG conversion setting available on the Image Optimisation tab also appears here as a toggle. When enabled it applies during every optimisation run — not only to newly uploaded images but to the entire media library.
Server requirements
- PHP 7.4+ with GD compiled with JPEG and PNG support, or the Imagick extension.
- Check with:
php -m | grep -i "gd|imagick" - Minimum recommended
memory_limit: 128 MB for standard images; 256 MB for images larger than 5000 × 5000 px. - No external network access required.
PNG to JPEG Converter
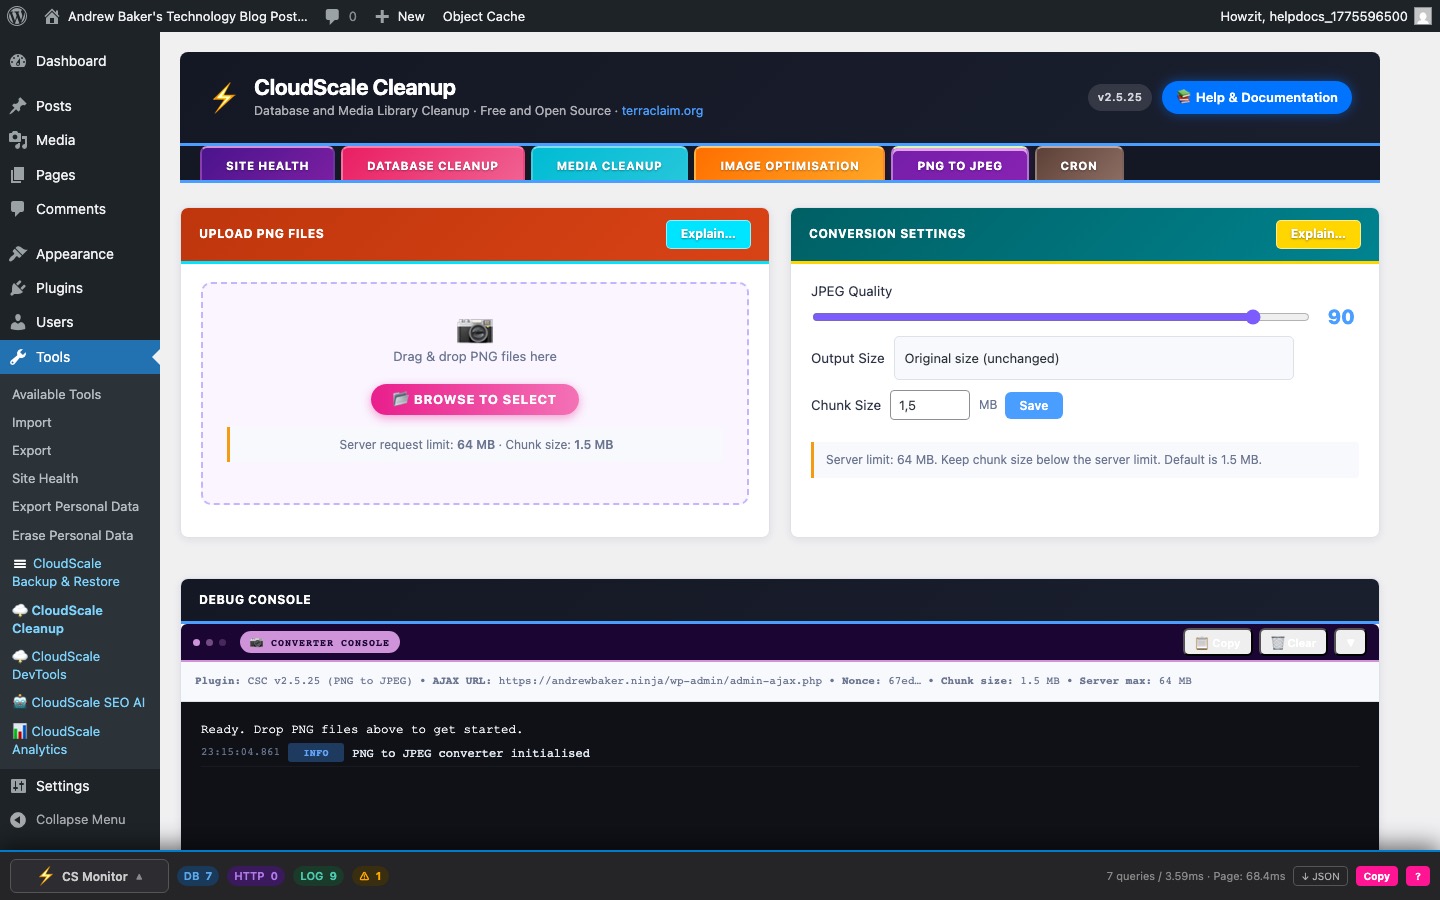
The PNG to JPEG tab is a standalone drag-and-drop converter that takes PNG files from your local computer, converts them to JPEG server-side, and optionally saves the result directly into your WordPress media library — without modifying any existing media library files.
This is intended for pre-processing new images before uploading them, not for batch-converting your existing library (use the Image Optimisation tab for that).
How to use it
- Configure settings — set your JPEG quality, choose an output size preset or enter custom dimensions, and adjust the chunk size if your server has strict upload limits.
- Add files — drag one or more PNG files onto the upload area, or click Browse. Multiple files can be queued at once.
- Convert — click Convert All. Each file is uploaded in chunks, assembled server-side, converted, and returned as a downloadable JPEG. Progress for each file is shown in real time in the Converter Console.
- Download or save to library — each converted file shows a Download button and a Save to Media Library button. Saving prompts for a filename (the
.jpgextension is added automatically) and registers the new image in your WordPress media library.
PNG transparency is composited onto a white background before JPEG conversion, so no content is lost even if the source PNG uses an alpha channel.
Conversion Settings
- JPEG Quality (1–100) — controls JPEG compression. 80–92 is recommended for web use. Default: 90. Use 95+ for print; 60–75 for web thumbnails where file size matters more than quality.
- Output Size — choose a resolution preset:
- 4K (3840 × 2160), 2K (2560 × 1440), Full HD (1920 × 1080), HD (1280 × 720), XGA (1024 × 768), SVGA (800 × 600), VGA (640 × 480), Square 512, Square 256, or Custom.
- Chunk Size (MB) — large PNG files are automatically split into chunks before uploading, each chunk staying within your server’s request size limit. Default: 1.5 MB. The setting shows your current server request limit alongside the chunk size so you can keep the chunk below the limit. Allowed range: 0.25–1.95 MB.
Converter Console
The dark terminal panel at the bottom of the tab logs all activity in real time:
- Server environment summary (PHP memory limit, upload limits, GD / Imagick availability).
- Per-file chunk upload progress.
- Conversion results with original size, output size, and compression ratio.
- Any server-side errors with full detail to help diagnose PHP configuration issues.
Use Copy to export the full log, and Clear to reset it before a new batch.
Cron
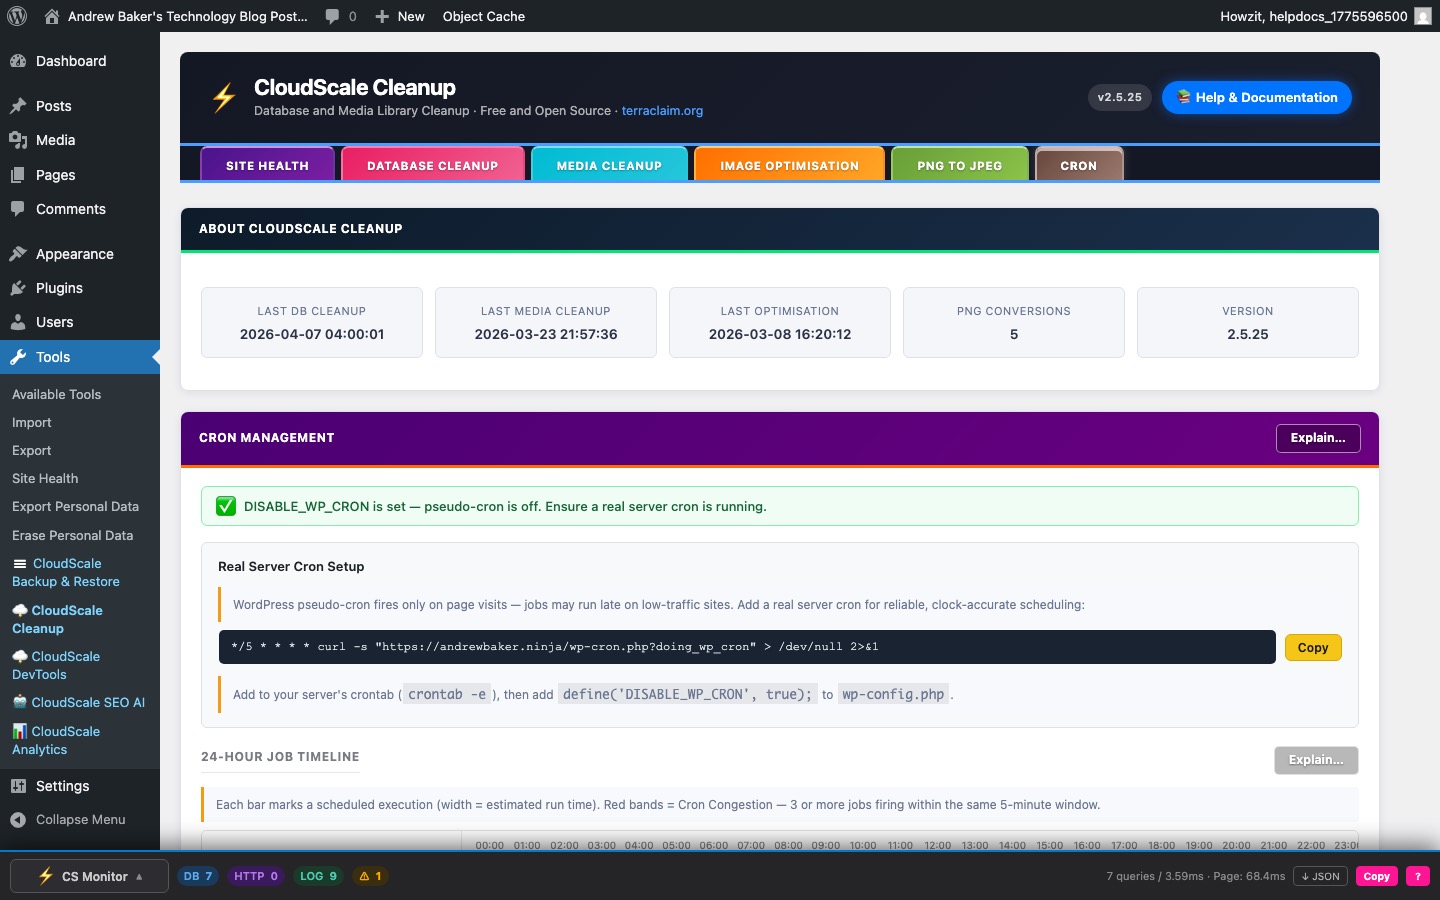
The Cron tab is a full cron management console for your WordPress installation. It shows every background job registered in the WordPress scheduler, visualises when they fire, detects scheduling conflicts, identifies which plugin owns each job, and lets you delete orphaned or unwanted jobs safely via a recycle bin.
What is WordPress Cron?
WordPress has no connection to the operating system’s real scheduler. Instead it simulates cron by checking a job queue on every page visit. When a visitor loads any page, WordPress checks whether any scheduled jobs are overdue and fires them inline during that request. This approach is called pseudo-cron or WP-Cron.
The main limitation: on low-traffic sites, a job scheduled for 3 AM may not actually run until the first visitor arrives after that time — which could be hours later. On high-traffic sites this works reliably, but the extra processing on visitor page loads adds latency.
WP-Cron health banner
The coloured banner at the top of the tab summarises the cron system status:
- Green — OK: WP-Cron is running normally with no overdue events.
- Amber — Warning: one or more issues detected — overdue events or congestion zones.
- Blue — DISABLE_WP_CRON is set: pseudo-cron is disabled. This is the recommended state if you have a real server cron configured.
Real Server Cron Setup
For precise, clock-accurate job execution, disable WP-Cron and use a real server cron instead:
- Add this line to your server crontab (
crontab -e):
The crontab command is pre-filled with your site URL — click Copy to copy it.*/5 * * * * curl -s "https://yourdomain.com/wp-cron.php?doing_wp_cron" > /dev/null 2>&1 - Add this line to
wp-config.phpto stop WordPress from running pseudo-cron on page visits:define('DISABLE_WP_CRON', true);
This runs wp-cron.php every 5 minutes from a real OS-level scheduler — no visitor required, no page-load overhead.
24-Hour Job Timeline
A canvas chart plotting every scheduled WordPress cron job across the next 24 hours. The x-axis shows local clock time in your browser’s timezone, snapped to clock hours. The left edge is “Now”.
How to read it:
- Bars — each coloured bar represents one scheduled firing of a job. The bar’s horizontal position is when it fires; its width is proportional to estimated execution time (half the repeat interval, capped at 5 minutes, minimum 8 px). A wider bar means a longer-running job.
- Dashed spine — for recurring jobs, a dashed line connects the first and last bar, making it easy to see the repeat pattern at a glance.
- Red congestion bands — a red background highlight marks any 5-minute window where 3 or more jobs are scheduled to fire simultaneously. These windows can cause CPU and database spikes. See the Cron Congestion section below.
- Job labels — the left column shows each hook name as selectable HTML text. Below each hook name, a coloured dot and plugin name indicate which plugin owns the job and whether it is installed and active.
- Trash icon — click the bin icon next to any job to move it to the Cron Recycle Bin (see below). Nothing is permanently deleted immediately.
Plugin identification
Each job in both the timeline and the Cron Job Queue is matched against a built-in lookup table of 200+ WordPress plugins. The match uses the hook name prefix (e.g. jetpack_, wpseo, updraftplus_). The status badge next to each plugin name indicates:
- Blue — Core: a built-in WordPress function; always present.
- Green — Active: the plugin is installed and active. Detected by checking whether the hook has registered PHP callbacks at runtime — the most reliable signal possible.
- Orange — Installed: the plugin directory exists on disk but the plugin is not active. The job will fire but find no callbacks.
- Red — Not installed: the plugin directory does not exist and there are no callbacks. This is an orphaned cron entry — a job left behind by a deleted plugin. These fire on schedule, consume server resources, do nothing, and should be removed.
Cron Congestion
When 3 or more jobs fire within the same 5-minute window, they compete for CPU time, PHP memory, and database connections simultaneously. This can cause:
- Visible page slowdown for any visitors hitting the site during that window.
- PHP memory exhaustion on servers with a low
memory_limit. - MySQL connection timeouts when all connection slots are occupied.
The congestion warning box beneath the timeline lists each congested window with its local clock time and the names of the conflicting jobs. Consider staggering recurring jobs to different hours or disabling orphaned jobs that are contributing to congestion without doing any useful work.
Cron Job Queue
A complete table of every entry in the WordPress cron schedule — the authoritative source of what is registered, not just what fires in the next 24 hours. Columns:
- Hook — the internal action name WordPress calls when the job fires. This is selectable text — you can copy it to search for its definition in plugin code.
- Plugin — resolved plugin name with status badge (Core / Active / Installed / Not installed).
- Schedule — the recurrence label (e.g.
hourly,twicedaily,daily, orone-time). - Next Run — how long until the job fires next. Overdue means the job was due to run in the past but hasn’t fired yet — typically because no page visit triggered pseudo-cron at the scheduled time.
- Last Run — how long the job took the last time it ran, and how long ago that was. This data is collected by CloudScale Cleanup’s lightweight timing hooks which wrap each cron hook with before/after timestamps during real cron runs. Only appears after the job has fired at least once since the plugin was activated.
- Status — OK or Overdue.
- Trash icon — move the job to the Cron Recycle Bin.
Click Refresh to reload the table and timeline from the current cron state.
Manual Triggers
Fires a CSC scheduled job immediately without waiting for the next scheduled time:
- Run DB Cleanup Now — fires
csc_scheduled_db_cleanupusing the currently saved cleanup settings. - Run Media Cleanup Now — fires
csc_scheduled_img_cleanup.
Useful for testing that scheduled jobs work correctly before relying on the scheduler, or for forcing an immediate run after changing settings.
Cron Recycle Bin
When you click the trash icon on a job (in either the timeline or the Cron Job Queue), the job is removed from the WordPress cron schedule and placed in the Cron Recycle Bin. The original hook name, schedule, recurrence interval, and scheduled time are all preserved so the job can be fully restored.
Actions in the recycle bin:
- Restore — re-schedules the job in the WordPress cron queue. If the original scheduled time is in the past, the job is scheduled to run 30 seconds from now to avoid an immediate overdue state.
- Delete Forever — permanently removes the entry from the recycle bin. This cannot be undone.
The recycle bin persists across page loads and is stored in wp_options. It holds up to 200 entries.
Plugin statistics
The About card at the top of the Cron tab shows lifetime activity statistics:
- Last DB Cleanup — date and time of the most recent database cleanup run (manual or scheduled).
- Last Media Cleanup — most recent media library cleanup run.
- Last Optimisation — most recent image optimisation run.
- PNG Conversions — total number of PNG files converted to JPEG since the plugin was installed.
- Version — currently installed plugin version.