Category: Internet
SEO and AEO Page Audit Script: A Technical Guide
Search engines no longer operate alone. Your content is now consumed byGoogle, Bing, Perplexity, ChatGPT, Claude, Gemini, and dozens of otherAI driven systems that crawl the web and extract answers. Classic SEO focuses on ranking. Modern discovery also requires AEO (Answer Engine Optimization) which focuses on being understood and extracted by AI systems. A marketing […]
Read more →
Capitec Pulse: The Engineering Behind Real-Time AI at Scale
By Andrew Baker, Chief Information Officer, Capitec Bank The Engineering Behind Capitec Pulse 1. Introduction I have had lots of questions about how we are “reading our clients minds”. This is a great question, but the answer is quite complex – so I decided to blog it. The article below really focuses on the heavy […]
Read more →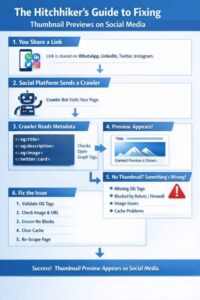
Fix Thumbnail Previews on WhatsApp, LinkedIn & X (Guide)
When you share a link on WhatsApp, LinkedIn, X, or Instagram and nothing appears except a bare URL, it feels broken in a way that is surprisingly hard to diagnose. The page loads fine in a browser, the image exists, the og:image tag is there, yet the preview is blank. This post gives you a […]
Read more →How to Find Who Mentions You Online Using Google
If you publish online, you should periodically search for yourself, not out of ego but out of discipline. The internet is an echo system, and if you do not measure where your ideas travel, you are operating blind. You want to know who is linking to you, who is quoting you, who is criticising you, […]
Read more →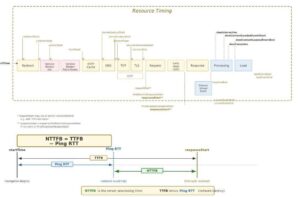
NTTFB: Net Time to First Byte Explained and Why It Matters
Andrew Baker · February 2026 · andrewbaker.ninja 1 The Problem with TTFB Time to First Byte has been the go to diagnostic for server responsiveness since the early days of web performance engineering. Google’s own web.dev guidance describes TTFB as measuring the elapsed time between the start of navigation and when the first byte of […]
Read more →
XZ Utils Backdoor: How One Engineer Saved the Internet
On a quiet Friday evening in late March 2024, a Microsoft engineer named Andres Freund was running some routine benchmarks on his Debian development box when he noticed something strange. SSH logins were taking about 500 milliseconds longer than they should have. Failed login attempts from automated bots were chewing through an unusual amount of […]
Read more →Fix FOIT with font-display: swap to Boost Core Web Vitals
Stop Waiting for Fonts Quick Guide to font-display: swap on macOS Your website might be secretly blocking page renders while it waits for fancy custom fonts to load. This invisible delay tanks your Core Web Vitals and frustrates users. The fix is simple: font-display: swap. Here’s how to audit your sites and fix it in […]
Read more →What Is Minification and How to Test If It Works
1. What is Minification Minification is the process of removing everything from source code that a browser does not need to execute it. This includes whitespace, line breaks, comments, and long variable names. The resulting file is functionally identical to the original but significantly smaller. A CSS file written for human readability might look like […]
Read more →Fix Render-Blocking JavaScript in WordPress: 3-Step Guide
If you’ve run your site through Google PageSpeed Insights and seen the “Eliminate render-blocking resources” warning, you’ve probably wondered why something that sounds so simple is so hard to actually fix. The answer is that WordPress makes it surprisingly easy to load JavaScript the wrong way — and surprisingly difficult to fix it without either […]
Read more →
CloudScale SEO AI Optimiser: Free WordPress SEO Plugin
Written by Andrew Baker | February 2026 Download the plugin here: https://wordpress.org/plugins/cloudscale-seo-ai-optimizer/ S3 download (updated frequently): https://andrewninjawordpress.s3.af-south-1.amazonaws.com/cloudscale-seo-ai-optimizer.zip I spent years working across major financial institutions watching vendors charge eye-watering licence fees for tools that were, frankly, not that impressive. That instinct never left me. So when I wanted serious SEO for my personal tech blog, I […]
Read more →