Colima vs Rancher Desktop on a MacBook: Measured, and the Gaps Filled

Colima is the lighter choice on a MacBook. Measured on the same M5 Mac, it installs at 146 MB against 1.5 GB, stops in under 3 seconds against 35, and idles on about half the memory. Image builds and file access performed about the same, so the difference comes from size and overhead.
Colima vs Rancher Desktop on a MacBook: Measured, and the Gaps FilledAndrew Baker's Technology Blog Posts, 17/Nov/2026
https://andrewbaker.ninja/2026/11/17/colima-vs-rancher-desktop-on-a-macbook-measured-and-the-gaps-filled/

I ran Rancher Desktop on my MacBook for a long time, and it did the job: Docker, Kubernetes and a window with buttons. Then I looked at what it was costing me. A 1.5 GB app, a Kubernetes cluster I never asked for starting every morning, a stop button that takes over half a minute, and, when I finally went looking, 59 GB of old virtual machine disks sitting in my Library folder. So I replaced it with Colima, which is free, open source and far lighter.
Colima has one real weakness: it is command line only. There is no window, no list of containers, no button for the things that go wrong. So I built one, Colima Dashboard, and then measured both setups properly on the same Mac rather than trusting anyone’s opinion, including mine. This post starts with a quick tour of the dashboard, then the numbers, the gaps you fall into when you switch, and how the dashboard fills them.
1. Install It in One Paste
Open Terminal, paste this, and press Return. It installs Colima and the Docker command line tools with Homebrew, downloads Colima Dashboard (checking its checksum), sets it to start when you log in, and opens it in your browser.
curl -fsSL https://raw.githubusercontent.com/andrewbakercloudscale/colima-dashboard/main/install.sh | bashThen press Start on the General page. The first start downloads a small Linux image and takes a minute or two; after that it is quick. Everything is on GitHub under the Apache 2.0 licence.
2. A Quick Tour: Your First Ten Minutes
Before the numbers, here is what you actually get. Every screenshot below is the dashboard running on my Mac against a small demo shop: a web server, an API, Redis, MariaDB and a busy background worker in one Compose project, with three test suites, a load test and image builds running on a loop. Nothing is mocked up.
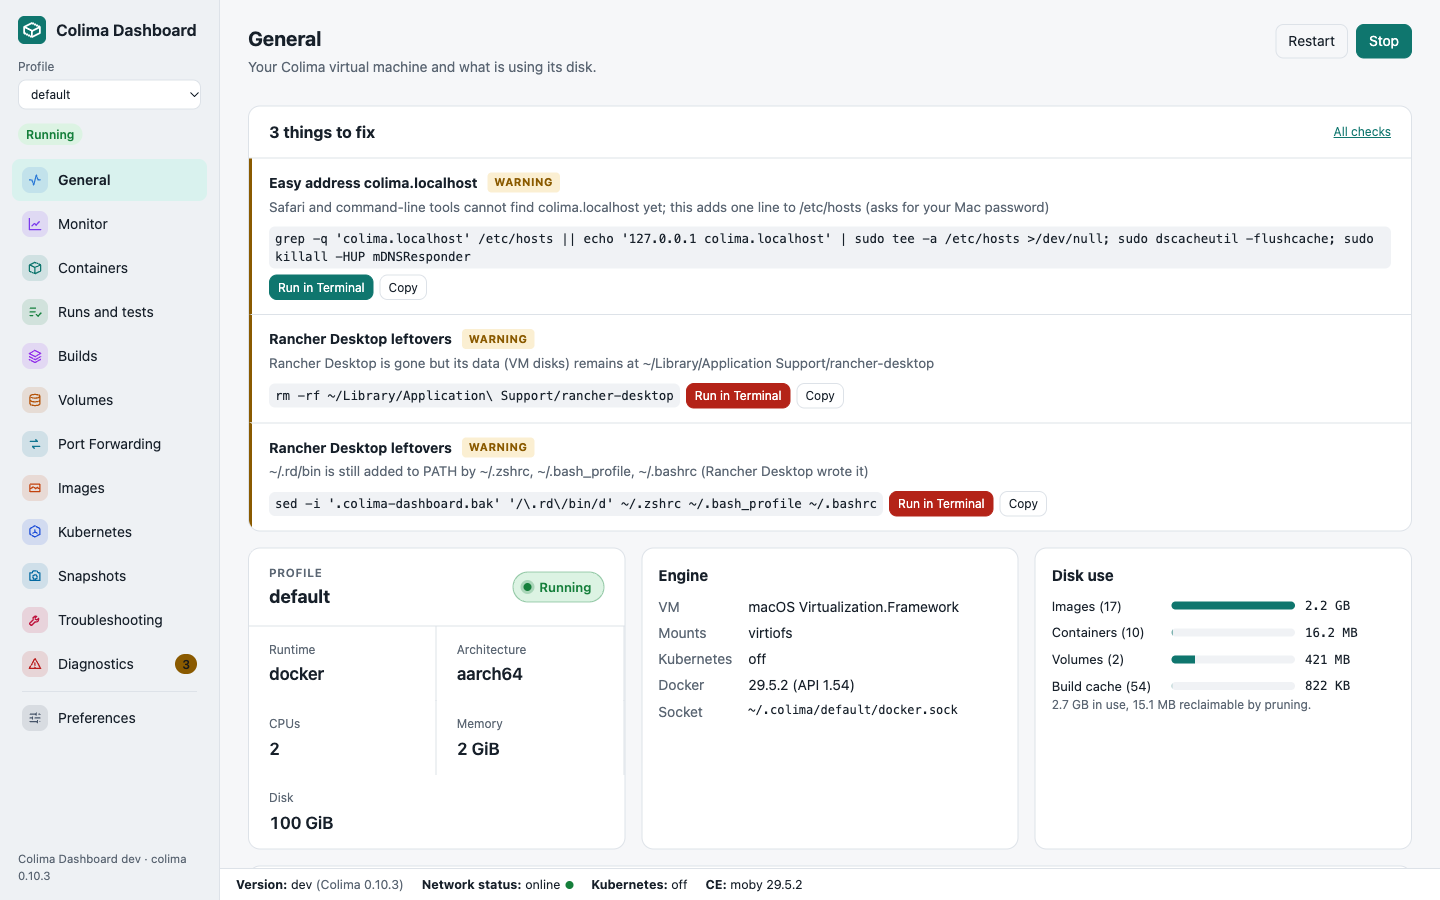
Step 1: Start Colima from the General page
The first page shows your profile as a card: its state, CPUs, memory, disk, runtime and VM type, with Start, Stop and Restart. Underneath sits a short list of things to fix, and any updates for Colima or the dashboard. Press Start and the card goes green in about 11 seconds.
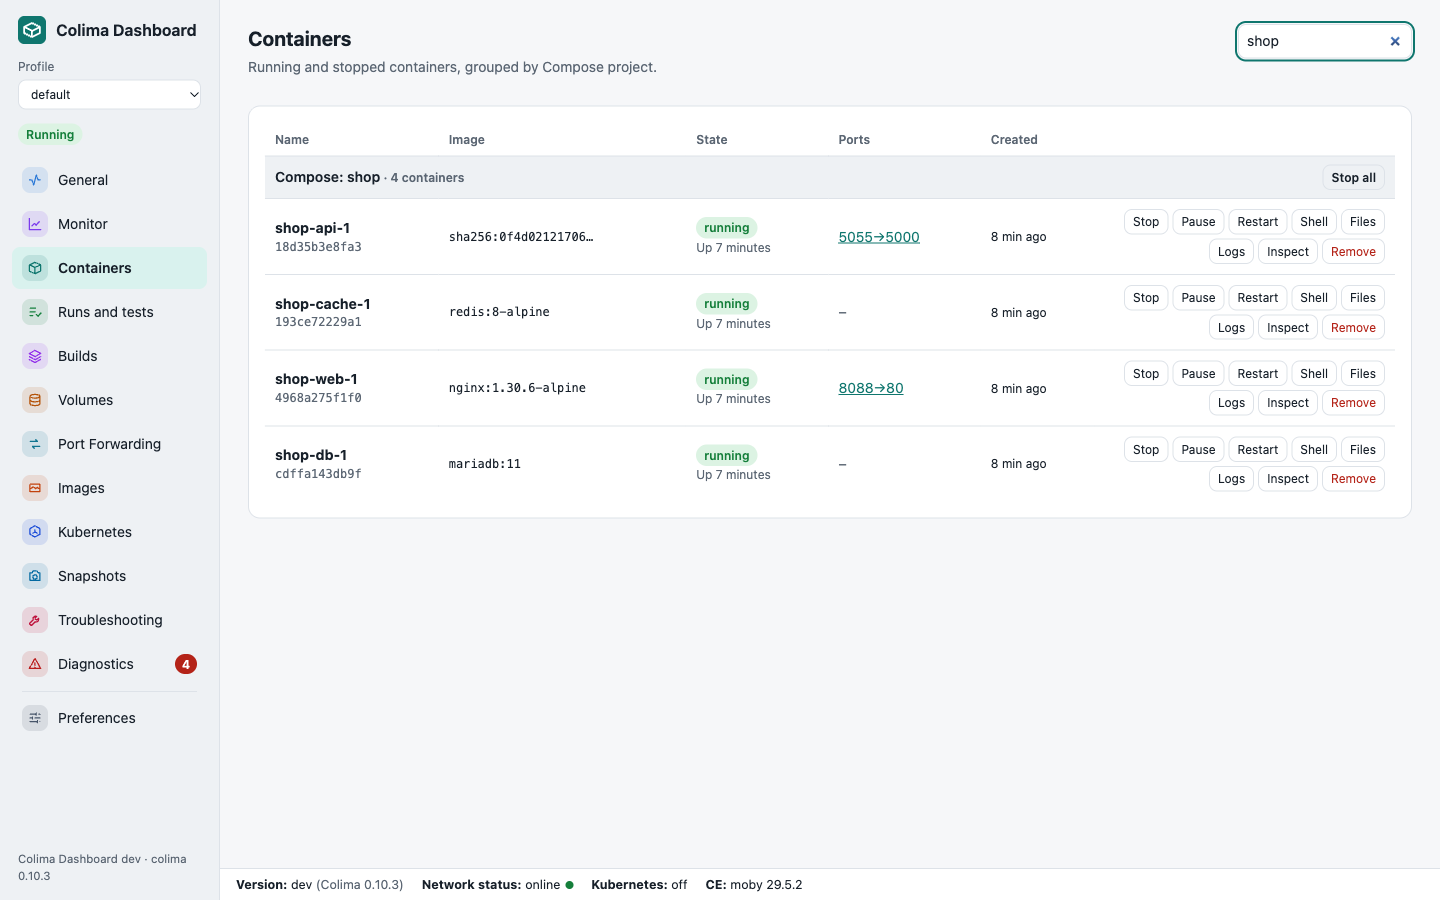
Step 2: Run your stack and see it in Containers
Run docker compose up as usual. Containers groups each Compose project together, shows ports as clickable links, and gives every container Start, Stop, Restart, Logs, Inspect, Shell, Files and Remove. The search box filters as you type.
Step 3: Watch what the VM is doing on Monitor
This is the page I open most. The top band answers “is my VM busy?” in one glance: CPU and memory gauges with plain English verdicts, averages over 1 minute, 15 minutes and an hour, what the VM costs your actual Mac in cores and gigabytes, network and disk rates, and how many containers are running.
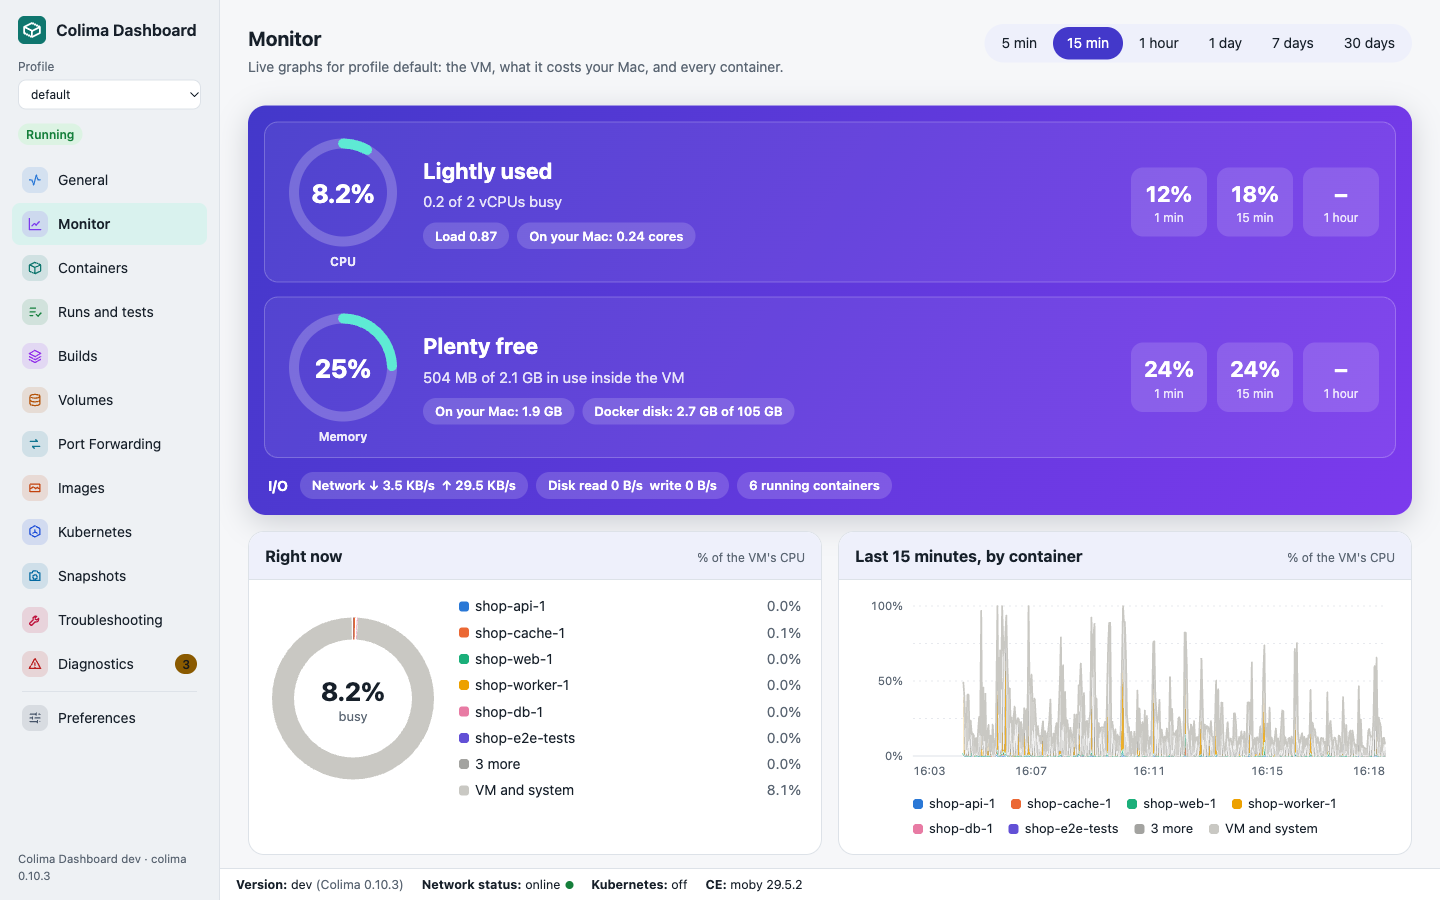
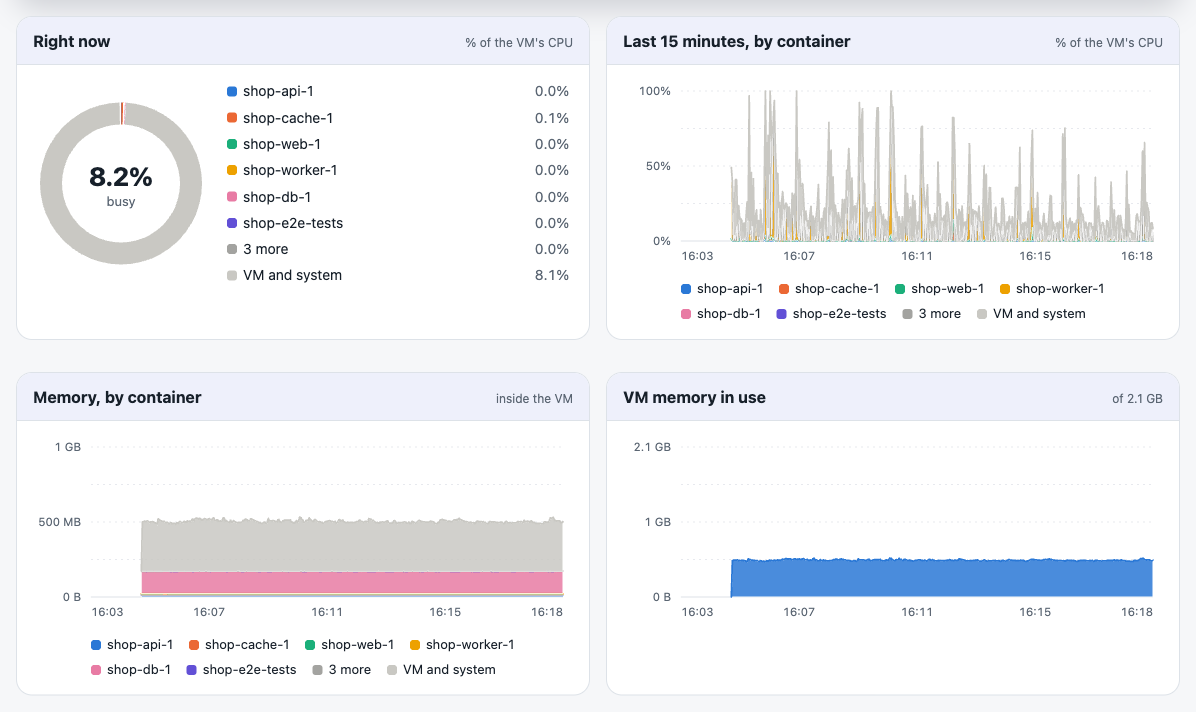
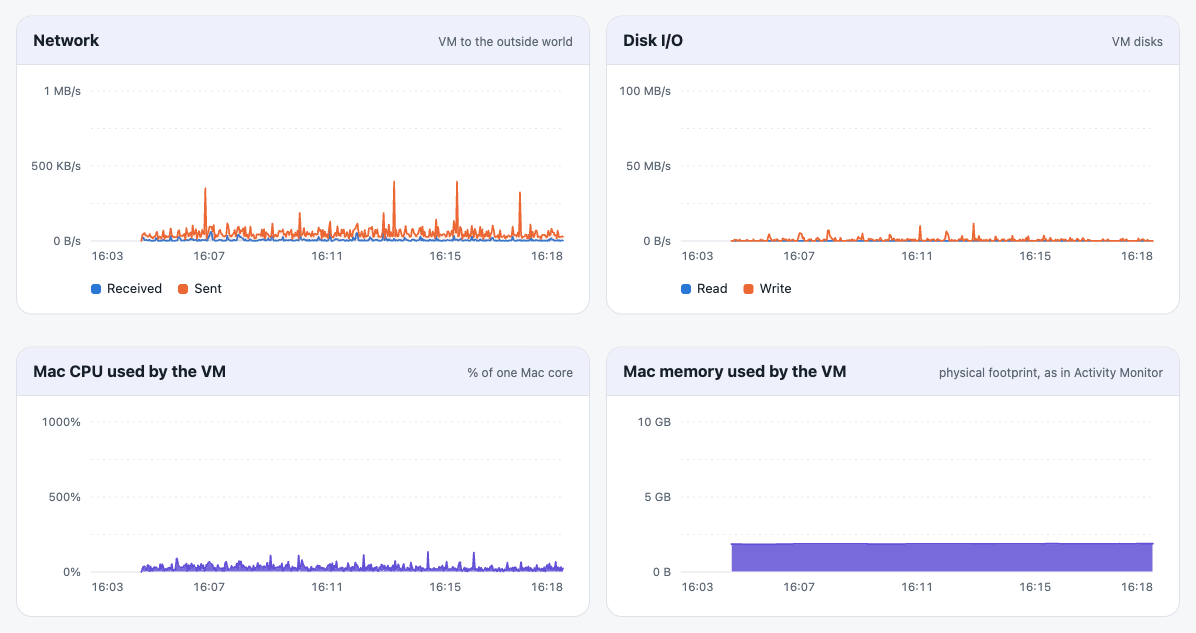
Below it, every graph splits the load by container, so the noisy one is obvious. The donut is right now; the stacked charts are the last 5 minutes to an hour. Test runs started with docker compose run are folded into their service rather than cluttering the legend with a new name per run. Hover any chart for exact values.
Step 4: Drill into one container
Inspect on any container opens a drawer with live sparklines for CPU, memory, network and disk, updated every 2 seconds, plus its running processes, its full configuration and its environment.
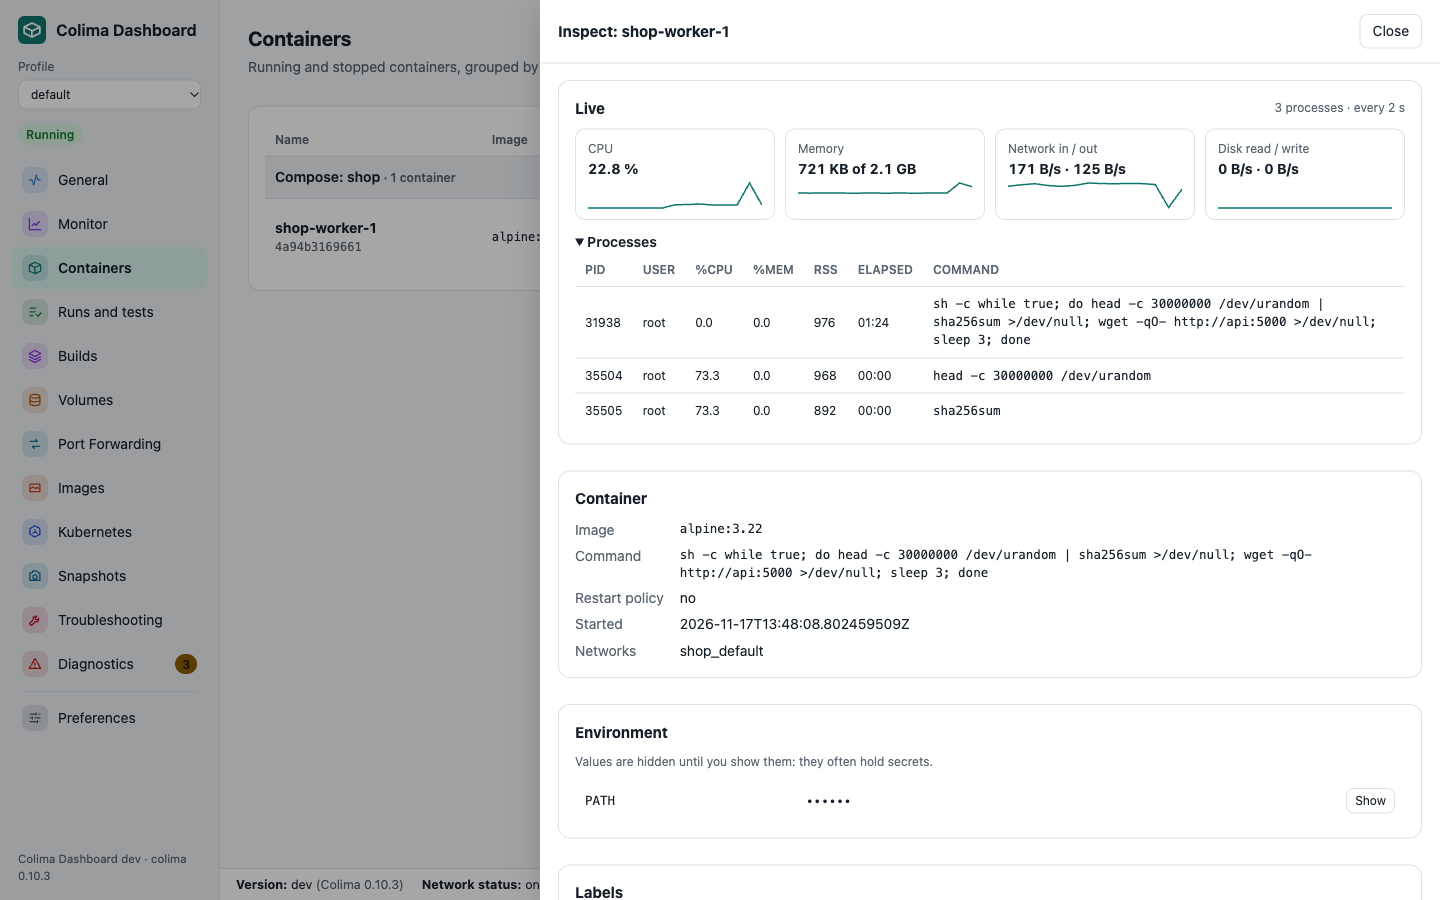
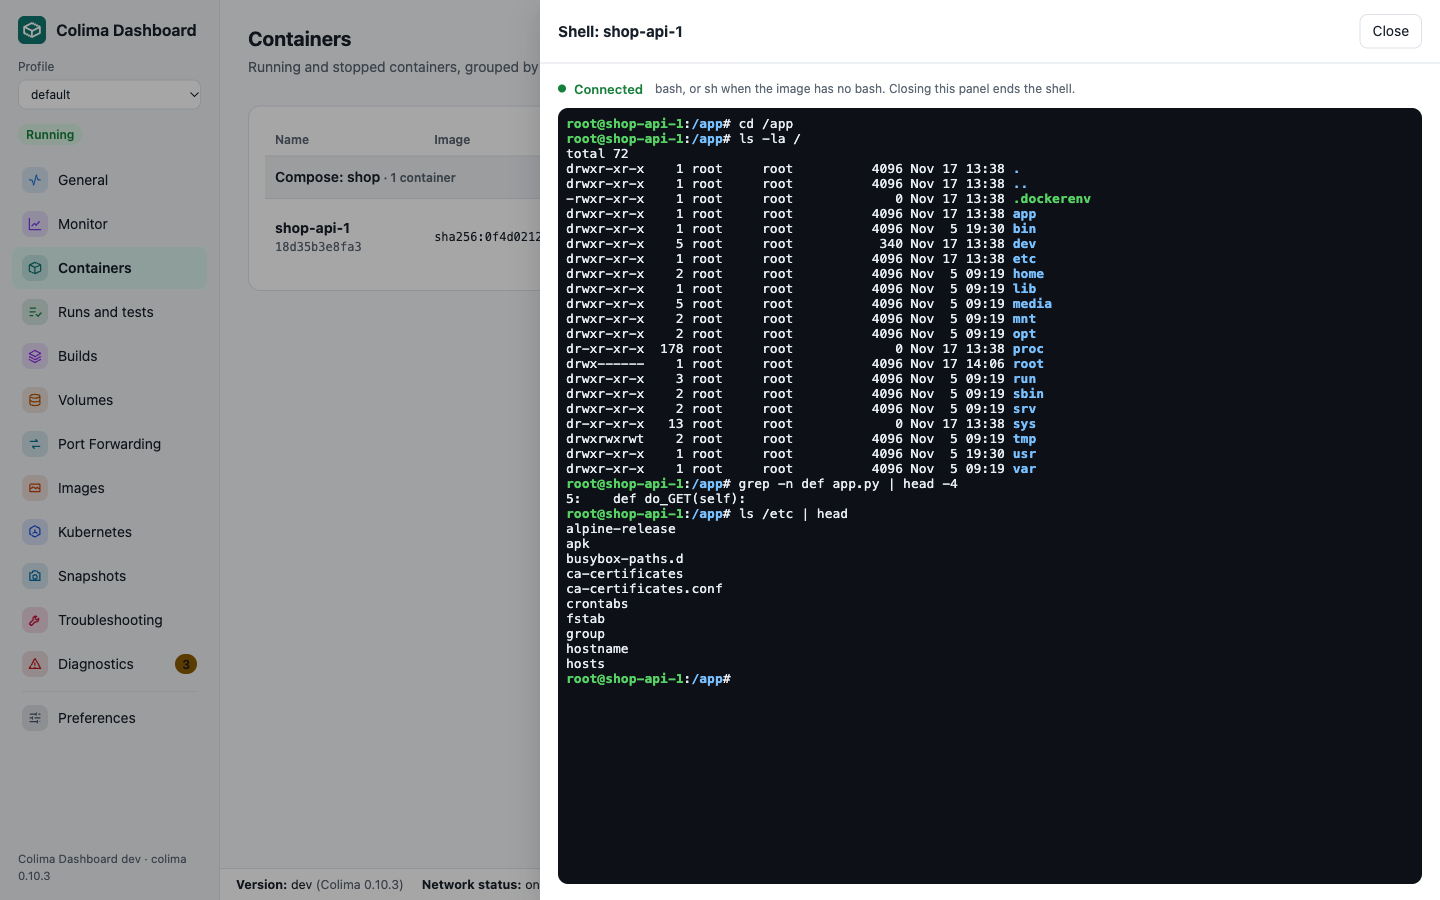
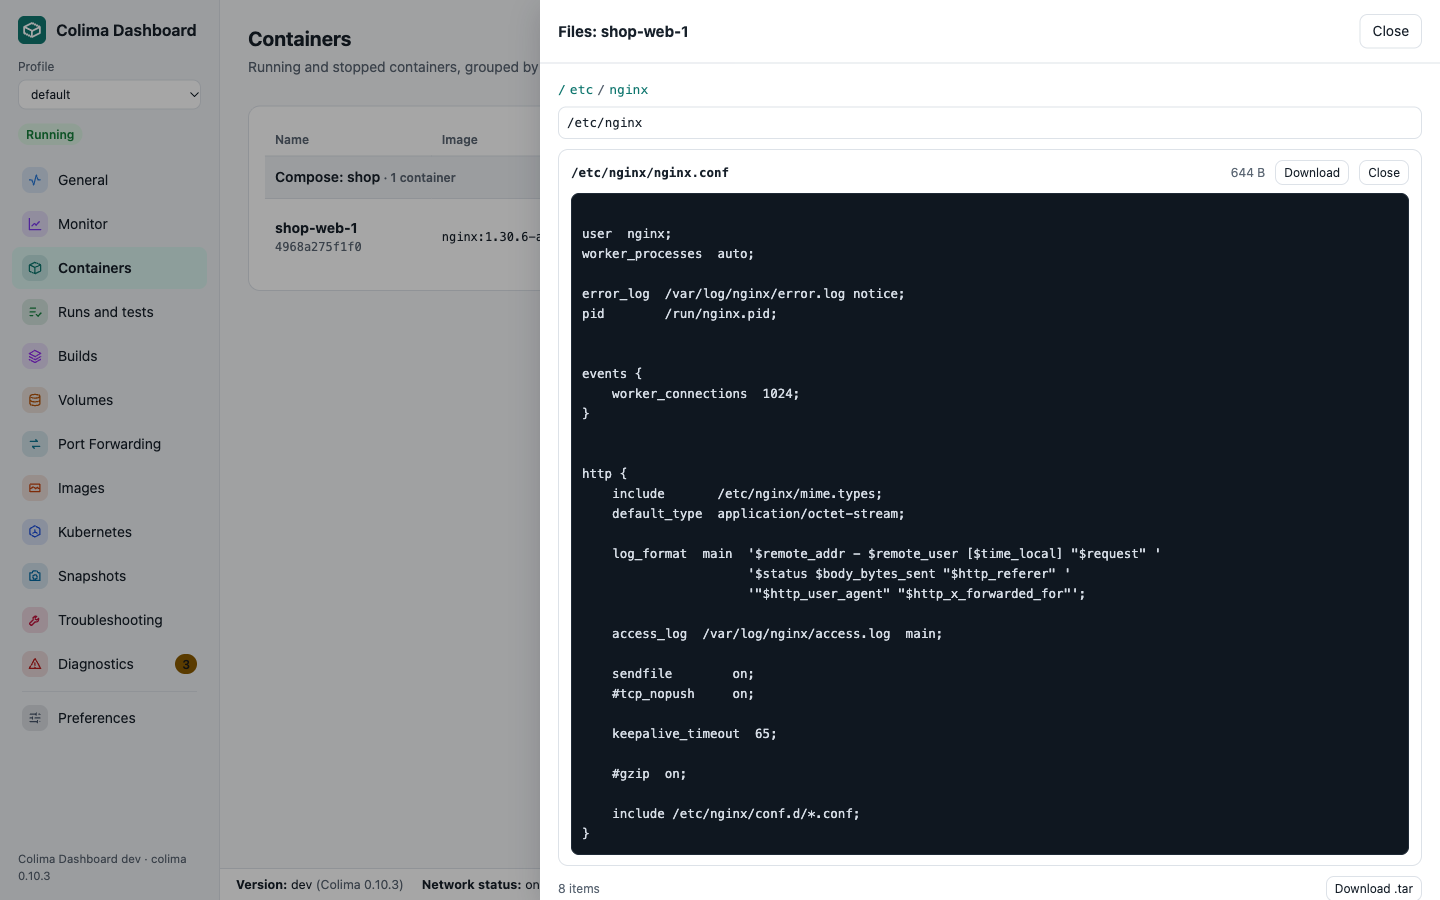
Shell opens a real terminal inside the container, in the page, with colours and resizing. Files browses its file system: open a text file to read it, or download a file or a whole folder as a tar. Volumes can be browsed the same way, even when no container is using them.
Step 5: See how your tests are doing
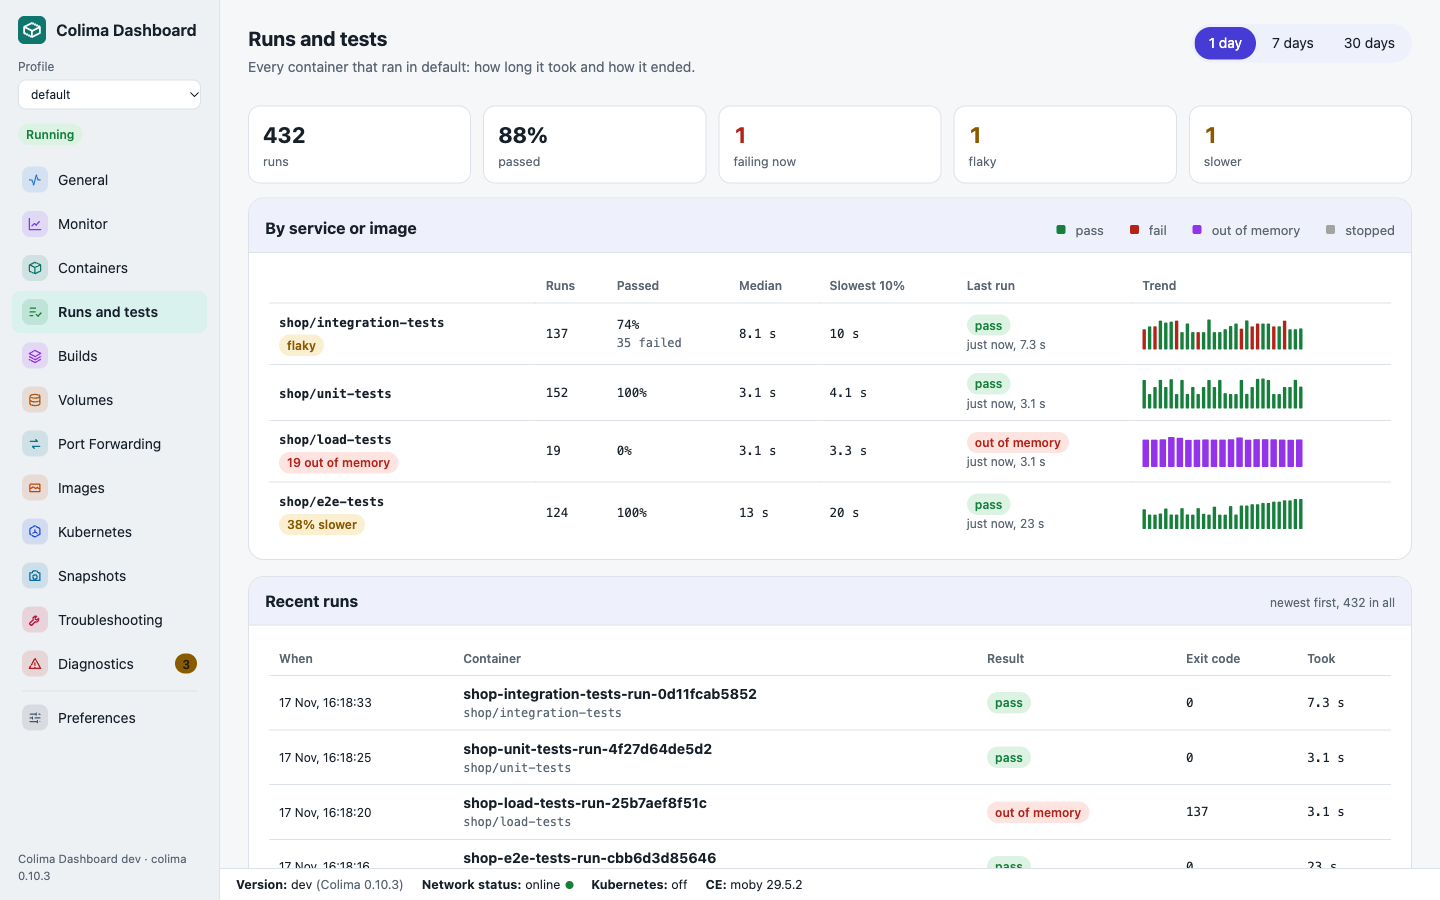
Every container that runs and exits is recorded, so test suites run in containers get a history for free, with nothing to install in your project. Runs and tests shows the pass rate, median and slowest 10% for each service, a trend bar per run, and flags for flaky tests (passing and failing on the same code), tests getting slower, and anything killed for running out of memory. In the demo, the integration suite fails about one run in four and is flagged flaky; the load test hits its 24 MB limit and is flagged out of memory.
Step 6: Keep an eye on your builds
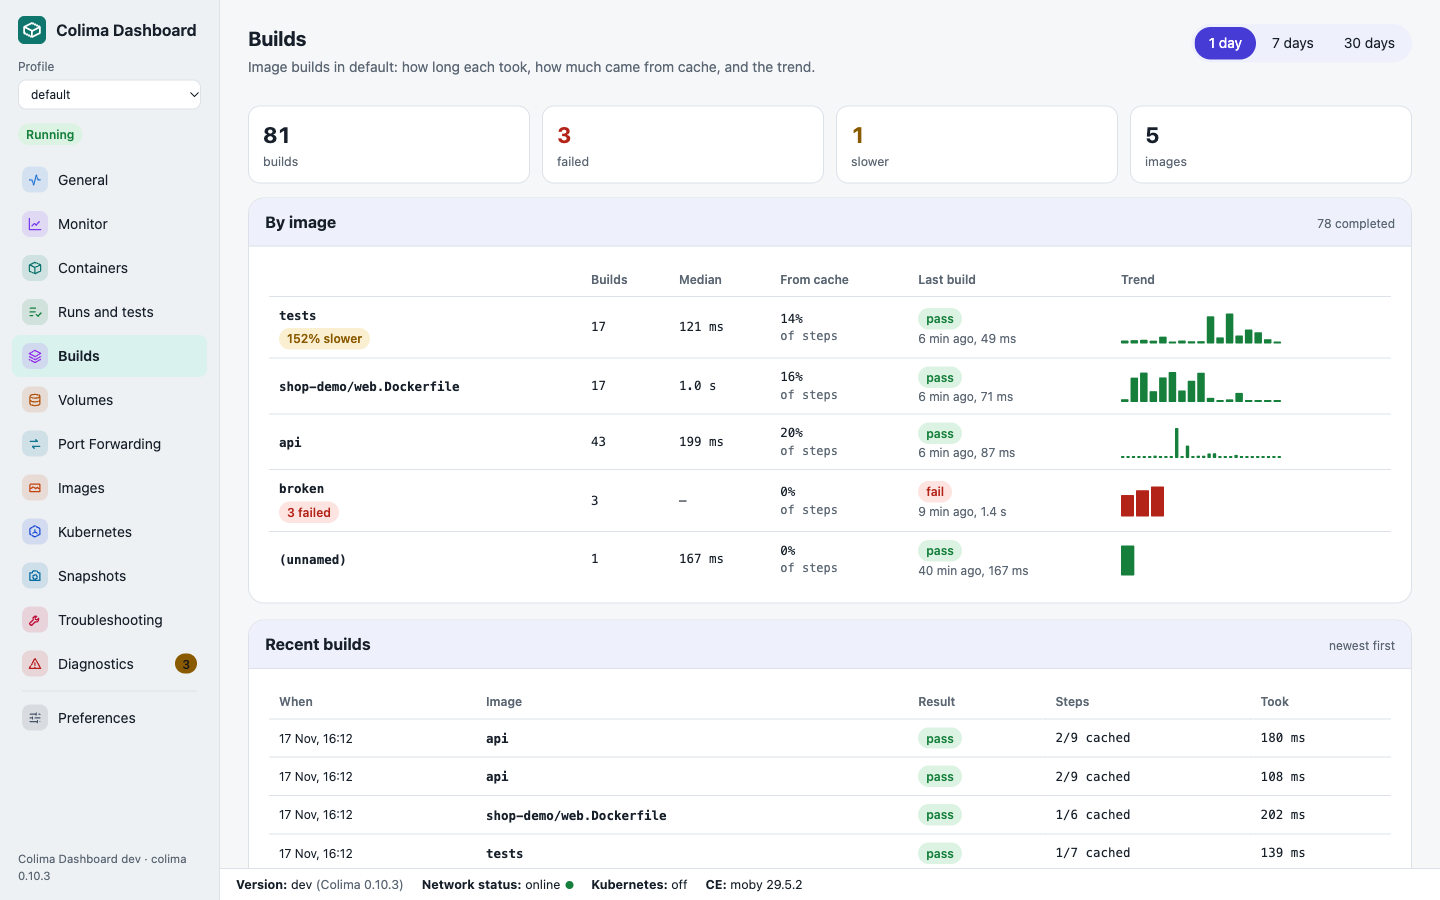
Builds reads BuildKit’s own history: every image build, how long it took, how many steps came from cache, and, when one fails, the step and the error, without digging through terminal scrollback. Each image gets a trend, and a build that has become noticeably slower than its usual is flagged.
Step 7: Look back over days, not minutes
Monitor also keeps 30 days of history on your Mac: the Mac CPU and memory the VM used, its disk on your Mac, Docker’s disk use and the number of running containers, and, once it has a day of history, a forecast of when the VM disk fills up. Switch between 1 day, 7 days and 30 days at the top. It samples every 5 minutes while the dashboard runs, with the page open or not, and nothing leaves your Mac.
Step 8: When something goes wrong, press Fix
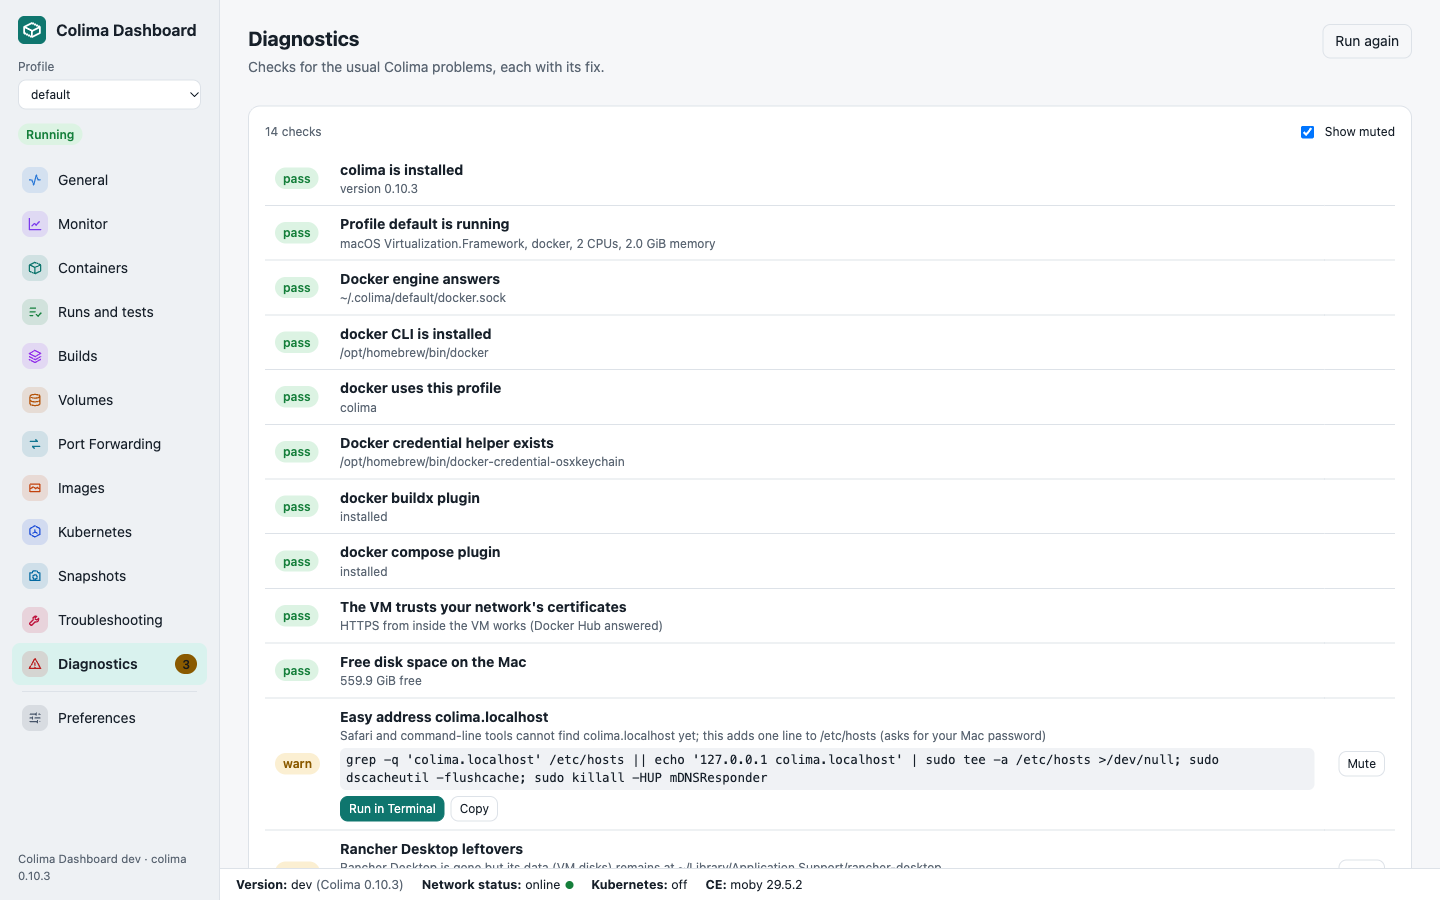
Diagnostics runs 14 checks, from the Docker context and the credential helper to stale Rancher Desktop files and company proxy certificates. Each problem has a Fix button that opens Terminal with the exact command, so you can see what it does before it runs. The sidebar badge counts open problems, and failing tests, builds and out of memory kills also arrive as macOS notifications and in the optional menu bar icon.
Step 9: Kubernetes and snapshots, when you need them
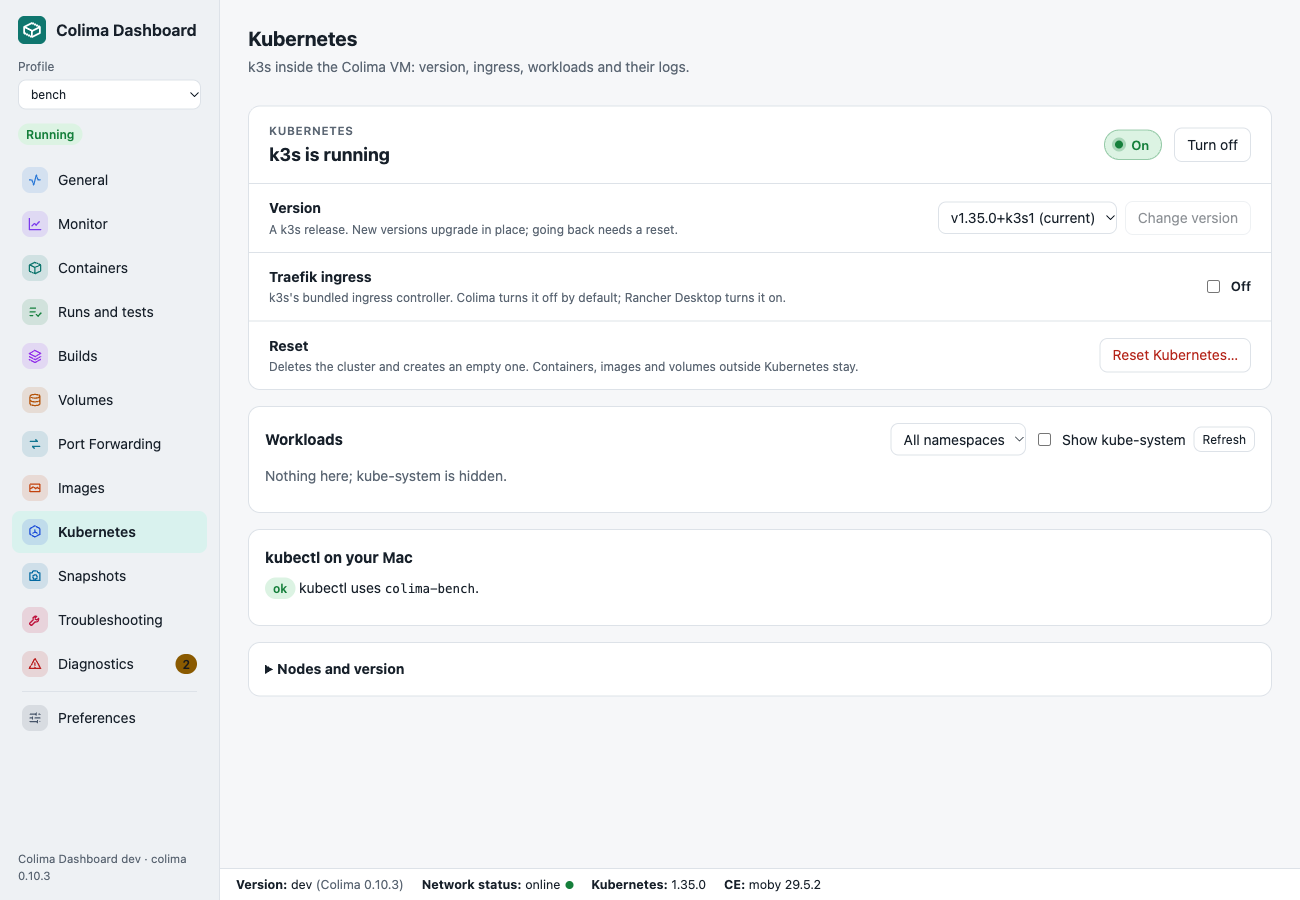
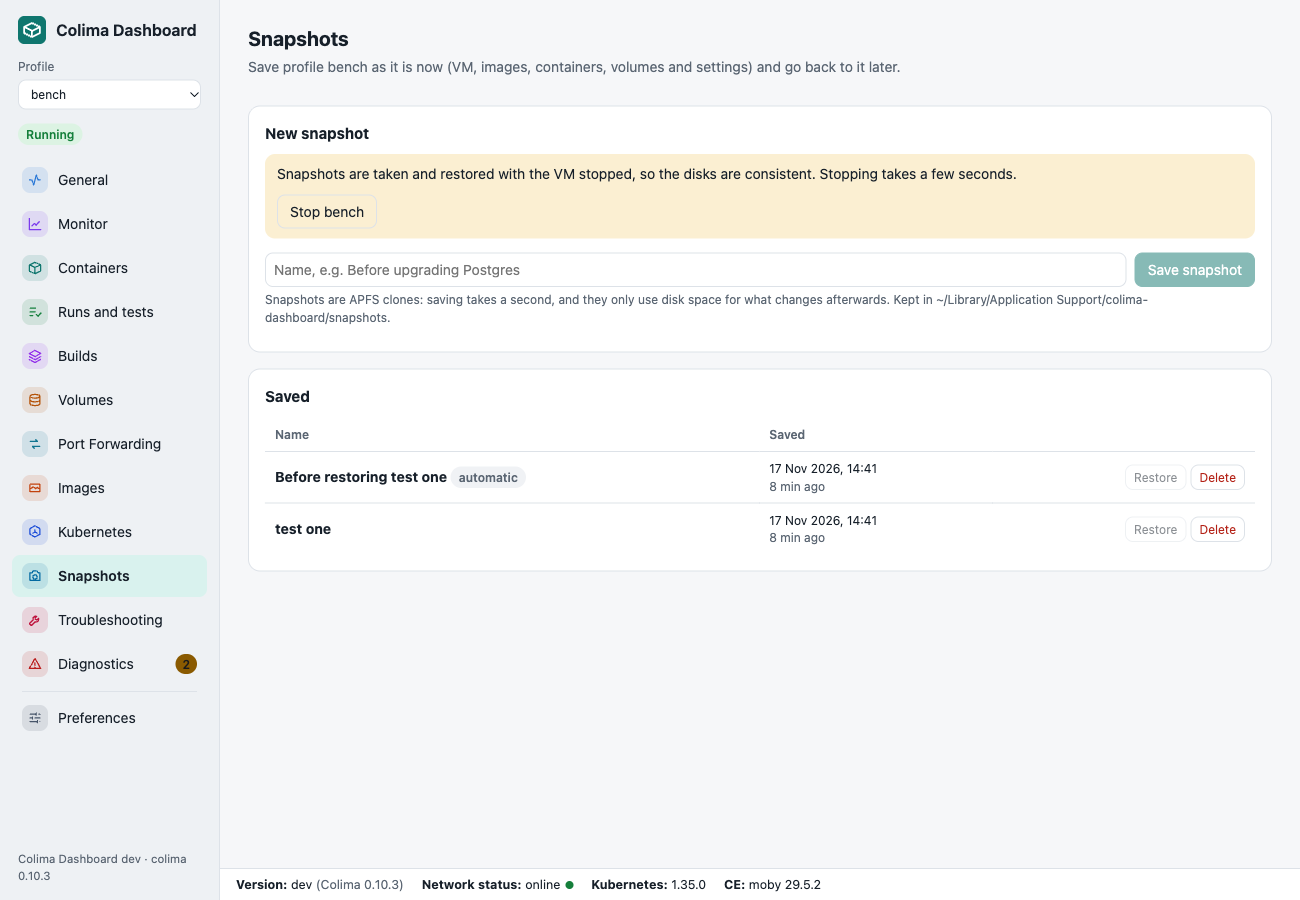
Kubernetes is off until you want it. Then one switch turns on k3s, a picker chooses the version, and the page lists your workloads with their logs. Snapshots save a stopped profile in about a second as an APFS clone, so you can try something risky and roll back.
3. Why I Moved Off Rancher Desktop
None of these is a bug. Each is a reasonable choice for a product that tries to be everything for everyone. Together they add up to a lot of machine for someone who mostly runs docker compose up.
- Size. The download is 671 MB and the app is 1.5 GB on disk, before it creates a single virtual machine. It bundles its own copies of Lima, the Docker CLI, kubectl, helm, nerdctl and more.
- Kubernetes on by default. A fresh install starts a k3s cluster. On my Mac the first start took 200 seconds before
docker run hello-worldworked, most of it Kubernetes. - A big virtual machine. On my 32 GB Mac it picked 2 CPUs and 6 GB of memory for itself. Colima starts with 2 CPUs and 2 GB.
- Slow to stop. Stopping took about 35 seconds, every single run.
- It leaves things behind. Uninstalling the app left 59 GB of VM disks in
~/Library/Application Support/rancher-desktop, a~/.rd/binline in two of my shell profiles, and its settings, which quietly came back when I reinstalled it.
4. How I Measured
Same Mac, same day, one tool running at a time with the other fully stopped. The scripts and every raw CSV are in the repo under bench/, so you can run them on your own machine.
| Mac | MacBook with Apple M5, 10 cores, 32 GB, macOS 27.2 |
| Rancher Desktop | 1.25.0, VZ virtual machine, Docker (moby) engine |
| Colima | 0.10.3, VZ virtual machine, virtiofs mounts, Docker engine |
| Timed tests | 5 runs each, median reported |
| Idle | 5 minutes to settle, then a sample every 5 seconds for 10 minutes |
I tested three setups, because a comparison of defaults alone flatters whichever tool picks the smaller VM:
- Out of the box: each tool exactly as installed. This is what a new user gets.
- Matched: both at 4 CPUs and 8 GB, Kubernetes off. This shows the cost of the tool itself rather than the size of its VM.
- Matched with Kubernetes: as above with k3s on in both, since Kubernetes is Rancher Desktop’s headline feature.
One honest caveat: this is my working Mac, with other work running in the background. I recorded the load average with every sample and reran anything that looked disturbed, but the numbers are real world rather than laboratory.
5. The Numbers
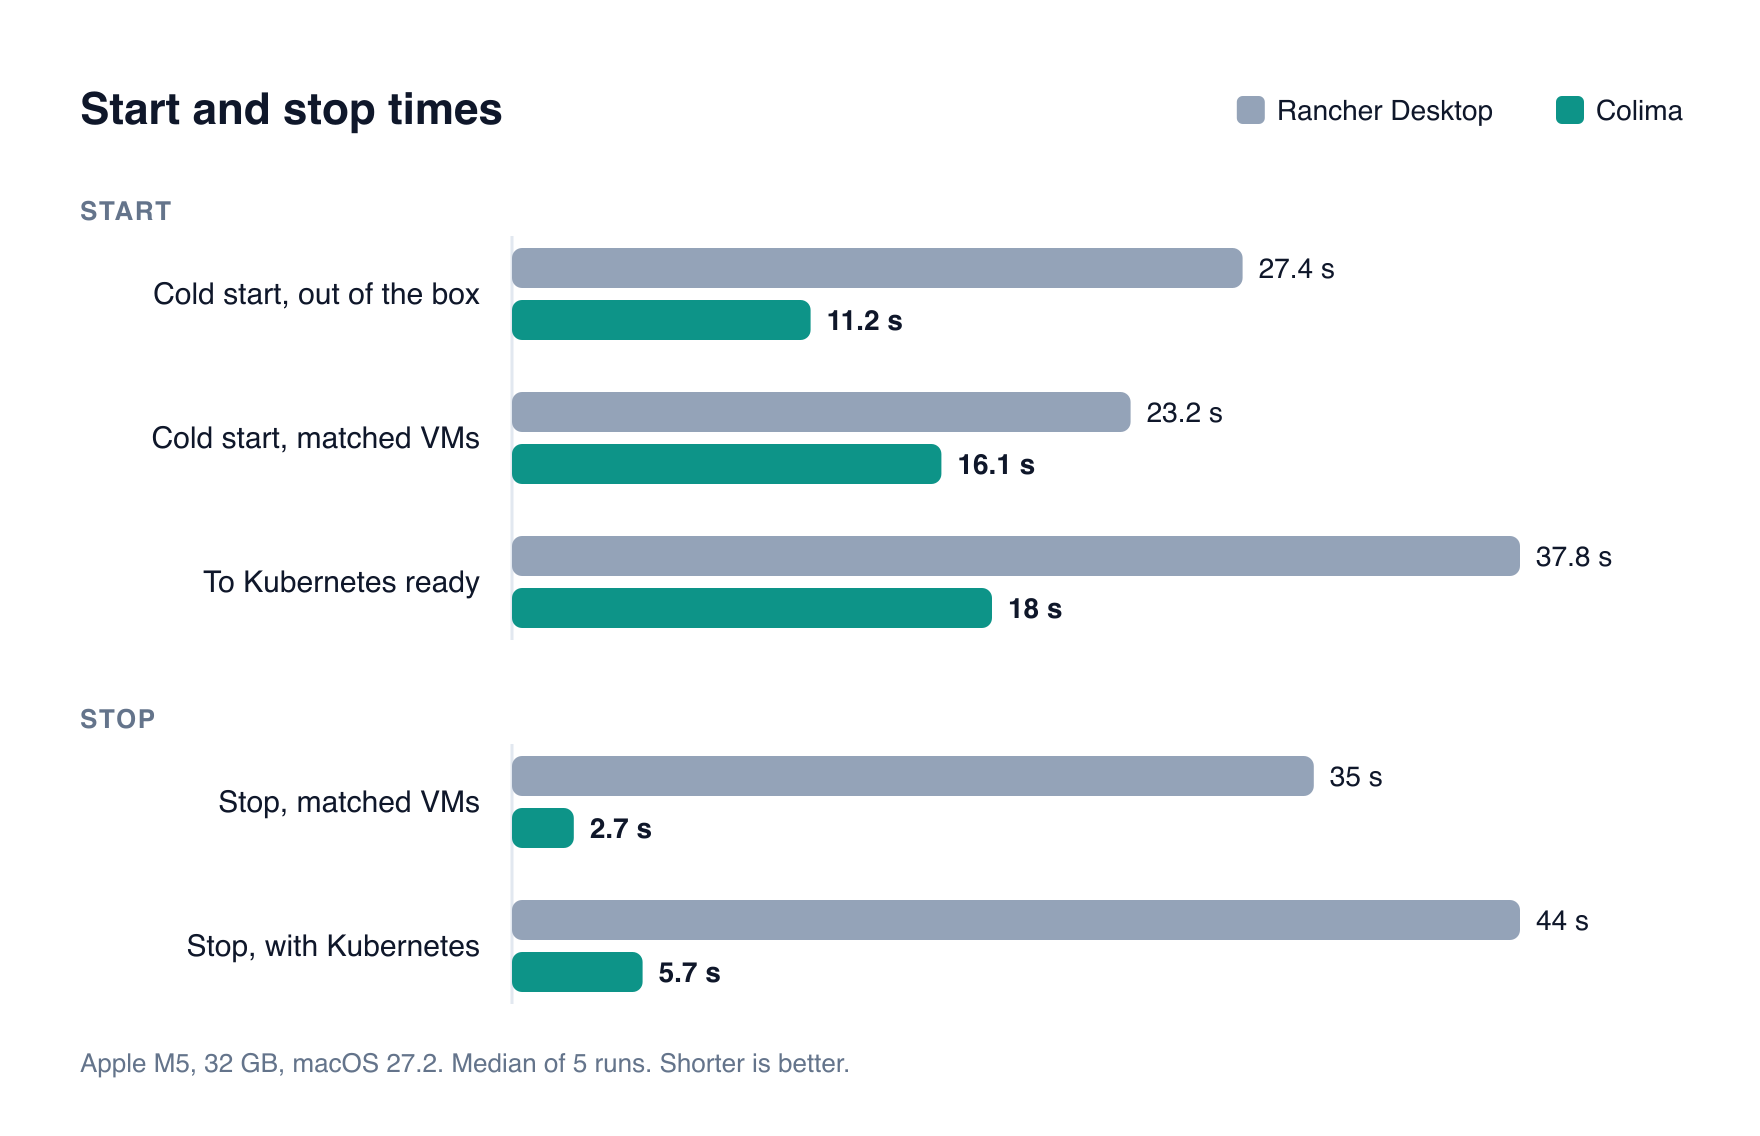
Colima wins on everything that comes from being small: starting, stopping, sitting idle and taking up disk. On the work itself, builds and file access, the two are close enough that the background noise on my Mac decides it. Here is the full table, every figure a median of five runs or a ten minute idle average.
| Measure | Rancher Desktop | Colima |
|---|---|---|
| Installed size | 1.5 GB app (671 MB download) | 146 MB (Colima, Lima, Docker CLI) |
| First ever start, out of the box | 200 s (Kubernetes on) | 40 s |
| Cold start, out of the box | 27.4 s | 11.2 s |
| Cold start, matched VMs | 23.2 s | 16.1 s |
| Cold start to Kubernetes ready | 37.8 s | 18 s |
| Stop, matched VMs | 35 s | 2.7 s |
| Stop, with Kubernetes | 44 s | 5.7 s |
docker run hello-world, warm | 0.39 s | 0.19 s |
| Idle memory, matched VMs | 2.2 GB | 1.3 GB |
| Idle memory, with Kubernetes | 5.4 GB | 2.1 GB |
| Idle CPU, matched VMs (one core = 100%) | 1.6% | 0.4% |
| Idle CPU, with Kubernetes | 38% | 13% |
| Image build, cold cache | 8.2 s | 7.9 s |
| Bind mount file work (create, read, tar, delete) | 34.9 s | 29.4 s |
| Left behind after uninstall | 4.9 GB after one day, 59 GB after months, plus PATH lines in 3 shell profiles | ~/.colima, removed by colima delete |
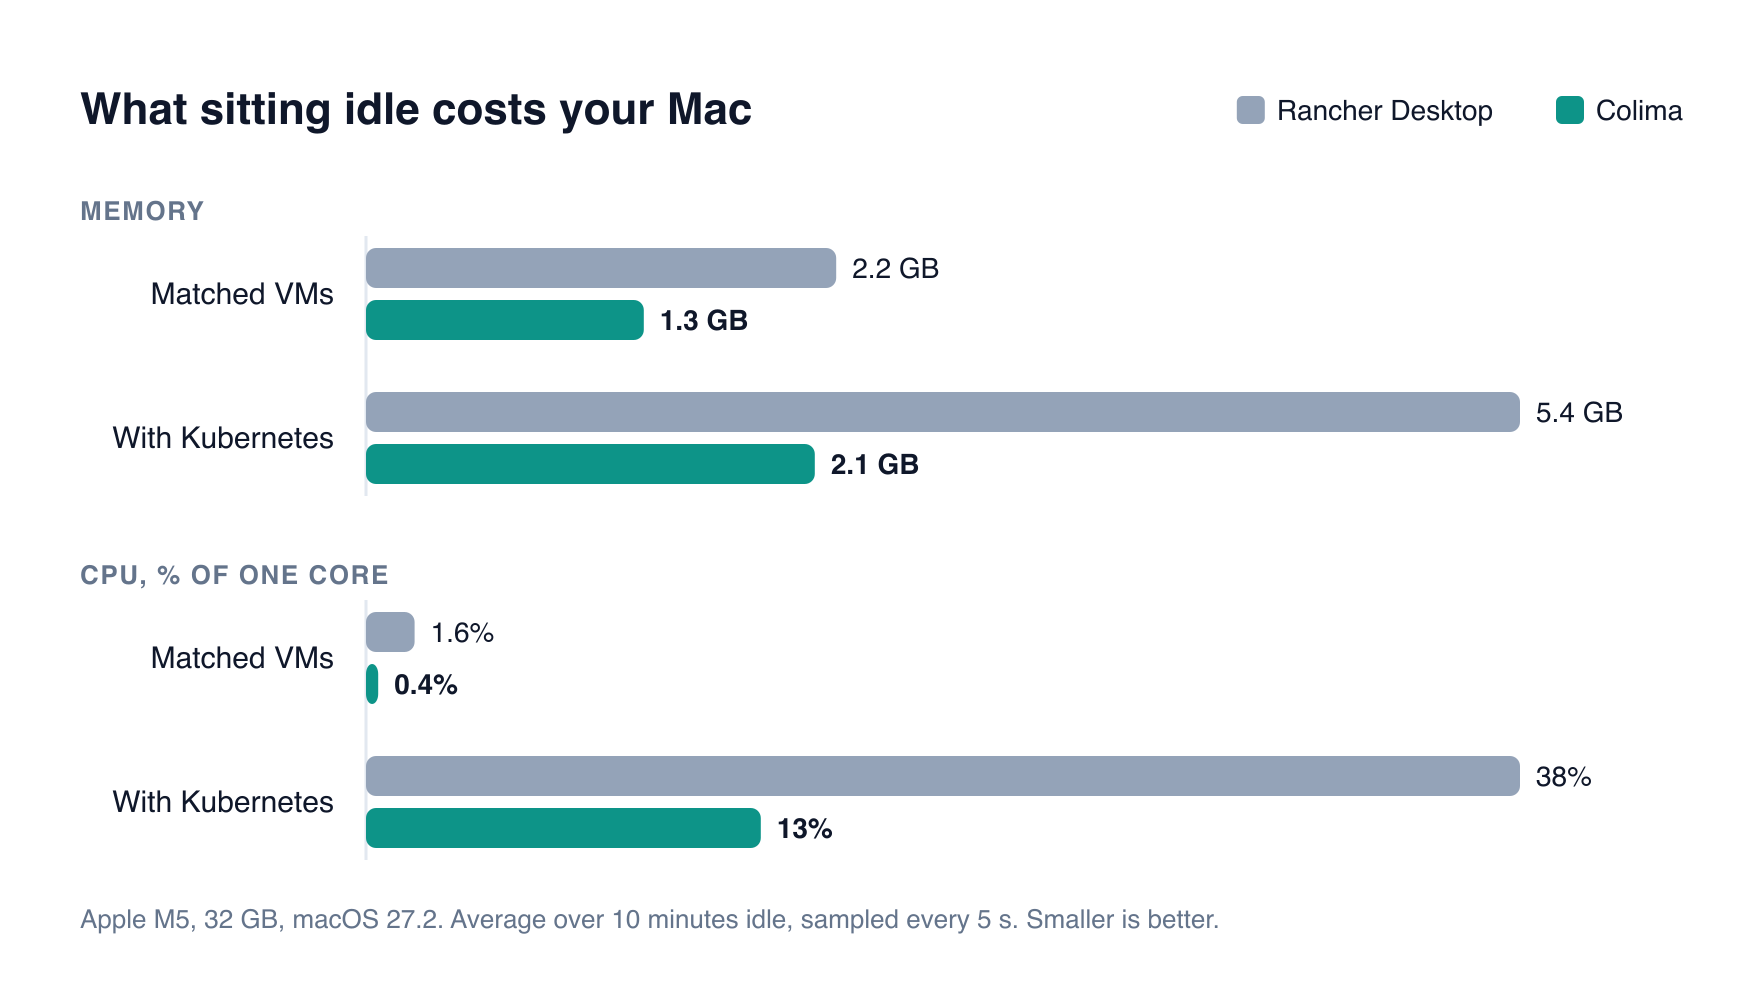
A few things stand out.
- Stopping is where the gap is widest. Rancher Desktop took 35 seconds to stop every single time, and 44 with Kubernetes. Colima took under 3. If you stop your VM at the end of the day, or to get battery back, you feel this every time.
- Kubernetes is expensive at idle in both, but much more so in Rancher Desktop. With nothing deployed, Rancher Desktop’s k3s used 38% of a core and 5.4 GB on my Mac, all day. Colima’s used 13% and 2.1 GB. Without Kubernetes, both are close to free.
- Builds and file access are a draw. Both run Docker in a Linux VM on Apple’s Virtualization framework with virtiofs mounts, so the work inside runs at the same speed. One Rancher set of runs came out twice as slow, but my Mac was busy at the time (load average 14), so I have not counted it; the runs at similar load were within a few percent.
- The first start is the outlier. A fresh Rancher Desktop took over three minutes before
hello-worldworked, because it downloads and starts Kubernetes first. Colima took 40 seconds.
Verdict: for a developer on a Mac who wants Docker, and sometimes Kubernetes, Colima does the same work in about half the memory, starts twice as fast, stops ten times faster and leaves almost nothing behind. What it lacked was a window. That is the part I built.
6. What You Lose When You Leave Rancher Desktop
Switching is mostly painless, but Rancher Desktop quietly did a few jobs that you only notice when they stop happening. I uninstalled it again while writing this, and every one of these happened:
- Docker stops working. Uninstalling removes
/var/run/docker.sock, and Docker’s current context can be left pointing at it. Every command fails until you rundocker context use colima. - kubectl, helm and buildx disappear. They lived in
~/.rd/bin, which the uninstall empties. Install them from Homebrew. - Image pulls fail with a confusing error. Rancher Desktop sets
"credsStore": "osxkeychain"in~/.docker/config.jsonand ships the helper that goes with it. Remove the app and the setting can stay while the helper goes. The fix isbrew install docker-credential-helper. - Pulls fail behind a company proxy. Rancher Desktop copies your Mac’s certificate authorities into its VM. Colima does not, so behind Zscaler or similar every pull fails with
x509: certificate signed by unknown authority. - Your PATH still points at Rancher. The
~/.rd/binlines stay in your shell profiles; on my Mac, three of them. - Gigabytes stay on disk. One day of testing left 4.9 GB in
~/Library. Months of real use had left 59 GB. - No window. No list of containers, images or volumes, no Kubernetes switch, no logs a click away, nothing that tells you what is wrong.
7. Colima Dashboard: Filling the Gaps
Colima Dashboard is a small local web app for Colima. It is one Go binary with the page built in, it listens only on your own Mac, and it talks to Colima through its normal command line and to Docker through Colima’s socket. There is no Electron and no Node. I went through Rancher Desktop page by page and setting by setting and copied every feature a Mac developer would miss, then added the things I always wanted from it. The tour in section 2 shows each page; this is the full list.
Everything Rancher Desktop had
- Containers, Images, Volumes, Port Forwarding: the everyday lists, with start, stop, logs, inspect and remove, Compose projects grouped together.
- A shell and a file browser for any running container, in the page. Volumes can be browsed too, even when no container uses them.
- Live stats per container: CPU, memory, network and disk I/O, and its processes.
- Images: pull, build from a folder on your Mac, push, and scan with Trivy.
- Kubernetes: on or off, a k3s version picker, Traefik on or off, workloads with their logs, and reset.
- Snapshots: save a stopped profile and roll back to it. They are APFS clones, so saving takes a second and uses almost no disk.
- A menu bar icon with each profile’s state and start and stop, and notifications.
- Preferences: CPUs, memory, disk, runtime, VM type, mounts, Rosetta, profiles, start at login and a dark theme.
Things Rancher Desktop never had
- Diagnostics with a fix button for every problem in section 6. Press it and Terminal opens running the exact command, so you see what it does. Anything that deletes or edits a file asks first and keeps a backup. The company proxy one copies your Mac’s certificates into the VM in one click.
- Runs and tests: every container that ran, how long it took and how it ended, with pass rates and the tests that are getting slower or flaky.
- Builds: build times, cache hit rates and why a build failed, over 30 days.
- Monitor: live graphs for the VM and each container, plus 30 days of history and a forecast of when the disk fills up.
- Alerts: a macOS notification when a test container or a build fails, or something runs out of memory.
It also keeps itself current: it checks GitHub for new releases of itself and of Colima, updates itself if you let it (checking the checksum first), and updates Colima through Homebrew with one click.
8. Moving Over: the Short Checklist
If you would rather do it by hand, this is everything, in order. Colima Dashboard’s Diagnostics page finds and fixes each of these for you.
# 1. Quit and remove Rancher Desktop
osascript -e 'quit app "Rancher Desktop"'
brew uninstall --cask rancher

# 2. Remove what it leaves behind (check the size first: mine was 59 GB)
du -sh ~/Library/Application\ Support/rancher-desktop
rm -rf ~/Library/Application\ Support/rancher-desktop ~/Library/Caches/rancher-desktop
sed -i '.bak' '/\.rd\/bin/d' ~/.zshrc ~/.bash_profile ~/.bashrc

# 3. Install Colima and the tools Rancher used to bundle
brew install colima docker docker-compose docker-buildx docker-credential-helper kubectl

# 4. Start it and point Docker at it
colima start
docker context use colima
docker run --rm hello-world
9. When Rancher Desktop Is Still the Right Choice
Colima is not for everyone, and I would not move a whole team over without checking these first. Stay on Rancher Desktop if you need Windows or Linux as well as macOS, Docker Desktop style extensions, or settings that your IT team locks down centrally. For one developer on a Mac who wants Docker and the occasional Kubernetes cluster, Colima with a small dashboard on top is the better trade.
10. Getting It
Colima Dashboard is free and open source under the Apache 2.0 licence: github.com/andrewbakercloudscale/colima-dashboard. The one line install is in section 1, the tour in section 2, and the benchmark scripts are in the same repository. It is an independent project, not affiliated with Colima, Rancher Desktop or SUSE. If something does not work on your Mac, the dashboard has a Report a problem link on its first page.