Banking Technology & Cybersecurity: Real-World Engineering
43 views
Fraud systems, payments engineering, banking malware, and what building secure financial technology looks like inside one of Africas largest retail banks.


Capitec Pulse: The Engineering Behind Real-Time AI at Scale
By Andrew Baker, Chief Information Officer, Capitec Bank The Engineering Behind Capitec Pulse 1. Introduction I have had lots of questions about how we are “reading our clients minds”. This is a great question, but the answer is quite complex – so I decided to blog it. The article below really focuses on the heavy […]
Read more →
How Capitec Secures Your Money: Real Answers to Real Questions
Andrew Baker · May 2026 I get asked a lot of questions about how Capitec secures its customers’ money. Not in the abstract, but the real ones: what happens if someone swaps my SIM, can someone drain my account while I am on hold with the fraud line, how do you stop someone inside the […]
Read more →
Lock It Down: The Complete Guide to Securing Your WhatsApp
Your WhatsApp account is not just a chat app. It is your identity, your contacts, your banking OTPs, your family photos, and your most private conversations. When criminals take it over, they use it immediately to impersonate you and defraud everyone you know. This guide walks through every meaningful control available to you, explains what […]
Read more →
Why Core Banking Architecture Has Always Been Flawed
The COBOL apocalypse conversation this week has been useful, because it has forced the industry to confront something it has been avoiding for decades. But most of the coverage is stopping at the wrong point. Everyone is talking about COBOL. Nobody is talking about the architectural philosophy that COBOL gave birth to, the one that […]
Read more →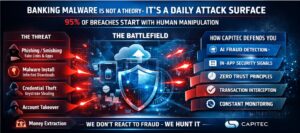
Banking Malware on Android: How to Spot It and Stay Safe
Published by Andrew Baker and the Capitec App Security Team | March 2026 For media enquiries and quotable statistics from this article, see the Press Summary at the end. Every day, approximately 15 million South Africans open the Capitec app to check their balance, pay a bill, or send money to a loved one. It […]
Read more →
XZ Utils Backdoor: How One Engineer Saved the Internet
On a quiet Friday evening in late March 2024, a Microsoft engineer named Andres Freund was running some routine benchmarks on his Debian development box when he noticed something strange. SSH logins were taking about 500 milliseconds longer than they should have. Failed login attempts from automated bots were chewing through an unusual amount of […]
Read more →
This Strange Machinery: How African Banking Struggles to Lend to Clients
Ride’s “Chrome Waves” is a 1992 B-side that most people will not know, and one of its lines has lodged itself in my thinking about African banking: “this strange machinery, is keeping you from seeing me.” The lyric was written about something entirely personal, a distance between two people that the ordinary machinery of life […]
Read more →
Synchronous Transactions in Banking: Why They Cause Failures at Scale and What to Do Instead
The mistake is not synchronous processing. The mistake is dragging unrelated work inside the synchronous boundary. 1. What Users Actually Experience as Real Time There is a particular type of architect that most people in banking technology will recognise immediately: deeply opinionated about correctness, committed to order, and entirely confident that every payment must complete […]
Read more →
Rubrik Architecture: Why Restore, Not Backup, Is the Product
1. Backups Should Be Boring (and That Is the Point) Backups are boring. They should be boring. A backup system that generates excitement is usually signalling failure. The only time backups become interesting is when they are missing, and that interest level is lethal. Emergency bridges. Frozen change windows. Executive escalation. Media briefings. Regulatory apology […]
Read more →
How a Blog Post Wiped $30 Billion from IBM in One Day
Anthropic published a blog post on Monday. Not a product launch, not a partnership announcement, not a keynote at a major conference. Just a simple blog post explaining that Claude Code can read COBOL. IBM proceeded to drop 13%, its worst single day loss since October 2000, with twenty five years of stock resilience gone […]
Read more →
Hidden Bank Fees Exposed: How AI Will End Fee Smuggling
There is nowhere left to hide. For decades, banks built an elegant asymmetry into the relationship with their customers. The bank had a team of specialists, the time to design products, and the lawyers to draft disclosure documents that were technically correct and practically unreadable. The customer had a life to live and, at the […]
Read more →
Cloudflare Free Tier Review: Why It Works for Enterprise
By Andrew Baker, CIO at Capitec Bank There is a truth that most technology vendors either do not understand or choose to ignore: the best sales pitch you will ever make is letting someone use your product for free. Not a watered-down demo, not a 14-day trial that expires before anyone has figured out the […]
Read more →