If you run a WordPress site behind Cloudflare, your page view numbers are lying to you.
Jetpack Stats, WP Statistics, Post Views Counter and nearly every other WordPress analytics plugin share the same fatal flaw: they count views on the server. When Cloudflare serves a cached HTML page (which is the entire point of using Cloudflare), WordPress never executes. The PHP never runs. The counter never increments. Your stats show a fraction of your actual traffic.
I spent years watching Jetpack report 200 views on posts that Google Analytics showed had 2,000. The gap is not subtle. On a site with a healthy Cloudflare cache hit rate of 85 to 95 percent, server side counters undercount by 5x to 10x. That is not a rounding error. That is a broken measurement system.
CloudScale Page Views fixes this. It is a WordPress plugin I built specifically to solve the CDN counting problem. It counts every single view regardless of whether the page was served from Cloudflare’s cache, your origin server, or anywhere in between.
This post covers how it works, how to install and configure it, how to migrate your existing Jetpack data, and why the architecture makes it fundamentally more accurate than any server side counter.
Why Server Side Counting Fails Behind a CDN
The typical WordPress page view counter works like this: a visitor requests a page, WordPress processes the request, the counter plugin hooks into the template or content filter, increments a number in the database, and serves the page. Every step happens during the PHP request lifecycle.
Now add Cloudflare. The first visitor hits the page and the origin server processes it normally. Cloudflare caches the response. The next 100 visitors get the cached version directly from Cloudflare’s edge. WordPress never sees those 100 requests. The counter shows 1 view instead of 101.
This is not a Cloudflare bug. This is exactly how CDN caching is supposed to work. The problem is that server side counting was designed for a world where every request hits the origin. That world ended years ago.
Some plugins try to work around this by setting pages as uncacheable, which defeats the purpose of having a CDN. Others use JavaScript trackers that phone home to external servers, which introduces privacy concerns and third party dependencies. Jetpack Stats sends data to WordPress.com servers, which means your analytics depend on Automattic’s infrastructure being available and their data retention policies.
How CloudScale Page Views Works
CloudScale takes a different approach. The page loads from cache as normal, giving you the full speed benefit of Cloudflare. Then a lightweight JavaScript beacon fires after the page has loaded and sends a POST request to a WordPress REST API endpoint.
The key insight is that while the HTML page itself is cached, the REST API endpoint is not. The plugin sends explicit no cache headers on every API response and you configure a Cloudflare Cache Rule to bypass caching on the API path. The beacon request always reaches the origin server.
Here is the sequence:
- Cloudflare serves the cached HTML at edge speed
- The browser renders the page and executes the beacon script
- The beacon sends a POST to
/wp-json/cloudscale-page-views/v1/record/{post_id} - The endpoint bypasses the CDN cache via headers and Cache Rules
- WordPress logs the view in a dedicated database table and increments the post meta counter
- The page view counter on the page updates live via the API response
The beacon is tiny. It adds negligible load time. The API call happens asynchronously after the page has already rendered, so there is zero impact on perceived performance. Your visitors never notice it.
Protection Against Gaming
Accurate counting means nothing if someone can inflate numbers by refreshing a page repeatedly or scripting requests to the API. CloudScale handles this at multiple levels.
Session deduplication prevents the same browser session from counting the same post twice. Refresh the page ten times and it still counts as one view. Close the tab, open a new one, and it counts as a new view. This uses sessionStorage, which means it works even with aggressive browser privacy settings that block cookies.
IP throttle protection limits how many views any single IP address can generate within a rolling window. The default is 50 requests per hour. After that threshold, subsequent requests are silently accepted (the attacker gets no signal that they have been blocked) but not recorded. Blocked IPs automatically unblock after one hour. There is no permanent blocklist to manage.
Logged in administrators bypass the throttle entirely, which is useful during development and testing. You can adjust the threshold, window, and enabled state from the IP Throttle tab in the plugin settings.
Installation
Download the plugin from https://andrewninjawordpress.s3.af-south-1.amazonaws.com/cloudscale-page-views.zip.
In the WordPress admin, go to Plugins, then Add New Plugin, then Upload Plugin. Choose the downloaded zip file and click Install Now. Once installed, click Activate.
The plugin creates its database table automatically on activation. No manual database setup is needed.
Then add the Cloudflare Cache Rule. This is the one required configuration step. In the Cloudflare dashboard, go to Caching, then Cache Rules, then Create Rule:
- Field: URI Path
- Operator: contains
- Value:
/wp-json/cloudscale-page-views/ - Action: Cache Status: Bypass
Without this rule, Cloudflare may cache the REST API response. The beacon will appear to work (it receives a 200 response from the cached copy) but no new views will be recorded. The plugin sends no cache headers as a safety net, but the Cache Rule is the primary and most reliable protection.
You can verify the rule is working from the Statistics tab. Visit a post on your site, then check the stats page. The post should appear in the Most Viewed list within a few seconds.
The Statistics Tab
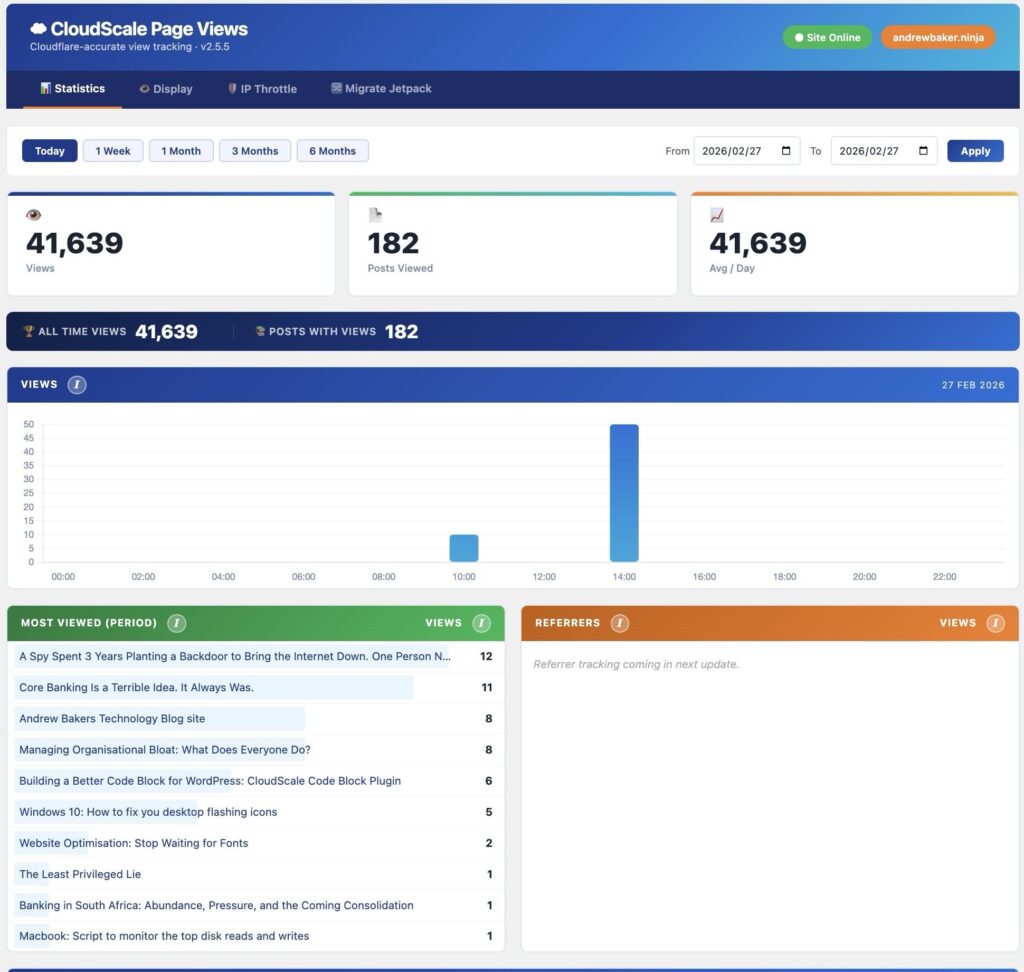
The main plugin interface lives at Tools, then CloudScale Page Views. The Statistics tab is the default view and shows everything about your traffic at a glance.
At the top, three summary cards show total views, posts viewed, and average views per day for the selected period. Below them, a chart shows views over time with tabs for 7 Hours, 7 Days, 1 Month, and 6 Months. The chart data comes from the raw view log, so it reflects actual recorded views.
The date range picker lets you zoom in on any period. Quick buttons cover Today, Last 7 Days, Last 30 Days, This Month, Last Month, This Year, and All Time. You can also pick custom start and end dates.
Below the chart, two ranked lists show your Most Viewed posts for the selected period and your top Referrers. The referrer tracking captures the HTTP referer header when available, so you can see whether traffic is coming from Google, social media, direct visits, or other sources.
If you migrated from Jetpack, a dark blue banner at the top of the tab shows your All Time Views and Posts With Views from the imported data. During the first 28 days after migration, the summary cards blend imported totals with new beacon data so the numbers are not misleadingly low while the plugin builds up its own historical data.
The Display Tab
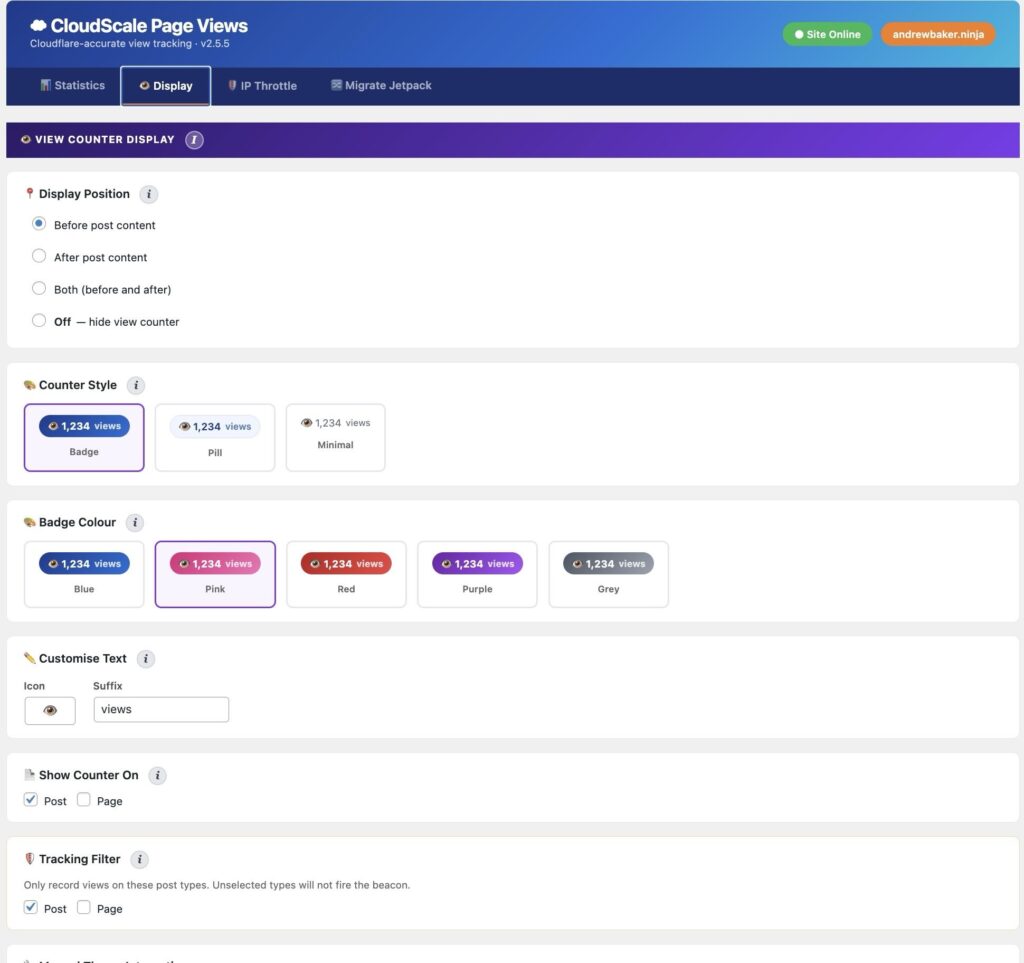
The Display tab controls how and whether the view counter appears on your posts.
Display Position has four options. Before Post Content places the counter above the post title, aligned to the right. After Post Content appends it below the post body. Both shows it in both positions. Off hides the counter entirely. You can still use template functions to display counts manually in your theme if you choose Off.
Counter Style offers three designs. Badge is a solid gradient background with white text, suitable for sites that want the counter to be prominent. Pill uses a light tinted background with coloured text, for a softer look. Minimal is plain text with no background, for sites that want counts visible but unobtrusive.
Badge Colour lets you choose from five gradient colour schemes: Blue (the default), Pink, Red, Purple, and Grey. The selected colour applies to all three styles. The badge gets the gradient, the pill gets a matching tinted background, and the minimal style uses the solid colour for text.
Customise Text lets you change the icon (default is the eye emoji) and the suffix (default is “views”). You could change the suffix to “reads” or “hits” or leave it empty for just the number.
Show Counter On controls which post types display the counter. By default only Posts are selected. You can also enable Pages or any custom post type registered on your site.
Tracking Filter controls which post types actually record views. This is separate from the display setting. You might want to track views on Pages (so they appear in your stats) but not display a counter badge on them. Or you might want to display counts on Pages but only track Posts. The two settings are independent.
The IP Throttle Tab
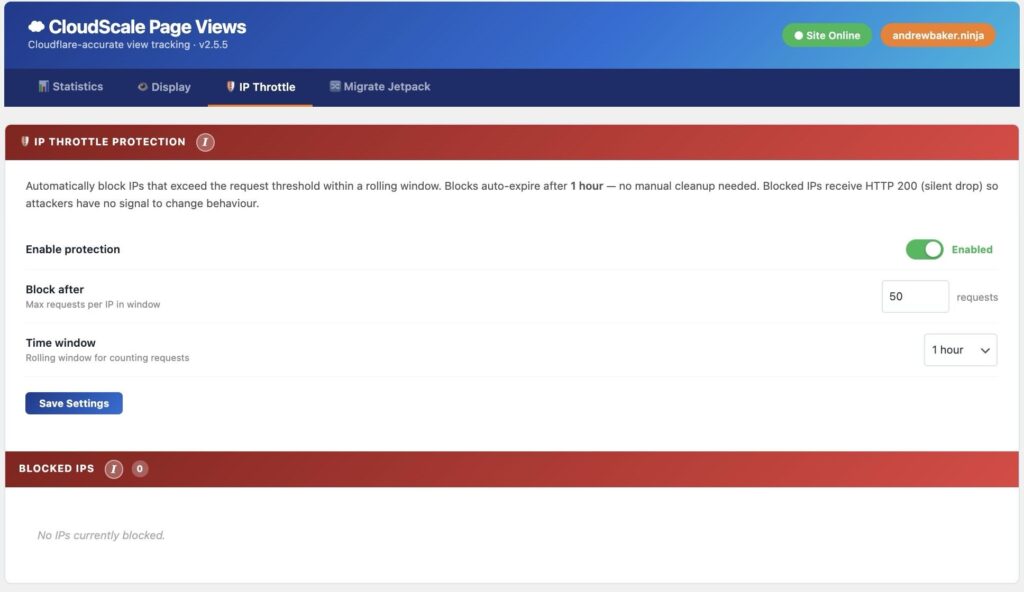
The IP Throttle tab manages the rate limiting system that prevents view inflation.
The main toggle enables or disables throttle protection globally. When enabled, you can configure the request limit (how many views per IP before blocking) and the time window (how long the counter accumulates before resetting). The default is 50 requests per 1 hour window.
The Blocked IPs section shows any currently blocked IP hashes with their block timestamp and expiry time. You can unblock individual IPs or clear the entire blocklist. All blocks expire automatically after 1 hour, so this section is mostly for monitoring rather than manual management.
The Block Log shows a chronological history of block events, which is useful for identifying patterns of abuse. It retains the last 100 events.
The Migrate Jetpack Tab
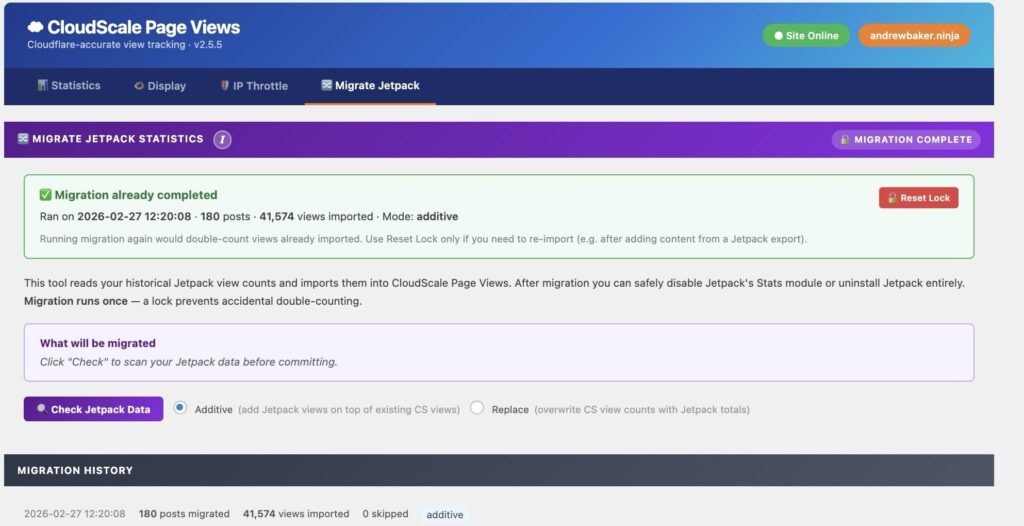
If you are moving from Jetpack Stats, the Migrate Jetpack tab handles the transition. Click the migration button and the plugin reads the jetpack_post_views meta values from all your posts and writes them into the CloudScale _cspv_view_count post meta field.
This is a one time operation. The migration copies lifetime totals only, not per day breakdowns, because Jetpack does not store daily granularity in post meta. After migration, a lock prevents accidental re runs.
The migration does not backfill the cspv_views log table because there are no timestamps to backfill. The log table is for trending data (which posts are popular right now) while the post meta stores lifetime totals. This is an intentional separation.
During the first 28 days after migration, the plugin runs in transition mode. The Top Posts widget and the summary cards blend imported totals with new beacon data. Posts are ranked by combined score (imported total plus beacon count) so your historically popular posts are not suddenly invisible. After 28 days, ranking switches to pure beacon data, which by then has enough history to be meaningful on its own.
Advantages Over Jetpack Stats
CloudScale has several architectural advantages over Jetpack Stats beyond the CDN counting issue.
Your data stays on your server. Jetpack sends analytics to WordPress.com where it is processed and stored on Automattic’s infrastructure. CloudScale writes directly to your WordPress database. You own the data, you control retention, and you do not depend on a third party service being available.
No external dependencies. Jetpack Stats requires a WordPress.com account, the Jetpack plugin (which is large and does many other things), and a persistent connection to Automattic’s servers. CloudScale is a single self contained plugin with no external service connections.
CDN aware by design. Jetpack’s counting happens during the PHP request lifecycle and fundamentally cannot count views served from cache. CloudScale’s beacon architecture was built specifically for CDN cached sites.
Privacy by default. CloudScale hashes IP addresses with your site salt before storage. Raw IPs never touch the database. Jetpack’s privacy practices are governed by Automattic’s privacy policy, which you do not control.
Lightweight. The beacon script is a few kilobytes. The REST endpoint does minimal work (one database insert, one meta update). There is no heavyweight JavaScript analytics library, no tracking pixels, no third party scripts.
Real time display. The beacon response includes the updated count, which is injected into the page immediately. Jetpack Stats has a delay before numbers appear in the dashboard.
Dashboard Widget
The plugin adds a CloudScale Page Views widget to the WordPress admin dashboard. It shows today’s view count, last 7 days total, a time series chart with tabs for different periods, and a list of the top posts for today with proportional bar charts.
The widget updates via AJAX when you switch between the 7 Hours, 7 Days, 1 Month, and 6 Months tabs. At the bottom, a link to the full statistics page and a shield icon confirming whether IP throttle protection is active.
Sidebar Widgets
The plugin registers two sidebar widgets that you can add to any widget area in your theme. Both are configured through the standard WordPress widget interface.
Adding the Widgets
Go to Appearance, then Widgets in the WordPress admin. You will see two new widgets available: CloudScale Top Posts and CloudScale Recent Posts. Drag either widget into your desired sidebar area, or click the widget and select a widget area.
If your theme uses the block based widget editor, click the plus button in your sidebar area, search for “CloudScale”, and add the widget block.
Top Posts Widget Settings
The Top Posts widget displays your most viewed posts ranked by view count. It supports the following settings.
Title controls the heading shown above the widget. The default is “Top Posts”. You could change it to “Most Popular”, “Trending”, or anything else.
Total posts to load sets how many posts are fetched from the database. The default is 20. If you want a deep list with pagination, increase this. The widget only queries once and paginates client side, so a higher number does not cause repeated database queries.
Posts per page controls how many posts are visible at a time before the pagination arrows appear. The default is 5. If your sidebar is narrow, 3 or 4 may work better. The widget shows Previous and Next buttons when there are more posts than this number.
Thumbnail width sets the pixel width of post thumbnails. The default is 150. Set to 0 to hide thumbnails entirely. The height is calculated proportionally from the featured image aspect ratio.
Order by lets you choose between Most Viewed (ranked by view count) and Most Recent (ranked by publication date). Most Viewed is the default and the most useful option for a “popular posts” sidebar.
View window (days) only applies when ordered by Most Viewed. It controls the time range for counting views. The default is 28 days, meaning the widget shows the most viewed posts from the last 28 days. Set to -1 for all time ranking. During the first 28 days after a Jetpack migration, the widget automatically blends imported lifetime totals with beacon data so your historically popular posts stay visible.
On desktop screens wider than 768 pixels, the widget renders in a two column grid layout. On mobile, posts stack into a single column. Each post shows the thumbnail, title (linked to the post), publication date, and view count.
Recent Posts Widget Settings
The Recent Posts widget displays your latest published posts in chronological order. It supports these settings.
Title controls the heading. The default is “Most Recent Posts”.
Number of posts sets how many posts to display. The default is 10.
Show date toggles whether the publication date appears below each post title.
Show views toggles whether the view count badge appears on each post. This is enabled by default and shows the same formatted count from the CloudScale view counter. Useful for showing readers that a recent post is already getting traction.
Both widgets use the same visual style with orange accent pagination controls and clean card layouts with subtle hover effects.
Template Functions
For theme developers who want manual control, CloudScale provides template functions.
cspv_the_views() outputs the formatted view counter with icon and suffix. You can pass an array of options to customise the icon and suffix text.
cspv_get_view_count() returns the raw numeric count for the current post or a specified post ID. Use this when you need the number for calculations or custom display logic.
Elements with the CSS class cspv-views-count and a data-cspv-id attribute are automatically updated by the beacon on archive and listing pages. This means your view counts stay fresh even when Cloudflare has cached the listing page HTML.
Debugging
If views are not being recorded, check these things in order.
First, verify the Cloudflare Cache Rule is active. On the Statistics tab, the endpoint diagnostic will tell you if the REST API is reachable and not cached.
Second, open your browser console on a post page and look for [CloudScale PV] log messages. If WP_DEBUG is enabled, the beacon logs its activity. You should see “record mode” followed by a successful response with logged: true.
Third, check the IP Throttle tab. If you have been testing heavily, you may have hit the 50 request per hour limit. Logged in administrators bypass the throttle in version 2.4.7 and later, but earlier versions do not have this bypass.
Fourth, verify the database table exists. The plugin creates wp_cspv_views on activation. If activation was interrupted, the table may be missing columns. Version 2.4.9 and later auto upgrade the table schema on admin page load.
You can also test the API directly from the browser console:
fetch('/wp-json/cloudscale-page-views/v1/ping')n .then(r =u0026gt; r.json())n .then(d =u0026gt; console.log(d))nThis should return the plugin version and current server time. If it returns a Cloudflare cached response (same timestamp on repeated calls), your Cache Rule is not working.
Source Code
CloudScale Page Views is open source under the GPL 2.0 license. The full source is included in the plugin zip and available on the author’s site.