WordPress Blog Posts Deserve Better: Code Syntax Highlighting, Live Links to GitHub, Quality Charts and Mermaid Diagrams

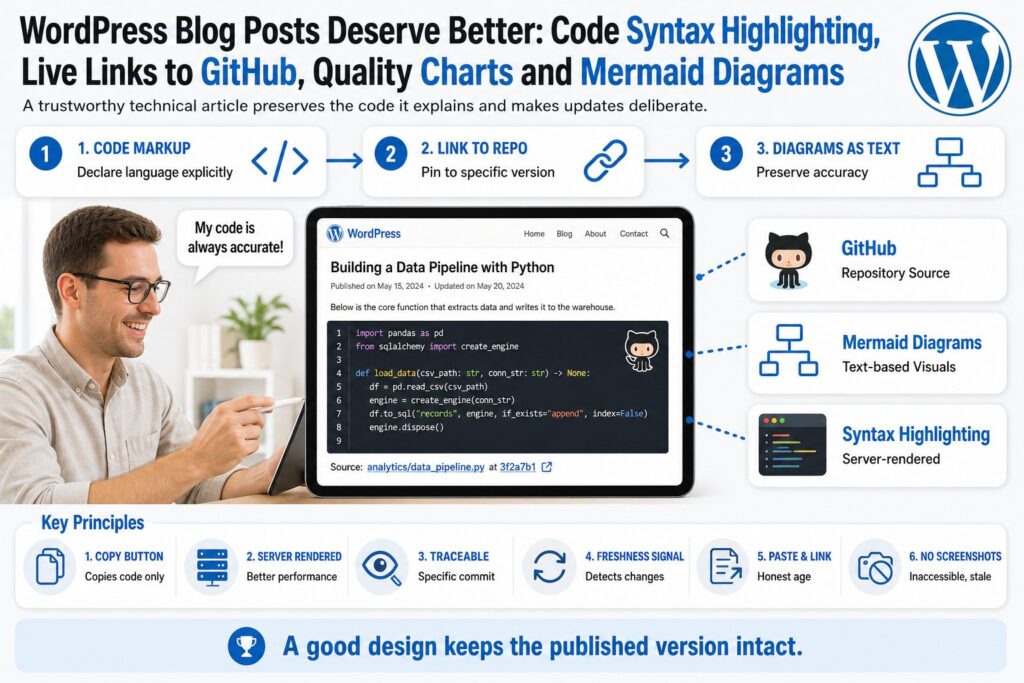
Syntax highlighted code, GitHub links pinned to a specific commit, charts rendered from real data, and Mermaid diagrams written as text make technical WordPress posts accurate and verifiable. Screenshots go stale and live embeds change silently. Versioned, editable, source backed content lets readers check exactly what the author described.
The plugin behind this post: Download CloudScale Cyber DevTools (free, zip) | Read the documentation
Most technical blogs treat everything that is not prose as an afterthought. Code is pasted in as a block of monospaced text, or worse, as a screenshot of an IDE. Architecture diagrams arrive as PNG exports from a drawing tool nobody can find any more. Charts are screenshots of a spreadsheet. The reader is left to guess which version of the repository the code came from, whether the diagram still matches the system, and which numbers sit behind the chart. Live embeds look like the cure, but they swap one problem for another: the content changes underneath the explanation, and nobody is told.
This post argues for a different model, and it applies to code, diagrams and charts alike. A post should hold the source of everything it shows as text: the exact code it explains, the diagram as a description instead of a picture, the chart as its numbers. It should record where that source came from, draw it properly for the reader, and change only when the author decides it should. The sections below cover what good code markup looks like, how to tie a snippet to a specific version of a GitHub repository, why diagrams and charts should be kept as text and drawn in the post, and whether anything in the WordPress ecosystem supports all of this today.
The thesis is simple. A trustworthy technical article preserves the source of what it shows and makes updates deliberate. Syntax highlighting, diagrams and charts are how that source is presented, but the publication and revision model is what makes the difference.
1. What good code markup actually means
Good code markup starts from the assumption that a reader will copy what you show them and run it. So every block should:
- declare its language explicitly
- use real syntax highlighting rather than a theme’s default grey box
- preserve indentation exactly
- offer a copy button that copies the code and nothing else
- keep line numbers out of the clipboard
Screenshots of code fail almost every one of these tests. They cannot be copied or selected, screen readers cannot read them, and they silently go stale the moment the underlying file changes. OCR can recover some text from an image, but that makes a screenshot a poor substitute for accessible, selectable source text, not an equivalent.
The second requirement is that highlighting should, where possible, happen on the server when the post is saved or rendered rather than in the reader’s browser. A page that ships a large JavaScript highlighter to colour twenty lines of Python pays a performance cost on every view. Server rendered markup also keeps the code intact in RSS readers, email newsletters and AI summarisers that never execute your scripts. It does not guarantee how the code looks there: colours and styling still depend on the receiving application, and many feed readers and email clients strip or override them. What it guarantees is that the code itself arrives without needing JavaScript.
The third requirement is restraint. A snippet should show the smallest piece of code that makes the point. Line highlighting should draw the eye to the two or three lines that matter, and a link should let the curious reader see the full file in context.
import random

def backoff(attempt: int, base: float = 0.1, cap: float = 10.0) -> float:
    # Full jitter: spread retries so clients do not synchronise
    return random.uniform(0, min(cap, base * (2 ** attempt)))
That link is where most posts fall down. It is usually missing, or it points at a branch that has moved on since the post was written.
2. Linking code in a post back to the GitHub repository
The repository should be the source of truth for any code that appears in a post, and the post should say exactly which version it is showing. GitHub makes this straightforward. Selecting a range of lines in a file gives a URL ending in a fragment such as #L15-L29. Pressing y on a file page rewrites the URL from a branch name to the full commit SHA, so the link permanently refers to those exact lines at that exact commit. When you post a permalink to a line range in an issue or pull request, GitHub renders it as an embedded code snippet, which is a good model for what a blog should do.
Traceable and fresh are different properties
Before comparing approaches, it helps to separate two properties that are often blurred together:
- Traceable means the reader sees exactly the code the author explained, and can follow it back to a specific commit.
- Fresh means the example still reflects the current state of the project.
A snippet is there to illustrate a point, not to stand in for a complete project. The link back to the repository is where the reader goes for the full context.
Traceability and freshness pull in different directions. A pinned example stays traceable forever but can quietly become outdated. A branch embed stays current, but the moment the code changes, the prose around it may become wrong. Neither is enough on its own. A good design keeps the published version intact, detects when it may have become stale, and lets the author decide what to do about it.
Three ways to bring code into a post
There are three reasonable approaches, and each makes a different trade.
- Paste and link. Paste the snippet into a highlighted code block and add a caption linking to the pinned permalink. This is fast, renders on the server and is honest about its age. It is traceable but has no freshness signal at all. Nobody will know when it goes out of date.
- Embed live. Embed the file from GitHub at view time using a script. Pointed at a branch, this is always current, but it fails in two ways. Lines added above your range make the embed show the wrong code with no warning. Even when the range stays correct, the code can change underneath an explanation that no longer matches it.
- Fetch from a pinned commit and save a snapshot. This is the one I would argue for wherever accuracy matters. At publish time, fetch the snippet from a pinned commit and save it as part of the article revision, so the published post stays readable even if GitHub is unavailable or the repository disappears. Show a small footer naming the repository, file path and short SHA, linking to the same lines on GitHub. Then tell the author, not the reader, when the selected code has changed upstream, so they can review the code and the prose together before updating.
Named regions help, but do not finish the job
Line drift is the reason live embeds are less useful than they first appear. The more robust fix is to anchor snippets to named regions in the source rather than to line numbers, using comment markers such as // region: retry-policy and // endregion. The post then asks for a named block of code, and keeps working as the file around it changes. Documentation tools have done this for years, and the idea has been raised against at least one of the popular GitHub embed services, but it is still rare in blogging tools.
Named regions solve line movement. They do not stop the behaviour inside the region from changing. So the staleness check should compare the content of the selected snippet at the pinned commit with the same region on the default branch. Warning whenever the repository receives any commit would bury the author in noise about unrelated changes and teach them to ignore the warning.
The check is a prompt to look again, not a guarantee. Code outside the region can still change what it does, which is one more reason the footer links to the repository.
3. Diagrams as code with Mermaid
The argument that applies to code applies equally to architecture diagrams. A diagram exported as a PNG can still be reviewed in a pull request and compared visually, but the comparison only shows that pixels moved. Text gives a meaningful diff of what changed and can be edited without finding the original drawing file, which in practice is often lost. Mermaid describes flowcharts, sequence diagrams, state machines, entity relationships and Gantt charts as plain text in a fenced code block. GitHub renders it natively, and it can live in the same repository as the code it describes, so the diagram in the post and the diagram in the README can be the same file.
sequenceDiagram
    accTitle: Publishing a pinned code snippet
    accDescr: The author commits code and diagram source to GitHub, then publishes a post referencing a file, region and commit. WordPress fetches the snippet once at publish time and saves it with the article revision. Readers are served the saved snapshot and never wait on GitHub.
    participant Author
    participant Repo as GitHub repo
    participant Blog as WordPress
    participant Reader
    Author->>Repo: commit code and diagram source
    Author->>Blog: publish post referencing file, region and SHA
    Blog->>Repo: fetch snippet at publish time
    Blog-->>Blog: save source, SHA, path and range with the revision
    Reader->>Blog: view post
    Blog-->>Reader: highlighted code, diagram, link to exact lines
Keep the source, choose where to render it
The portable pattern, which the F# documentation tooling describes well, is to keep the diagram as an ordinary fenced block tagged mermaid. Viewers with Mermaid support, GitHub among them, will render it. Other Markdown viewers will show the source text, which at least stays readable. GitHub also advises checking which Mermaid version it supports, because syntax added in newer releases may not render there yet.
There is a tension here with section 1. I argued that code should be rendered before readers arrive, and Mermaid is usually rendered in the reader’s browser, with all the same costs: a large script, a blank space until it loads, and nothing at all in feeds and email. Browser rendering is accepted mainly because it is easy. It needs no build step and no rendering infrastructure on the server.
Where your hosting allows it, pre-rendering is the better option. Mermaid’s official CLI generates SVG, PNG and PDF from the same source. That lets you serve SVG on the website, where it stays sharp and keeps its text, and a PNG fallback to email clients that will not display SVG. The cost is extra infrastructure: the CLI runs a headless browser, which not every WordPress host will let you run.
The principle that matters is not “never use images”. It is to keep the diagram’s source as versioned text and generate whatever image you display from it. Images are a perfectly good output format. The problem is losing the editable source.
Accessibility, theming and loading
A properly done diagram also needs:
- A text explanation. Write a short paragraph saying what the diagram shows, not just a caption naming it.
- Mermaid’s
accTitleandaccDescrmetadata. Mermaid turns these into accessible title and description attributes on the generated SVG. - Selective loading. Load the Mermaid library only on pages that actually contain a diagram.
- Dark mode. Respect the reader’s preference rather than drawing a bright white rectangle in the middle of a dark page.
4. Charts as text, drawn in the post
Charts have the same problem as diagrams. A chart pasted in as a screenshot cannot be corrected, restyled or checked against its numbers, and it is unreadable on a phone and blinding in dark mode. Keeping the numbers in the post as text fixes all of that. The data can be reviewed in a diff, the chart follows the reader’s theme, and updating a figure means changing one number instead of opening a spreadsheet and exporting a new image.
The code block on this site draws charts as well as diagrams. Every chart below is live, drawn in your browser from text stored in the post. Press Source on any of them to see exactly what produced it, use the sun or moon button to switch theme, and press Copy image to put a picture of the chart, with its title and legend, on your clipboard.
A chart from a few lines of text
The simplest form needs no JSON at all. Settings go at the top, then one line per series. This is the complete source of the chart underneath it, shown here as ordinary highlighted code:
type: line
title: How long a client waits before retrying
subtitle: The backoff function from section 1, with a 0.1 second base and a 10 second cap
x: 0, 1, 2, 3, 4, 5, 6, 7, 8, 9
x-label: Attempt
y-label: Seconds
suffix: s
Longest possible wait: 0.1, 0.2, 0.4, 0.8, 1.6, 3.2, 6.4, 10, 10, 10
Average wait: 0.05, 0.1, 0.2, 0.4, 0.8, 1.6, 3.2, 5, 5, 5
source: computed from the function above
Set the block’s language to Chart and the same text becomes this. It plots the backoff function from section 1, so the numbers are computed from code that is already in this post:
type: line
title: How long a client waits before retrying
subtitle: The backoff function from section 1, with a 0.1 second base and a 10 second cap
x: 0, 1, 2, 3, 4, 5, 6, 7, 8, 9
x-label: Attempt
y-label: Seconds
suffix: s
Longest possible wait: 0.1, 0.2, 0.4, 0.8, 1.6, 3.2, 6.4, 10, 10, 10
Average wait: 0.05, 0.1, 0.2, 0.4, 0.8, 1.6, 3.2, 5, 5, 5
source: computed from the function above
Pasting a Chart.js configuration
If you already have a Chart.js configuration, or an AI assistant has written one for you, paste the JSON in as it is. The block draws it and fills in sensible colours for anything you did not style. This one makes the case for selective loading better than a paragraph could. It shows the size of each rendering library this site ships, which is exactly why each one is loaded only on pages that use it:
{
  "type": "bar",
  "data": {
    "labels": ["highlight.js", "Chart.js", "Vega-Lite", "Vega", "Mermaid"],
    "datasets": [
      {
        "label": "Minified size in KB",
        "data": [129, 209, 258, 521, 5493],
        "backgroundColor": ["#38bdf8", "#34d399", "#fbbf24", "#f97316", "#f43f5e"]
      }
    ]
  },
  "options": {
    "indexAxis": "y",
    "plugins": {
      "title": { "display": true, "text": "Why libraries should load only where they are used" },
      "subtitle": { "display": true, "text": "Size of each rendering library this site ships, before compression" },
      "legend": { "display": false }
    },
    "scales": {
      "x": { "title": { "display": true, "text": "Kilobytes" } }
    }
  }
}
Vega and Vega-Lite for anything more demanding
Vega-Lite describes a chart as data plus a set of transformations, which means the chart can do its own arithmetic. The specification below contains no data points. It generates 400 retries, applies the same full jitter formula as the Python in section 1, and plots the result. Reload the page and the dots land somewhere new, while the red line marking the longest possible wait stays put:
{
  "$schema": "https://vega.github.io/schema/vega-lite/v6.json",
  "title": {
    "text": "400 simulated retries with full jitter",
    "subtitle": "Recomputed in your browser every time the page loads"
  },
  "width": "container",
  "height": 320,
  "data": { "sequence": { "start": 0, "stop": 400, "as": "i" } },
  "transform": [
    { "calculate": "datum.i % 10", "as": "attempt" },
    { "calculate": "min(10, 0.1 * pow(2, datum.attempt))", "as": "limit" },
    { "calculate": "random() * datum.limit", "as": "delay" }
  ],
  "layer": [
    {
      "mark": { "type": "circle", "size": 45, "opacity": 0.5, "color": "#38bdf8" },
      "encoding": {
        "x": { "field": "attempt", "type": "ordinal", "title": "Attempt", "axis": { "labelAngle": 0 } },
        "y": { "field": "delay", "type": "quantitative", "title": "Delay in seconds" }
      }
    },
    {
      "mark": { "type": "line", "color": "#f43f5e", "strokeWidth": 2 },
      "encoding": {
        "x": { "field": "attempt", "type": "ordinal" },
        "y": { "aggregate": "max", "field": "limit", "type": "quantitative" }
      }
    }
  ]
}
Every chart type, one example each
The three charts above cover a line chart, a horizontal bar chart from Chart.js JSON, and Vega-Lite. Here is one of everything else. Most of the numbers come from the backoff function in section 1 or from the size of the libraries this site ships, so each chart can be checked against something already in this post. Press Source on any chart to see its text and copy it as a starting point.
Area. type: area. A line with the space beneath it filled, for totals that build up.
type: area
title: Total time spent waiting
subtitle: The longest a client can have waited in all, after each attempt
x: 0, 1, 2, 3, 4, 5, 6, 7, 8, 9
x-label: Attempt
y-label: Seconds
suffix: s
Total wait: 0.1, 0.3, 0.7, 1.5, 3.1, 6.3, 12.7, 22.7, 32.7, 42.7
Stacked area. type: stacked-area. Each series sits on top of the one before, so the top edge is the total.
type: stacked-area
title: What full jitter saves
subtitle: On average a client waits half the limit, the rest is never spent
x: 0, 1, 2, 3, 4, 5, 6, 7, 8, 9
x-label: Attempt
y-label: Seconds
suffix: s
Average wait: 0.05, 0.1, 0.2, 0.4, 0.8, 1.6, 3.2, 5, 5, 5
Time saved: 0.05, 0.1, 0.2, 0.4, 0.8, 1.6, 3.2, 5, 5, 5
Bar. type: bar. Two or more series are drawn side by side.
type: bar
title: A bigger base reaches the cap sooner
subtitle: Longest wait at each attempt, for two starting delays
x: 0, 1, 2, 3, 4, 5
x-label: Attempt
y-label: Seconds
suffix: s
Base 0.1s: 0.1, 0.2, 0.4, 0.8, 1.6, 3.2
Base 0.5s: 0.5, 1, 2, 4, 8, 10
Stacked bar. type: stacked. Parts of a whole, compared across categories.
type: stacked
title: What a page downloads depends on what is in it
subtitle: Rendering libraries loaded, before compression
x: Code only, Code and a chart, Code and a Vega-Lite chart
y-label: Kilobytes
suffix: KB
highlight.js: 129, 129, 129
Chart.js: 0, 209, 0
Vega and Vega-Lite: 0, 0, 789
Horizontal bar. type: hbar. The better choice when the labels are long.
type: hbar
title: Attempts before the 10 second cap applies
subtitle: For five different starting delays
x: Base 0.05s, Base 0.1s, Base 0.2s, Base 0.5s, Base 1s
Attempts: 8, 7, 6, 5, 4
Pie. type: pie. One series, one slice per label.
type: pie
title: One library is most of the weight
subtitle: Minified size of each rendering library this site ships
x: Mermaid, Vega, Vega-Lite, Chart.js, highlight.js
suffix: KB
Size: 5493, 521, 258, 209, 129
Donut. type: donut. A pie with the middle removed.
type: donut
title: The same libraries without Mermaid
subtitle: What is left when a page has no diagram on it
x: Vega, Vega-Lite, Chart.js, highlight.js
suffix: KB
Size: 521, 258, 209, 129
Radar. Chart.js JSON with "type": "radar". Several scores for the same things, compared by shape.
{
  "type": "radar",
  "data": {
    "labels": [
      "Diffable",
      "Dark mode",
      "Phone",
      "Screen reader",
      "Easy to update",
      "No JavaScript"
    ],
    "datasets": [
      {
        "label": "Chart kept as text",
        "data": [
          5,
          5,
          5,
          4,
          5,
          1
        ]
      },
      {
        "label": "Screenshot of a chart",
        "data": [
          1,
          1,
          2,
          2,
          1,
          5
        ]
      }
    ]
  },
  "options": {
    "plugins": {
      "title": {
        "display": true,
        "text": "A chart as text against a screenshot"
      },
      "subtitle": {
        "display": true,
        "text": "My own scores out of 5, not a measurement"
      }
    },
    "scales": {
      "r": {
        "min": 0,
        "max": 5,
        "ticks": {
          "stepSize": 1
        }
      }
    }
  }
}
Polar area. Chart.js JSON with "type": "polarArea". Equal angles, with the value shown as distance from the centre.
{
  "type": "polarArea",
  "data": {
    "labels": [
      "Attempt 3",
      "Attempt 4",
      "Attempt 5",
      "Attempt 6",
      "Attempt 7"
    ],
    "datasets": [
      {
        "label": "Longest wait in seconds",
        "data": [
          0.8,
          1.6,
          3.2,
          6.4,
          10
        ]
      }
    ]
  },
  "options": {
    "plugins": {
      "title": {
        "display": true,
        "text": "The wait doubles until it meets the cap"
      },
      "subtitle": {
        "display": true,
        "text": "Longest possible wait in seconds, attempts 3 to 7"
      }
    }
  }
}
Scatter. Chart.js JSON with "type": "scatter". Individual points, each with its own x and y.
{
  "type": "scatter",
  "data": {
    "datasets": [
      {
        "label": "One retry",
        "data": [
          {
            "x": 0,
            "y": 0.03
          },
          {
            "x": 1,
            "y": 0.03
          },
          {
            "x": 2,
            "y": 0.26
          },
          {
            "x": 3,
            "y": 0.06
          },
          {
            "x": 4,
            "y": 0.86
          },
          {
            "x": 5,
            "y": 1.17
          },
          {
            "x": 6,
            "y": 0.37
          },
          {
            "x": 7,
            "y": 5.07
          },
          {
            "x": 8,
            "y": 0.37
          },
          {
            "x": 9,
            "y": 4.34
          },
          {
            "x": 0,
            "y": 0.01
          },
          {
            "x": 1,
            "y": 0.02
          },
          {
            "x": 2,
            "y": 0.17
          },
          {
            "x": 3,
            "y": 0.66
          },
          {
            "x": 4,
            "y": 0.2
          },
          {
            "x": 5,
            "y": 0.71
          },
          {
            "x": 6,
            "y": 4.02
          },
          {
            "x": 7,
            "y": 9.48
          },
          {
            "x": 8,
            "y": 5.77
          },
          {
            "x": 9,
            "y": 3.97
          },
          {
            "x": 0,
            "y": 0.1
          },
          {
            "x": 1,
            "y": 0.01
          },
          {
            "x": 2,
            "y": 0.34
          },
          {
            "x": 3,
            "y": 0.23
          },
          {
            "x": 4,
            "y": 0.23
          },
          {
            "x": 5,
            "y": 0.38
          },
          {
            "x": 6,
            "y": 1.97
          },
          {
            "x": 7,
            "y": 8.16
          },
          {
            "x": 8,
            "y": 1.81
          },
          {
            "x": 9,
            "y": 5.82
          },
          {
            "x": 0,
            "y": 0.06
          },
          {
            "x": 1,
            "y": 0.07
          },
          {
            "x": 2,
            "y": 0.22
          },
          {
            "x": 3,
            "y": 0.05
          },
          {
            "x": 4,
            "y": 0.1
          },
          {
            "x": 5,
            "y": 0.66
          },
          {
            "x": 6,
            "y": 4.35
          },
          {
            "x": 7,
            "y": 4.28
          },
          {
            "x": 8,
            "y": 3.14
          },
          {
            "x": 9,
            "y": 5.86
          },
          {
            "x": 0,
            "y": 0.05
          },
          {
            "x": 1,
            "y": 0.06
          },
          {
            "x": 2,
            "y": 0.32
          },
          {
            "x": 3,
            "y": 0.56
          },
          {
            "x": 4,
            "y": 0.39
          },
          {
            "x": 5,
            "y": 1.84
          },
          {
            "x": 6,
            "y": 3.36
          },
          {
            "x": 7,
            "y": 8.75
          },
          {
            "x": 8,
            "y": 7.29
          },
          {
            "x": 9,
            "y": 2.88
          },
          {
            "x": 0,
            "y": 0.1
          },
          {
            "x": 1,
            "y": 0.02
          },
          {
            "x": 2,
            "y": 0.17
          },
          {
            "x": 3,
            "y": 0.61
          },
          {
            "x": 4,
            "y": 0.24
          },
          {
            "x": 5,
            "y": 1.56
          },
          {
            "x": 6,
            "y": 0.25
          },
          {
            "x": 7,
            "y": 6.68
          },
          {
            "x": 8,
            "y": 7.65
          },
          {
            "x": 9,
            "y": 5.73
          }
        ]
      }
    ]
  },
  "options": {
    "plugins": {
      "title": {
        "display": true,
        "text": "Sixty retries, saved with the post"
      },
      "subtitle": {
        "display": true,
        "text": "A fixed sample from the backoff function, six retries per attempt"
      },
      "legend": {
        "display": false
      }
    },
    "scales": {
      "x": {
        "title": {
          "display": true,
          "text": "Attempt" }
      },
      "y": {
        "title": {
          "display": true,
          "text": "Delay in seconds" }
      }
    }
  }
}
Bubble. Chart.js JSON with "type": "bubble". A scatter chart where the size of each point carries a third number.
{
  "type": "bubble",
  "data": {
    "datasets": [
      {
        "label": "Attempt",
        "data": [
          {
            "x": 0,
            "y": 0.1,
            "r": 4.1
          },
          {
            "x": 1,
            "y": 0.2,
            "r": 4.2
          },
          {
            "x": 2,
            "y": 0.4,
            "r": 4.4
          },
          {
            "x": 3,
            "y": 0.8,
            "r": 4.9
          },
          {
            "x": 4,
            "y": 1.6,
            "r": 5.9
          },
          {
            "x": 5,
            "y": 3.2,
            "r": 7.8
          },
          {
            "x": 6,
            "y": 6.4,
            "r": 11.6
          },
          {
            "x": 7,
            "y": 10,
            "r": 17.6
          },
          {
            "x": 8,
            "y": 10,
            "r": 23.6
          },
          {
            "x": 9,
            "y": 10,
            "r": 29.6
          }
        ]
      }
    ]
  },
  "options": {
    "plugins": {
      "title": {
        "display": true,
        "text": "Each retry costs more than the last"
      },
      "subtitle": {
        "display": true,
        "text": "Height is the longest wait for that attempt, size is the total waited so far"
      },
      "legend": {
        "display": false
      }
    },
    "scales": {
      "x": {
        "title": {
          "display": true,
          "text": "Attempt" }
      },
      "y": {
        "title": {
          "display": true,
          "text": "Longest wait in seconds" }
      }
    }
  }
}
Raw Vega. The Vega language itself, one level below Vega-Lite. It is longer to write, and in return every scale, mark and transform is yours to control.
{
  "$schema": "https://vega.github.io/schema/vega/v6.json",
  "title": {
    "text": "Share of all waiting done at each attempt",
    "subtitle": "Raw Vega: the pie is built from a transform, scales and an arc mark"
  },
  "width": 320,
  "height": 320,
  "autosize": "pad",
  "data": [
    {
      "name": "waits",
      "values": [
        {
          "attempt": "Attempts 0 to 4",
          "wait": 3.1
        },
        {
          "attempt": "Attempt 5",
          "wait": 3.2
        },
        {
          "attempt": "Attempt 6",
          "wait": 6.4
        },
        {
          "attempt": "Attempt 7",
          "wait": 10
        },
        {
          "attempt": "Attempt 8",
          "wait": 10
        },
        {
          "attempt": "Attempt 9",
          "wait": 10
        }
      ],
      "transform": [
        {
          "type": "pie",
          "field": "wait",
          "sort": false
        }
      ]
    }
  ],
  "scales": [
    {
      "name": "color",
      "type": "ordinal",
      "domain": {
        "data": "waits",
        "field": "attempt"
      },
      "range": "category"
    }
  ],
  "legends": [
    {
      "fill": "color",
      "orient": "bottom",
      "columns": 3
    }
  ],
  "marks": [
    {
      "type": "arc",
      "from": {
        "data": "waits"
      },
      "encode": {
        "enter": {
          "fill": {
            "scale": "color",
            "field": "attempt"
          },
          "x": {
            "signal": "width / 2"
          },
          "y": {
            "signal": "height / 2"
          },
          "startAngle": {
            "field": "startAngle"
          },
          "endAngle": {
            "field": "endAngle"
          },
          "innerRadius": {
            "value": 70
          },
          "outerRadius": {
            "signal": "width / 2"
          },
          "padAngle": {
            "value": 0.015
          }
        },
        "update": {
          "fillOpacity": {
            "value": 1
          }
        },
        "hover": {
          "fillOpacity": {
            "value": 0.75
          }
        }
      }
    }
  ]
}
Charts are held to the same rules as everything else in this post. The specification is plain JSON and nothing in it is executed as code. A chart may read data files from this site only, so a pasted specification cannot quietly call out to somebody else’s server. Each chart carries a text label for screen readers, and the libraries load only on pages that contain a chart.
5. Does anyone support this in WordPress?
Every individual piece exists, but I could not find a single, actively maintained plugin that handles code, repository links, diagrams and charts together in the block editor. Several of the pieces that do exist are showing their age, and one should no longer be used at all.
Syntax highlighting
Here the ecosystem is healthy:
- Code Block Pro uses the same rendering engine as VS Code, supports line highlighting and a copy button, and is tested against WordPress 7.0. Its themes are set per block rather than site wide.
- Syntax-highlighting Code Block extends the core Code block with server side highlighting and loads no external scripts, which suits the performance argument above.
- Enlighter, Prismatic and Highlighting Code Block are all credible alternatives, depending on whether you favour the classic or block editor.
Linking to GitHub
Support thins out sharply here. It helps to assess three capabilities separately, because they are often conflated:
- Fetch at publication: the code is captured once, when the author publishes.
- Commit pinning: the snippet is tied to a specific SHA.
- Caching: repeated views avoid repeated fetches.
| Tool | Fetch at publication | Commit pinning | Caching |
|---|---|---|---|
| GetGit | Not documented | Not documented | Yes, advertised |
| WP Github Gist | No, uses gist-it | Not documented | Not documented |
| emgithub | No, in browser | Yes, via permalink | Browser only |
None of the three supports named regions. For emgithub it has been requested in an open issue.
GetGit offers a shortcode that pulls a file from a public repository with start and end lines and basic highlighting, and it explicitly advertises content caching. Caching alone does not make it a publication workflow, though. A cache is a performance measure that can expire or be cleared. It is not a record of what the article showed when it was published. GetGit’s directory listing also warns that it has not been tested with the last three major WordPress releases.
WP Github Gist supports line ranges too, but relies on the external gist-it service to fetch files, so it is only as reliable as that service.
emgithub, outside WordPress, embeds a file or a sliced line range from a permalink via a script or iframe, fetching and highlighting in the reader’s browser. Its own documentation suggests self hosting a fork in case the public service is compromised or changes. That tells you something about the trust model of loading third party script into your posts.
I did not find any of these combining fetching at publication, commit pinning, a saved snapshot and named regions.
Mermaid
Mermaid support is similarly fragmented.
- WP Mermaid was the best known option, but it is no longer a practical choice. Its WordPress.org listing states that the plugin was closed on 30 September 2024 because of a security issue and is not available for download. Sites still running it should remove it.
- CanaryBlue Diagrams for Mermaid offers live preview in the editor without calling an external rendering service. It is promising but very young.
- PlusMagi Blocks adds syntax error detection. It is also very young.
- WP Githuber MD comes closest to an all in one answer, combining a Markdown editor with Prism highlighting and Mermaid. It is a heavy price for an established site, though. It replaces the editing model entirely, stores Markdown in a separate column, recommends adopting it only on a new blog, and asks you to disable other Markdown plugins.
Charts
Chart plugins are plentiful and actively maintained. The three I looked at were all updated in September 2026:
- Visualizer draws with Google Charts, DataTables and Chart.js, and now includes a prompt based AI chart builder. Charts are placed with its Chart block or a shortcode.
- wpDataTables builds charts with a step by step wizard in the admin panel. The free version uses Google Charts and Chart.js, and the premium version adds Highcharts and ApexCharts.
- M Chart has you enter data in a spreadsheet style editor or import a CSV file, draws with Chart.js, and embeds the chart with a block or a shortcode.
They share one design choice that matters here. The chart is built in the plugin’s own screens, and the post holds a block or shortcode that points to it. That is the right model for a dashboard fed from a spreadsheet or a database. It is the wrong one for an article, for the same reason a live code embed is: the numbers can change without the post changing, the post’s revision history does not record what the chart showed, and the data cannot be read or reviewed in the post itself. I did not find one that draws a chart from text held in the post, which is what section 4 does.
6. What the complete solution would look like
What this site does today
This site runs my own plugin, CloudScale Cyber DevTools, which provides the syntax highlighting, the Mermaid rendering and the charts you see in this post. It does not yet implement the GitHub snapshot workflow described in section 2. That gap is why I went looking for an existing plugin, and the requirements below are what I would want from one, or what I would add to my own.
The plugin is free and open source. Download CloudScale Cyber DevTools as a zip and install it under Plugins, Add New, Upload Plugin. The Code Block help page documents every language, theme, diagram and chart format used in this post, with the source for each example.
Requirements
Section 2 sets out why the snapshot model is right. These are the implementation details that make it work.
What the revision stores. An author pastes a GitHub permalink, or a repository, file path and named region, into a single block. At publish time the plugin saves, as part of the article revision:
- the fetched source text
- the full commit SHA
- the file path
- the resolved line range
The highlighted HTML is a derivative. It can be regenerated from the saved source whenever the theme or highlighter changes, and it should not be treated as the record.
Failure handling. If a later fetch fails, or the repository is renamed, made private or deleted, the plugin keeps serving the last successfully published content and shows the author an error in the editor.
Change review. When the selected region’s content differs from the pinned version, the editor shows the published code, the new code and the surrounding prose side by side. The author either updates the pin and edits the explanation together, or deliberately keeps the old version.
Diagrams and Markdown. The plugin would:
- render fenced Mermaid blocks with a current version of the library
- prefer pre-rendered SVG, with a PNG fallback for email, where the host can run the CLI, and fall back to browser rendering, loaded only where needed, where it cannot
- theme diagrams for light and dark mode
- require a text explanation and support
accTitleandaccDescr - accept Markdown pasted from a README without forcing the whole site onto a Markdown editor
Charts. The same block would draw a chart from text in the post: a few lines of settings and series, or a pasted Chart.js, Vega or Vega-Lite specification. The source is saved in the revision like any other content, the chart follows the reader’s theme, and Copy hands the reader the picture while Source shows the text behind it. This part is built, and section 4 is the demonstration.
Security. Pulling content from elsewhere into a published page needs a few firm rules:
- Imported code is escaped and displayed, never executed or interpreted as HTML.
- Remote fetching is limited to approved GitHub endpoints, and the restriction is checked again after every redirect, not just against the initial URL, so a block cannot be used to make the server request arbitrary addresses.
- Access tokens for private repositories stay in server side configuration and never appear in saved revisions, rendered markup or error messages.
- Code fetched from a private repository is not published until the author explicitly acknowledges that it will become public. Keeping the token secret is not enough if the code it fetched is confidential.
- Mermaid defaults to its
strictsecurity level, which encodes HTML in labels and disables click interactions.
Why it matters
That combination changes the relationship between a blog and the code it describes. Instead of a frozen copy that decays from the day it is published, or a live embed that changes without the author knowing, the post becomes a preserved, traceable view of a specific version of a real repository. Updates happen because the author chose to make them, with diagrams and charts versioned alongside the code they explain. That is the standard technical writing on WordPress should be held to.
Want this on your own site? download CloudScale Cyber DevTools (free, zip), or read the Code Block help docs.
References
- Code Block Pro: https://wordpress.org/plugins/code-block-pro/
- Syntax-highlighting Code Block and other highlighters, Speckyboy round up: https://speckyboy.com/free-wordpress-plugin-display-edit-code/
- GetGit: https://wordpress.org/plugins/getgit/
- WP Github Gist: https://github.com/sudar/wp-github-gist
- emgithub: https://github.com/yusanshi/emgithub
- emgithub issue on marker based embedding: https://github.com/yusanshi/emgithub/issues/27
- WP Mermaid (closed listing): https://wordpress.org/plugins/wp-mermaid/
- CanaryBlue Diagrams for Mermaid: https://wordpress.org/plugins/canaryblue-diagrams-for-mermaid/
- WP Githuber MD: https://github.com/terrylinooo/githuber-md
- FSharp.Formatting Mermaid pattern: https://fsprojects.github.io/FSharp.Formatting/mermaid.html
- GitHub, getting permanent links to files: https://docs.github.com/en/repositories/working-with-files/using-files/getting-permanent-links-to-files
- GitHub, creating diagrams (Mermaid support and version): https://docs.github.com/en/get-started/writing-on-github/working-with-advanced-formatting/creating-diagrams
- Mermaid accessibility options (accTitle and accDescr): https://mermaid.js.org/config/accessibility.html
- Mermaid security level configuration: https://mermaid.js.org/config/usage.html#securitylevel
- Mermaid CLI: https://github.com/mermaid-js/mermaid-cli
- Visualizer: https://wordpress.org/plugins/visualizer/
- wpDataTables: https://wordpress.org/plugins/wpdatatables/
- M Chart: https://wordpress.org/plugins/m-chart/