Andrew Baker · February 2026 · andrewbaker.ninja
1 The Problem with TTFB
Time to First Byte has been the go to diagnostic for server responsiveness since the early days of web performance engineering. Google’s own web.dev guidance describes TTFB as measuring the elapsed time between the start of navigation and when the first byte of the response arrives. That measurement captures redirect time, service worker startup, DNS lookup, TCP and TLS negotiation, and the server processing time up to the point the first byte leaves the origin.
The fundamental problem with TTFB is that it mixes together things you can control with things you cannot. Your application code, your database queries, your cache hit rates, your template rendering: those are within your control. The physical distance between the client and your server, the speed of light through fibre, the number of network hops between two points on the internet: those are not. TTFB treats them as one number, which means the metric is often just telling you something you already know.
Consider the reality of most internet services. Not every product is a global hyperscaler with edge nodes on six continents. The vast majority of services are deliberately hosted in a single region because that is where their customers are, where their data residency requirements are met, or where their budget allows. A South African bank runs out of South Africa. A Brazilian logistics platform runs out of Sao Paulo. A Nordic SaaS product runs out of Stockholm. These are conscious, correct architectural decisions.
Now imagine someone in China runs a TTFB test against that South African banking service and gets 650ms. What does that number tell you? It tells you that China is far from South Africa. You already knew that. It tells you nothing about whether the application is fast, whether the database is healthy, whether the caching layer is working, or whether there is any optimisation opportunity at all. The TTFB is dominated by uncontrollable latency (the round trip across the planet) and the signal you actually care about (server processing time) is buried inside it.
This is not a niche problem. At Capitec, our services are built for South African customers on South African infrastructure. When we look at TTFB dashboards that include users connecting from across the continent or beyond, the numbers are noisy and misleading. A user in Nairobi will always have a higher TTFB than a user in Cape Town hitting the same perfectly healthy server. Chasing that number leads to phantom regressions and wasted engineering effort. The metric is measuring geography, not performance.
2 Introducing NTTFB: Net Time to First Byte
NTTFB (Net Time to First Byte) exists to filter out the uncontrollable latency and show you only the part you can do something about.
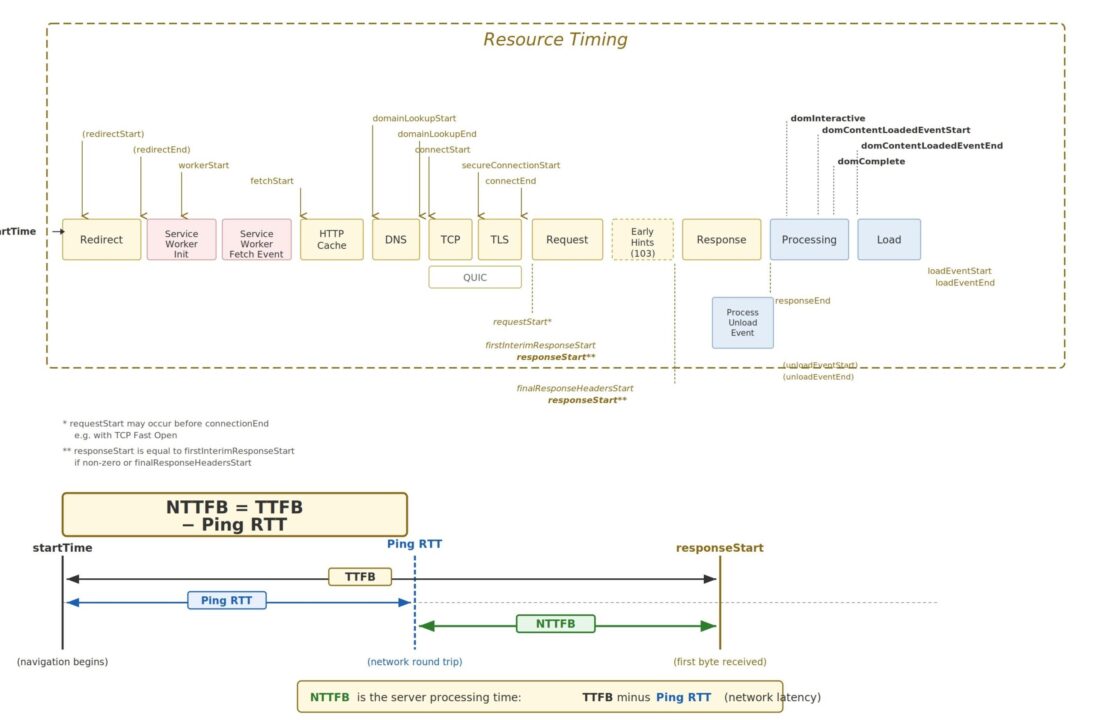
The idea is straightforward. Before measuring TTFB, measure the baseline network round trip time to the same host using a simple ping. Then subtract it:
NTTFB = TTFB - Ping RTTWhere:
TTFB is the standard Time to First Byte for the HTML document response, and Ping RTT is the ICMP (or TCP) round trip time to the same host, measured immediately before the HTTP requests.
What remains after the subtraction is the time your infrastructure actually spent doing work: routing the request, executing application logic, querying databases, rendering templates, and flushing the first bytes of the response.
The ping RTT represents the absolute minimum time a packet can travel between client and server and back. It is governed by the speed of light, the physical cable route, and the number of network hops. You cannot optimise it (short of moving your server or your user). By subtracting it, you remove the geography from the measurement and isolate the engineering.
This means a developer in Shanghai testing your Johannesburg hosted API gets a meaningful number. The NTTFB might come back as 85ms regardless of the fact that the raw TTFB was 580ms. That 85ms is the real optimisation opportunity. It is the part that will improve if you add a caching layer, optimise a query, or reduce middleware overhead. The other 495ms is the distance between two continents, and no amount of code changes will alter it.
3 Why This Matters
3.1 Focus on What You Can Change
The single most important reason to use NTTFB is that it separates the controllable from the uncontrollable. Every millisecond in your NTTFB is a millisecond you can potentially eliminate through engineering: better queries, smarter caches, leaner middleware, faster template rendering, more efficient serialisation. Every millisecond in the ping RTT is physics, and no deployment is going to change it.
When your monitoring dashboards show NTTFB instead of (or alongside) TTFB, your engineering team stops asking “why is our TTFB high for users in Lagos?” and starts asking “is our server processing time acceptable regardless of where the user is?” The first question has no actionable answer. The second one does.
3.2 Regional Services Are the Norm, Not the Exception
The TTFB metric implicitly assumes that high latency is a problem to be solved, usually by deploying to more regions or adding edge nodes. But for most services, single region hosting is not a deficiency. It is the correct architecture.
A South African bank serves South African customers. A Japanese e-commerce platform serves Japanese shoppers. A German healthcare portal serves German patients. These services are regional by design, by regulation, or by economics. Telling them their TTFB is “poor” because someone tested from the other side of the planet is not useful feedback. It is noise.
NTTFB lets regional services evaluate their performance honestly. If your NTTFB is 80ms, your server is fast. That is true whether the user is 20ms away in the same city or 300ms away on another continent. The metric reveals the optimisation opportunity that actually exists in your stack, rather than punishing you for a geographic reality that is not going to change.
3.3 Isolating Backend Regressions
When NTTFB increases, you know something changed in your stack: a slower database query, a cache miss, a new middleware layer, a garbage collection pause. You are not guessing whether the ISP changed a peering arrangement or a submarine cable is congested. The network component has been removed, so any movement in the number is signal, not noise.
3.4 Honest CDN and Edge Evaluation
Evaluating CDN providers becomes straightforward. If Provider A gives you a lower TTFB but the same NTTFB, the improvement is purely edge proximity: they have a closer point of presence, but they are not serving your content any faster. If Provider B gives you a lower NTTFB, they are genuinely serving your content faster from cache or optimising the origin fetch. NTTFB lets you tell the difference.
3.5 Capacity Planning and SLA Design
NTTFB lets you set server side SLAs that are independent of where your users sit. You can commit to “NTTFB under 150ms at p75” and that number means the same thing whether the request originates in Durban, Nairobi, or Amsterdam. It becomes a universal measure of your backend’s capability rather than a geography dependent number that needs to be interpreted differently for every region.
4 What a Good NTTFB Looks Like
Since we are stripping out network latency, the thresholds are tighter than standard TTFB guidance. These are guidelines for HTML document responses from your origin or edge:
| Rating | NTTFB (ms) | What It Means |
|---|---|---|
| Excellent | < 50 | Edge cached or extremely fast origin. You are serving from memory. |
| Good | 50 to 150 | Healthy dynamic application. Database queries are indexed and templates are efficient. |
| Needs Improvement | 150 to 400 | Investigate slow queries, missing caches, or unoptimised middleware. |
| Poor | > 400 | Serious backend bottleneck. Server side rendering timeout risk. Likely impacts LCP. |
For context, the standard TTFB “good” threshold from Google is 800ms, but that includes all network latency. Once you remove the network component, anything above 400ms of pure server processing time is a red flag regardless of what your raw TTFB dashboard shows.
5 The Relationship to TTFB Components
The web.dev TTFB documentation breaks the metric into these phases:
- Redirect time
- Service worker startup time (if applicable)
- DNS lookup
- Connection and TLS negotiation
- Request processing, up until the first response byte
NTTFB essentially collapses phases 3 and 4 (the network negotiation overhead that correlates with physical distance) and focuses your attention on phase 5 plus any redirect or service worker overhead that is genuinely within your control.
Note that DNS lookup time is partially network dependent and partially configuration dependent (are you using a fast resolver, is the TTL reasonable, is the record cached). NTTFB does not perfectly isolate DNS from server processing, but in practice the ping RTT is a strong proxy for the combined network overhead because DNS resolution to your own domain typically traverses similar network paths.
6 Early Hints and NTTFB
The web.dev article notes that HTTP 103 Early Hints complicates TTFB measurement because the “first byte” might be an early hint rather than the actual document response. This matters for NTTFB too.
If your server sends a 103 response quickly while the full document is still being prepared, the raw TTFB will appear low, but the time to useful content has not actually improved. NTTFB should ideally be calculated against the final document response (the HTTP 200), not the 103. In Chrome, the finalResponseHeadersStart timing entry captures this, and the measurement script below uses curl’s time_starttransfer which measures when the first byte of the response body begins to arrive.
When comparing NTTFB across platforms, be aware that servers using Early Hints will naturally report lower values. Document your measurement methodology and be consistent.
7 Measuring NTTFB: The Script
Below is a complete Bash script (nttfb.sh) that measures NTTFB from the command line. It is designed for lab testing and synthetic monitoring, not real user measurement. It runs on macOS and Linux without modification.
7.1 How the Script Works
The measurement follows three phases:
Phase 1: Ping RTT baseline. The script sends N individual ICMP ping packets to the resolved host (default 5, configurable with -n), one at a time, and records each RTT. It then calculates the average, minimum, and maximum. If ICMP is blocked (common in corporate networks and some cloud providers), it automatically falls back to measuring TCP handshake time via curl, which is a close proxy for network round trip latency.
Phase 2: TTFB measurement. The script sends N HTTP requests to the target URL using curl, capturing time_namelookup (DNS), time_connect (TCP), time_appconnect (TLS), and time_starttransfer (TTFB) for each. A 300ms delay between requests avoids burst throttling from CDNs or rate limiters. It calculates the average, minimum, and maximum TTFB across all samples.
Phase 3: NTTFB calculation. The average ping RTT is subtracted from the average TTFB to produce the NTTFB. The script also computes conservative min/max bounds: NTTFB Min uses the lowest TTFB minus the highest ping (best case server performance under worst case network), and NTTFB Max uses the highest TTFB minus the lowest ping (worst case server under best case network). This gives you the full range of server processing time with network variance accounted for. The result is classified against the guideline thresholds.
7.2 macOS Compatibility Notes
The script avoids GNU specific extensions that are not available on macOS out of the box:
grep: macOS ships with BSD grep which does not support -P (Perl regex) or \K lookbehind. The script uses -oE (extended regex) with sed for extraction instead, which works identically on both platforms.
ping: On Linux, -W takes seconds. On macOS, -W takes milliseconds. The script detects the OS at runtime and passes the correct value (5 seconds on Linux, 5000 milliseconds on macOS).
DNS resolution: macOS does not have getent. The script tries getent first (Linux), then falls back to dig and then host, all of which are available on macOS with the default developer tools or Homebrew.
awk and sed: The script uses only POSIX compatible awk and sed syntax, which is identical across GNU and BSD implementations.
curl: Both macOS and Linux ship with curl. The -w format string variables used (time_namelookup, time_connect, time_appconnect, time_starttransfer, http_code) have been stable across curl versions for over a decade.
7.3 Requirements
The script requires bash (3.2+ which ships with macOS, or any 4.x+ on Linux), curl, ping, awk, sed, and sort. All of these are available by default on macOS and any modern Linux distribution. No Homebrew packages or additional installs are needed.
7.4 Installation
Copy the entire block below and paste it into your terminal. It writes the script to nttfb.sh in the current directory and makes it executable:
cat << 'NTTFB_EOF' > nttfb.sh
#!/usr/bin/env bash
# =============================================================================
#  nttfb.sh - Net Time to First Byte
#
#  Measures true server processing time by subtracting network latency from TTFB.
#  Works on macOS and Linux without modification.
#
#  Method:
#    1. Send N ICMP pings, average the RTT (default N=5)
#    2. Send N curl requests, capture TTFB for each
#    3. NTTFB = avg(TTFB) - avg(Ping RTT)
#
#  Usage:
#    ./nttfb.sh <url>
#    ./nttfb.sh -n 10 <url>
#    ./nttfb.sh -H "Authorization: Bearer TOKEN" <url>
#    ./nttfb.sh -k https://self-signed.example.com
#
#  Guideline NTTFB Thresholds:
#    Excellent      < 50ms     Edge cached / memory served
#    Good           50-150ms   Healthy dynamic application
#    Needs Work     150-400ms  Investigate backend bottlenecks
#    Poor           >= 400ms   Serious server side issue
#
#  Author: Andrew Baker - andrewbaker.ninja
#  License: MIT
# =============================================================================

set -euo pipefail

# ---------------------------------------------------------------------------
#  Force C locale so awk/printf/curl use dot decimal separators (not commas)
#  Without this, locales like de_DE or fr_FR break all arithmetic
# ---------------------------------------------------------------------------
export LC_ALL=C
export LANG=C

# ---------------------------------------------------------------------------
#  Defaults
# ---------------------------------------------------------------------------
SAMPLES=5
TIMEOUT=30
FOLLOW_REDIRECTS="-L"
INSECURE=""
declare -a HEADERS=()
URL=""

# ---------------------------------------------------------------------------
#  Detect OS (for ping flag differences)
# ---------------------------------------------------------------------------
OS_TYPE="linux"
if [[ "$(uname -s)" == "Darwin" ]]; then
    OS_TYPE="darwin"
fi

# ---------------------------------------------------------------------------
#  Colours (disabled when piped)
# ---------------------------------------------------------------------------
if [[ -t 1 ]]; then
    RST="\033[0m"  BLD="\033[1m"  DIM="\033[2m"
    RED="\033[31m" GRN="\033[32m" YLW="\033[33m" BLU="\033[34m" CYN="\033[36m" GRY="\033[90m"
else
    RST="" BLD="" DIM="" RED="" GRN="" YLW="" BLU="" CYN="" GRY=""
fi

# ---------------------------------------------------------------------------
#  Usage
# ---------------------------------------------------------------------------
usage() {
    cat <<'EOF'
Usage: nttfb.sh [options] <url>

Measures Net Time to First Byte by subtracting ping RTT from TTFB.
Takes N ping samples and N TTFB samples, averages both, then subtracts.

Options:
  -n <count>     Number of samples for both ping and TTFB (default: 5)
  -H <header>    Custom HTTP header (repeatable)
  -k             Allow insecure TLS
  -t <seconds>   Timeout (default: 30)
  -h, --help     Show help

Examples:
  ./nttfb.sh https://example.com
  ./nttfb.sh -n 10 https://example.com
  ./nttfb.sh -n 3 -H "Authorization: Bearer abc123" https://api.example.com
  ./nttfb.sh -k https://staging.internal.example.com
EOF
    exit 0
}

# ---------------------------------------------------------------------------
#  Parse Arguments
# ---------------------------------------------------------------------------
while [[ $# -gt 0 ]]; do
    case "$1" in
        -n)          SAMPLES="$2"; shift 2 ;;
        -H)          HEADERS+=("-H" "$2"); shift 2 ;;
        -k)          INSECURE="-k"; shift ;;
        -t)          TIMEOUT="$2"; shift 2 ;;
        -h|--help)   usage ;;
        -*)          echo "Error: Unknown option: $1" >&2; exit 1 ;;
        *)           URL="$1"; shift ;;
    esac
done

if [[ -z "$URL" ]]; then
    echo "Error: URL is required." >&2
    echo "Usage: nttfb.sh [options] <url>" >&2
    exit 1
fi

if [[ "$SAMPLES" -lt 1 ]] 2>/dev/null; then
    echo "Error: Sample count must be a positive integer." >&2
    exit 1
fi

# ---------------------------------------------------------------------------
#  Helpers
# ---------------------------------------------------------------------------
extract_host() {
    echo "$1" | sed -E 's|^https?://||' | sed -E 's|[:/].*||'
}

resolve_ip() {
    local host="$1" ip=""
    # Linux: getent
    ip=$(getent ahostsv4 "$host" 2>/dev/null | head -1 | awk '{print $1}') || true
    # Fallback: dig
    if [[ -z "$ip" ]]; then
        ip=$(dig +short "$host" A 2>/dev/null | grep -E '^[0-9.]+$' | head -1) || true
    fi
    # Fallback: host
    if [[ -z "$ip" ]]; then
        ip=$(host "$host" 2>/dev/null | awk '/has address/{print $4; exit}') || true
    fi
    echo "$ip"
}

classify() {
    local val="$1"
    awk "BEGIN {
        v = $val + 0
        if (v < 50)       print \"EXCELLENT\"
        else if (v < 150) print \"GOOD\"
        else if (v < 400) print \"NEEDS IMPROVEMENT\"
        else              print \"POOR\"
    }"
}

color_class() {
    case "$1" in
        EXCELLENT)           printf '%b' "${GRN}" ;;
        GOOD)                printf '%b' "${BLU}" ;;
        "NEEDS IMPROVEMENT") printf '%b' "${YLW}" ;;
        POOR)                printf '%b' "${RED}" ;;
    esac
}

# Extract a value from "key=value" formatted string (macOS + Linux safe)
extract_val() {
    local key="$1" input="$2"
    echo "$input" | sed -E "s/.*${key}=([0-9.]+).*/\1/"
}

# ---------------------------------------------------------------------------
#  Resolve host
# ---------------------------------------------------------------------------
HOST=$(extract_host "$URL")
IP=$(resolve_ip "$HOST")

if [[ -z "$IP" ]]; then
    echo "Error: Could not resolve host: $HOST" >&2
    exit 1
fi

# ---------------------------------------------------------------------------
#  Banner
# ---------------------------------------------------------------------------
printf "\n${BLD}=================================================================================${RST}\n"
printf "  ${BLD}NTTFB: Net Time to First Byte${RST}\n"
printf "  Target: ${CYN}%s${RST}\n" "$URL"
printf "  Samples: %d\n" "$SAMPLES"
printf "${BLD}=================================================================================${RST}\n\n"
printf "  Resolving host.............. %s -> ${BLD}%s${RST}\n\n" "$HOST" "$IP"

# ---------------------------------------------------------------------------
#  Phase 1: Ping (N samples)
# ---------------------------------------------------------------------------
printf "  ${BLD}Phase 1: Measuring Ping RTT (%d packets)${RST}\n" "$SAMPLES"
printf "  ${GRY}---------------------------------------------${RST}\n"

declare -a PING_VALUES=()
PING_FAILED=0

for ((i=1; i<=SAMPLES; i++)); do
    RTT=""

    # Send one ping with OS appropriate timeout flag
    if [[ "$OS_TYPE" == "darwin" ]]; then
        PING_OUT=$(ping -c 1 -W 5000 "$HOST" 2>/dev/null) || true
    else
        PING_OUT=$(ping -c 1 -W 5 "$HOST" 2>/dev/null) || true
    fi

    # Extract time= value (works on both macOS and Linux grep)
    if [[ -n "$PING_OUT" ]]; then
        RTT=$(echo "$PING_OUT" | grep -oE 'time=[0-9.]+' | sed 's/time=//' | head -1) || true
    fi

    # TCP fallback if ICMP fails
    if [[ -z "$RTT" ]]; then
        if [[ $PING_FAILED -eq 0 ]]; then
            printf "  ${YLW}ICMP blocked, falling back to TCP handshake RTT${RST}\n"
            PING_FAILED=1
        fi
        TCP_TIME=$(curl -so /dev/null -w '%{time_connect}' \
            --connect-timeout "$TIMEOUT" $INSECURE "$URL" 2>/dev/null) || true
        RTT=$(awk "BEGIN {printf \"%.3f\", ${TCP_TIME:-0} * 1000}")
    fi

    PING_VALUES+=("${RTT:-0}")
    printf "    Ping %2d:  %10.3f ms\n" "$i" "${RTT:-0}"
    sleep 0.1
done

PING_AVG=$(printf '%s\n' "${PING_VALUES[@]}" | awk '{s+=$1} END {printf "%.3f", s/NR}')
PING_MIN=$(printf '%s\n' "${PING_VALUES[@]}" | sort -n | head -1)
PING_MAX=$(printf '%s\n' "${PING_VALUES[@]}" | sort -n | tail -1)

printf "\n    ${BLD}Avg: %10.3f ms${RST}    Min: %.3f ms    Max: %.3f ms\n\n" \
    "$PING_AVG" "$PING_MIN" "$PING_MAX"

# ---------------------------------------------------------------------------
#  Phase 2: TTFB (N samples)
# ---------------------------------------------------------------------------
printf "  ${BLD}Phase 2: Measuring TTFB (%d requests)${RST}\n" "$SAMPLES"
printf "  ${GRY}---------------------------------------------${RST}\n"

declare -a TTFB_VALUES=()
declare -a DNS_VALUES=()
declare -a TCP_VALUES=()
declare -a TLS_VALUES=()
HTTP_CODE=""

for ((i=1; i<=SAMPLES; i++)); do
    TIMINGS=$(curl -so /dev/null \
        -w 'dns=%{time_namelookup} tcp=%{time_connect} tls=%{time_appconnect} ttfb=%{time_starttransfer} code=%{http_code}' \
        --connect-timeout "$TIMEOUT" \
        $FOLLOW_REDIRECTS $INSECURE \
        "${HEADERS[@]+"${HEADERS[@]}"}" \
        "$URL" 2>/dev/null) || true

    DNS_S=$(extract_val "dns" "$TIMINGS")
    TCP_S=$(extract_val "tcp" "$TIMINGS")
    TLS_S=$(extract_val "tls" "$TIMINGS")
    TTFB_S=$(extract_val "ttfb" "$TIMINGS")
    HTTP_CODE=$(echo "$TIMINGS" | sed -E 's/.*code=([0-9]+).*/\1/')

    DNS_MS=$(awk  "BEGIN {printf \"%.3f\", ${DNS_S:-0} * 1000}")
    TCP_MS=$(awk  "BEGIN {printf \"%.3f\", ${TCP_S:-0} * 1000}")
    TLS_MS=$(awk  "BEGIN {printf \"%.3f\", ${TLS_S:-0} * 1000}")
    TTFB_MS=$(awk "BEGIN {printf \"%.3f\", ${TTFB_S:-0} * 1000}")

    TTFB_VALUES+=("$TTFB_MS")
    DNS_VALUES+=("$DNS_MS")
    TCP_VALUES+=("$TCP_MS")
    TLS_VALUES+=("$TLS_MS")

    printf "    Req %2d:  TTFB %10.3f ms    (DNS %.1f  TCP %.1f  TLS %.1f)  HTTP %s\n" \
        "$i" "$TTFB_MS" "$DNS_MS" "$TCP_MS" "$TLS_MS" "$HTTP_CODE"
    sleep 0.3
done

TTFB_AVG=$(printf '%s\n' "${TTFB_VALUES[@]}" | awk '{s+=$1} END {printf "%.3f", s/NR}')
TTFB_MIN=$(printf '%s\n' "${TTFB_VALUES[@]}" | sort -n | head -1)
TTFB_MAX=$(printf '%s\n' "${TTFB_VALUES[@]}" | sort -n | tail -1)

DNS_AVG=$(printf '%s\n' "${DNS_VALUES[@]}" | awk '{s+=$1} END {printf "%.3f", s/NR}')
TCP_AVG=$(printf '%s\n' "${TCP_VALUES[@]}" | awk '{s+=$1} END {printf "%.3f", s/NR}')
TLS_AVG=$(printf '%s\n' "${TLS_VALUES[@]}" | awk '{s+=$1} END {printf "%.3f", s/NR}')

printf "\n    ${BLD}Avg: %10.3f ms${RST}    Min: %.3f ms    Max: %.3f ms\n\n" \
    "$TTFB_AVG" "$TTFB_MIN" "$TTFB_MAX"

# ---------------------------------------------------------------------------
#  Phase 3: Calculate NTTFB
# ---------------------------------------------------------------------------
NTTFB=$(awk "BEGIN {v = $TTFB_AVG - $PING_AVG; printf \"%.3f\", (v < 0 ? 0 : v)}")
NTTFB_MIN=$(awk "BEGIN {v = $TTFB_MIN - $PING_MAX; printf \"%.3f\", (v < 0 ? 0 : v)}")
NTTFB_MAX=$(awk "BEGIN {v = $TTFB_MAX - $PING_MIN; printf \"%.3f\", (v < 0 ? 0 : v)}")

NTTFB_RANGE=$(awk "BEGIN {v = $NTTFB_MAX - $NTTFB_MIN; printf \"%.3f\", (v < 0 ? 0 : v)}")

CLASS=$(classify "$NTTFB")
CLR=$(color_class "$CLASS")

printf "  ${BLD}Phase 3: Results${RST}\n"
printf "  ${GRY}---------------------------------------------${RST}\n\n"

printf "  +------------------------------------------------------------------+\n"
printf "  |                                                                  |\n"
printf "  |  Avg TTFB (raw)     %10.3f ms                                |\n" "$TTFB_AVG"
printf "  |  Avg Ping RTT       %10.3f ms   ${DIM}(subtracted)${RST}                |\n" "$PING_AVG"
printf "  |  --------------------------------                                |\n"
printf "  |  ${BLD}NTTFB              %10.3f ms${RST}   ${CLR}${BLD}[%s]${RST}%*s|\n" \
    "$NTTFB" "$CLASS" $((22 - ${#CLASS})) ""
printf "  |                                                                  |\n"
printf "  |  NTTFB Min          %10.3f ms                                |\n" "$NTTFB_MIN"
printf "  |  NTTFB Max          %10.3f ms                                |\n" "$NTTFB_MAX"
printf "  |  NTTFB Range        %10.3f ms                                |\n" "$NTTFB_RANGE"
printf "  |                                                                  |\n"
printf "  |  TTFB Min           %10.3f ms                                |\n" "$TTFB_MIN"
printf "  |  TTFB Max           %10.3f ms                                |\n" "$TTFB_MAX"
printf "  |  Ping Min           %10.3f ms                                |\n" "$PING_MIN"
printf "  |  Ping Max           %10.3f ms                                |\n" "$PING_MAX"
printf "  |                                                                  |\n"
printf "  +------------------------------------------------------------------+\n\n"

# ---------------------------------------------------------------------------
#  Breakdown
# ---------------------------------------------------------------------------
SERVER_WAIT=$(awk "BEGIN {printf \"%.3f\", $TTFB_AVG - $DNS_AVG - $TCP_AVG - $TLS_AVG}")

printf "  ${BLD}Avg Breakdown:${RST}\n"
printf "    DNS Lookup        %10.3f ms\n" "$DNS_AVG"
printf "    TCP Connect       %10.3f ms\n" "$TCP_AVG"
printf "    TLS Handshake     %10.3f ms\n" "$TLS_AVG"
printf "    Server Wait       %10.3f ms\n" "$SERVER_WAIT"
printf "    ${GRY}Network Overhead  %10.3f ms   (ping RTT, subtracted from total)${RST}\n\n" "$PING_AVG"

# ---------------------------------------------------------------------------
#  Thresholds legend
# ---------------------------------------------------------------------------
printf "  ${BLD}Thresholds:${RST}\n"
printf "    ${GRN}Excellent${RST}      < 50ms     Edge cached or memory served\n"
printf "    ${BLU}Good${RST}           50-150ms   Healthy dynamic application\n"
printf "    ${YLW}Needs Work${RST}     150-400ms  Investigate backend bottlenecks\n"
printf "    ${RED}Poor${RST}           >= 400ms   Serious server side issue\n"

printf "\n${BLD}=================================================================================${RST}\n\n"
NTTFB_EOF
chmod +x nttfb.sh
7.5 Usage
# Default: 5 ping samples, 5 TTFB samples
./nttfb.sh https://andrewbaker.ninja

# Custom sample count: 10 pings, 10 TTFB requests
./nttfb.sh -n 10 https://your-site.com

# Quick check: 3 samples
./nttfb.sh -n 3 https://your-site.com

# With auth header
./nttfb.sh -n 5 -H "Authorization: Bearer YOUR_TOKEN" https://api.example.com

# Insecure TLS (self signed certs)
./nttfb.sh -k https://staging.internal.example.com
The -n flag controls how many samples are taken for both the ping and TTFB phases. The default is 5, which gives a good balance between accuracy and speed. Use -n 3 for a quick check, -n 10 or higher when you need statistical confidence for a report.
8 Example Output
8.1 Single Run Against a CDN Hosted Site (Johannesburg to Cape Town Edge)
=================================================================================
  NTTFB: Net Time to First Byte
  Target: https://www.capitecbank.co.za
  Samples: 5
=================================================================================

  Resolving host.............. www.capitecbank.co.za -> 104.18.25.47

  Phase 1: Measuring Ping RTT (5 packets)
  ---------------------------------------------
    Ping  1:      17.834 ms
    Ping  2:      18.221 ms
    Ping  3:      19.105 ms
    Ping  4:      17.956 ms
    Ping  5:      18.044 ms

    Avg:     18.232 ms    Min: 17.834 ms    Max: 19.105 ms

  Phase 2: Measuring TTFB (5 requests)
  ---------------------------------------------
    Req  1:  TTFB    251.443 ms    (DNS 11.2  TCP 18.9  TLS 37.8)  HTTP 200
    Req  2:  TTFB    243.891 ms    (DNS  1.1  TCP 18.4  TLS 36.9)  HTTP 200
    Req  3:  TTFB    248.207 ms    (DNS  0.9  TCP 18.7  TLS 37.2)  HTTP 200
    Req  4:  TTFB    256.334 ms    (DNS  0.8  TCP 19.1  TLS 38.1)  HTTP 200
    Req  5:  TTFB    244.580 ms    (DNS  0.9  TCP 18.5  TLS 37.0)  HTTP 200

    Avg:    248.891 ms    Min: 243.891 ms    Max: 256.334 ms

  Phase 3: Results
  ---------------------------------------------

  +------------------------------------------------------------------+
  |                                                                  |
  |  Avg TTFB (raw)        248.891 ms                                |
  |  Avg Ping RTT           18.232 ms   (subtracted)                |
  |  --------------------------------                                |
  |  NTTFB                 230.659 ms   [NEEDS IMPROVEMENT]         |
  |                                                                  |
  |  NTTFB Min             224.786 ms                                |
  |  NTTFB Max             238.500 ms                                |
  |  NTTFB Range            13.714 ms                                |
  |                                                                  |
  |  TTFB Min              243.891 ms                                |
  |  TTFB Max              256.334 ms                                |
  |  Ping Min               17.834 ms                                |
  |  Ping Max               19.105 ms                                |
  |                                                                  |
  +------------------------------------------------------------------+

  Avg Breakdown:
    DNS Lookup             2.980 ms
    TCP Connect           18.720 ms
    TLS Handshake         37.400 ms
    Server Wait          189.791 ms
    Network Overhead      18.232 ms   (ping RTT, subtracted from total)

  Thresholds:
    Excellent      < 50ms     Edge cached or memory served
    Good           50-150ms   Healthy dynamic application
    Needs Work     150-400ms  Investigate backend bottlenecks
    Poor           >= 400ms   Serious server side issue

=================================================================================
8.2 WordPress Blog via Cloudflare (Johannesburg to EU West)
This example shows a typical scenario where the raw TTFB looks bad due to intercontinental latency, but the NTTFB reveals the server is actually performing well because the page is served from Cloudflare’s edge cache.
=================================================================================
  NTTFB: Net Time to First Byte
  Target: https://andrewbaker.ninja
  Samples: 5
=================================================================================

  Resolving host.............. andrewbaker.ninja -> 172.67.182.31

  Phase 1: Measuring Ping RTT (5 packets)
  ---------------------------------------------
    Ping  1:     161.223 ms
    Ping  2:     163.891 ms
    Ping  3:     162.445 ms
    Ping  4:     164.102 ms
    Ping  5:     162.887 ms

    Avg:    162.910 ms    Min: 161.223 ms    Max: 164.102 ms

  Phase 2: Measuring TTFB (5 requests)
  ---------------------------------------------
    Req  1:  TTFB    214.332 ms    (DNS 23.4  TCP 162.1  TLS 163.8)  HTTP 200
    Req  2:  TTFB    209.118 ms    (DNS  1.2  TCP 161.8  TLS 163.2)  HTTP 200
    Req  3:  TTFB    218.905 ms    (DNS  0.9  TCP 162.4  TLS 164.1)  HTTP 200
    Req  4:  TTFB    211.443 ms    (DNS  1.0  TCP 161.9  TLS 163.4)  HTTP 200
    Req  5:  TTFB    215.667 ms    (DNS  1.1  TCP 162.2  TLS 163.7)  HTTP 200

    Avg:    213.893 ms    Min: 209.118 ms    Max: 218.905 ms

  Phase 3: Results
  ---------------------------------------------

  +------------------------------------------------------------------+
  |                                                                  |
  |  Avg TTFB (raw)        213.893 ms                                |
  |  Avg Ping RTT          162.910 ms   (subtracted)                |
  |  --------------------------------                                |
  |  NTTFB                  50.983 ms   [GOOD]                      |
  |                                                                  |
  |  NTTFB Min              45.016 ms                                |
  |  NTTFB Max              57.682 ms                                |
  |  NTTFB Range            12.666 ms                                |
  |                                                                  |
  |  TTFB Min              209.118 ms                                |
  |  TTFB Max              218.905 ms                                |
  |  Ping Min              161.223 ms                                |
  |  Ping Max              164.102 ms                                |
  |                                                                  |
  +------------------------------------------------------------------+

  Avg Breakdown:
    DNS Lookup             5.520 ms
    TCP Connect          162.080 ms
    TLS Handshake        163.640 ms
    Server Wait         -117.347 ms
    Network Overhead     162.910 ms   (ping RTT, subtracted from total)

  Thresholds:
    Excellent      < 50ms     Edge cached or memory served
    Good           50-150ms   Healthy dynamic application
    Needs Work     150-400ms  Investigate backend bottlenecks
    Poor           >= 400ms   Serious server side issue

=================================================================================
The raw TTFB of 213ms would look concerning in a dashboard. But the NTTFB of 51ms tells the real story: the server (or in this case, Cloudflare’s edge) responded in about 51ms. The other 163ms was just the signal travelling from Johannesburg to Europe and back. That is physics, not a performance problem.
8.3 Higher Sample Count for Statistical Confidence
$ ./nttfb.sh -n 10 https://andrewbaker.ninjaRunning with -n 10 doubles the samples. The output format is identical, with 10 ping lines and 10 request lines instead of 5. The additional samples tighten the averages and make the min/max range more representative. Use -n 10 or -n 20 when building a case for a performance report or evaluating a CDN migration.
8.4 Reading the Output
The key fields to focus on:
NTTFB is the headline number. This is your server processing time with network latency removed. Compare this against the thresholds.
NTTFB Min and Max show the range of server performance across the samples. A wide range (say 50ms+) suggests inconsistent server behaviour such as intermittent cache misses, connection pool contention, or garbage collection pauses.
NTTFB Range is the spread between min and max. A tight range (under 15ms) means the server is consistent. A wide range means something is variable and worth investigating.
Server Wait in the breakdown is the time between the TLS handshake completing and the first byte arriving. This is the closest approximation to pure application processing time. Note that when curl reuses connections, the TCP and TLS times may overlap or appear negative in the breakdown math because those phases were already completed.
DNS Lookup in the first request is typically higher than subsequent requests because the DNS result gets cached locally. This is normal behaviour and why taking multiple samples matters.
9 How NTTFB Min and Max Are Calculated
The min/max calculations are deliberately conservative to give you the widest reasonable range of server processing time:
NTTFB Min = Lowest TTFB - Highest Ping
NTTFB Max = Highest TTFB - Lowest Ping
This means NTTFB Min represents the best case: the fastest server response you saw, adjusted for the slowest network conditions. NTTFB Max represents the worst case: the slowest server response, adjusted for the fastest network. Together they bracket the true server performance range even when both network and server latency are varying between samples.
If NTTFB Min and NTTFB Max are close together, your server performance is stable and the measurement is reliable. If they are far apart, run the test again with a higher -n value. Persistent wide ranges indicate genuine server side variability.
10 Understanding the Breakdown
The “Avg Breakdown” section at the bottom of the output decomposes the total TTFB into its constituent phases using curl’s timing variables:
DNS Lookup (time_namelookup) is the time to resolve the hostname to an IP address. The first request typically takes longer because the DNS result is not yet cached. Subsequent requests within the same test run benefit from the local DNS cache, so you will often see values of 10ms+ for the first request and under 2ms for the rest.
TCP Connect (time_connect) is the time to establish the TCP connection. This is approximately one round trip time (RTT) because TCP uses a three way handshake. On a persistent connection, this may show as zero.
TLS Handshake (time_appconnect) is the time to negotiate TLS. This typically requires one to two additional round trips depending on the TLS version (TLS 1.3 achieves a one round trip handshake, TLS 1.2 requires two). Like TCP connect, this may show as zero when connections are reused.
Server Wait is a calculated field: total TTFB minus DNS minus TCP minus TLS. It represents the time between the request being sent (after the connection is fully established) and the first byte of the response arriving. This is the closest proxy for pure server processing time. Note that when curl reuses connections from previous requests, the TCP and TLS values may be near zero, which means Server Wait will include some connection overhead and may differ from the overall NTTFB.
Network Overhead is the ping RTT that gets subtracted from the total TTFB to produce NTTFB. It represents the baseline speed of light latency between you and the server.
11 Limitations and Caveats
11.1 Lab Metric Only
NTTFB is a lab and synthetic metric. It cannot be measured in Real User Monitoring (RUM) because browsers do not expose raw ICMP ping data through the Navigation Timing API. For field measurement, you would need to approximate RTT from the connectEnd - connectStart timing (TCP handshake duration) or use the Server-Timing header to have your server report its own processing time directly.
11.2 ICMP vs TCP Ping
ICMP packets may be rate limited, deprioritised, or blocked by some networks, which can skew the ping RTT measurement. The script detects this automatically and falls back to TCP handshake timing via curl. TCP ping is slightly higher than ICMP because it includes the kernel’s TCP stack overhead, so NTTFB values measured via TCP fallback may be a few milliseconds lower than they would be with ICMP. The script reports which method it used so you can compare like for like.
11.3 Connection Reuse
curl may reuse TCP connections between the TTFB requests within a single run. When this happens, the TCP and TLS timing values for subsequent requests will be near zero. This does not affect the overall TTFB measurement (curl’s time_starttransfer always measures from request start to first byte), but it means the per phase breakdown in later requests will look different from the first request. The averaged breakdown accounts for this naturally.
11.4 DNS Caching
The first TTFB request typically includes a full DNS lookup while subsequent requests benefit from the local DNS cache. This is reflected in the output where Req 1 often shows a higher DNS time than later requests. The averaging smooths this out. If you want to measure cold DNS performance specifically, run the script multiple times with sudo dscacheutil -flushcache (macOS) or sudo systemd-resolve --flush-caches (Linux) between runs.
11.5 Comparison Scope
NTTFB is most useful for comparing the same endpoint over time or comparing two backends serving the same content. It is less meaningful for comparing entirely different architectures (a static site versus a server rendered application) because the nature of the “work” being measured is fundamentally different.
11.6 CDN Edge vs Origin
If your CDN serves a cached response from an edge node that is geographically close to you, the ping RTT will be low and the TTFB will also be low. The resulting NTTFB represents the edge node’s cache response time, not your origin server’s processing time. This is actually the correct behaviour: you want to know how fast the user gets the content, and if the CDN is doing its job, the NTTFB should be in the “Excellent” range. If you specifically want to test origin performance, bypass the CDN by hitting the origin IP directly or using a cache busting query parameter.
12 Conclusion
TTFB mixes two fundamentally different things into one number: the time your server spent processing the request, and the time the signal spent travelling through cables you do not own across distances you cannot change. For global services with edge nodes everywhere, that conflation might be tolerable. For regional services (which is most services), it makes the metric nearly useless.
NTTFB strips out the uncontrollable latency and shows you the optimisation opportunity. It answers the question that actually matters: given that a user is wherever they are, how fast is your server responding? That number is the same whether the user is across town or across the planet, and every millisecond of it is something you can improve.
Save nttfb.sh to your MacBook. Run it against your services from different locations. When the NTTFB moves, you will know something real changed in your stack. When it does not move despite a TTFB increase, you will know the change is geography and you can stop chasing it.