
AWS Security Group Hardening Using VPC Flow Log Analysis: sg-tightener Finds Over Provisioning and Tightens It on a Timeline

AWS Security Group Hardening Using VPC Flow Log Analysis: sg-tightener Finds Over Provisioning and Tightens It on a TimelineAndrew Baker's Technology Blog Posts, 22/Nov/2026
https://andrewbaker.ninja/2026/11/22/aws-security-group-hardening-using-vpc-flow-log-analysis-introducing-sg-tightener/


A free, open source tool that takes every AWS security group in an account (or a whole OU) into a local database, reads months of VPC flow logs, shows how many addresses each rule lets in that never connected, and pulls those rules back by source type and attribution. It reports first, applies only when you say so, with a second person’s approval, and shows you within minutes if a tightening cut someone off.
Security groups should no longer be treated as static configuration: big IP buckets written once into Terraform and never touched again. Every address a group lets in is risk, and that risk has to be managed down continuously.
Large on-premises CIDR blocks are a massive backhaul risk. When account after account trusts “the corporate network” (10.0.0.0/8) or “the data centre /16”, every laptop, build server and forgotten VM behind the VPN or Direct Connect can reach every one of those accounts. One compromised on-premises host then has a pathway to every AWS account in the estate.
Shrinking those pools needs a management and observability mechanism, not a one-off clean-up. Teams need evidence of who actually connects, a view of every network and its CIDR blocks, a timeline that shows the moment a change cuts someone off, and a second person’s approval before anything is applied. Without that oversight nobody has the confidence to take a range away, so the ranges only grow. sg-tightener is that mechanism.
In South Africa’s Cyber Hack Wave: AI Attackers Move in Minutes, Defenders Take Weeks I asked three questions every board should be able to answer. The third was: if an attacker took over one laptop this afternoon, how far could they get before we noticed? In most AWS estates the honest answer is “a long way”, and a large part of the reason is the humble security group.
Security groups are usually written once, by hand, by someone who did not know exactly who would call the service. A security group holds only about 60 rules, so people do the one thing that is sure to work: they let in whole blocks. 10.0.0.0/8 for “the corporate network” is 16.7 million addresses. A /16 for “the data centre” is 65,536. The database behind it may have a dozen real callers. The rules only ever grow, because removing a range might break something nobody can name. And trust follows the network, not the caller: any compromised laptop, build server or forgotten VM in that range can reach your databases and admin ports directly. With intruders moving from a first foothold to a second system in under half an hour, a flat trust zone is exactly what turns one compromised host into a breach of the estate.
sg-tightener treats every address a security group lets in as risk to be minimised, and uses VPC flow logs as the evidence for who actually needs in.
Here is what is in this post:
- Getting started
- See the over provisioning
- Tighten on the timeline, by type and attribution
- Mistakes show up in minutes, and are put back in one step
- Blast radius: how far could one compromised host get?
- Security groups live in a local database, not in Terraform
- Surveillance first, then apply per account, per group or per asset
- One console, with two person approval
- Rejected traffic: internal or external, IPv6, new, scanning
- Managing the risk: what to do first
1. Getting started
git clone https://github.com/andrewbakercloudscale/sg-tightener.git
cd sg-tightener
./install.sh
source .venv/bin/activate

# See it with no AWS access
python sg_review.py demo

# Your account: import the groups, read 90 days, write the page
aws sso login --profile prod
python sg_db.py import --regions eu-west-1 --profile prod
python sg_review.py read --regions eu-west-1 --days 90
python sg_review.py report

# Or skip the commands: an always running console where you sign in with AWS SSO
python sg_console.py install
Everything is free and open source under the MIT licence, needs Python 3.9 or later, and runs with read only permissions until you choose to switch an account to enforce mode. install.sh creates the virtual environment, installs every Python package it needs (boto3, pandas, openpyxl, PyYAML), checks each one loads, and downloads the public address lists, including the Tor exit list and the threat lists, once. There is no server or hosted database to run: security groups, rules and the audit trail live in a single SQLite file (~/.sg-tightener/sg.db).
2. See the over provisioning
sg_review.py writes one account’s inbound rules, set against months of flow logs, as a single self contained HTML page. It needs read only access, and python sg_review.py demo shows the whole thing for a made up account with no AWS access at all.
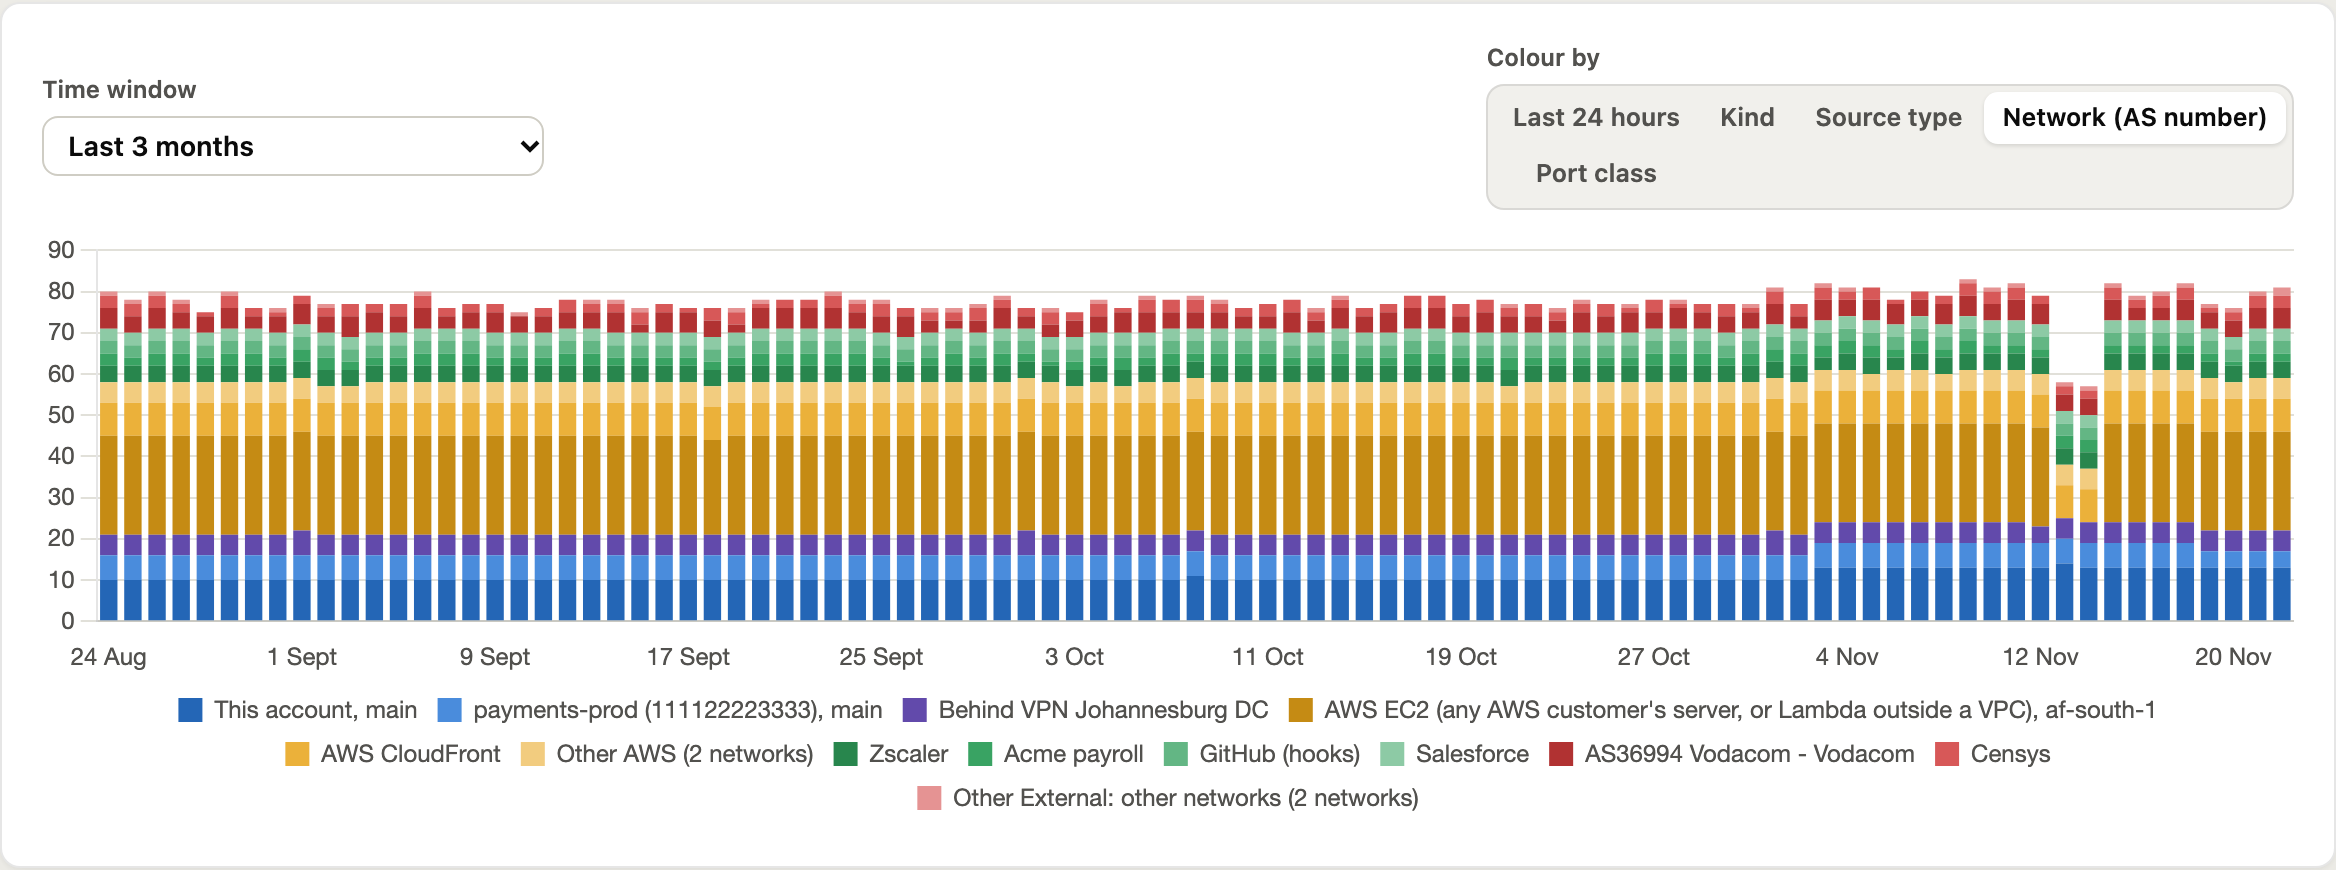
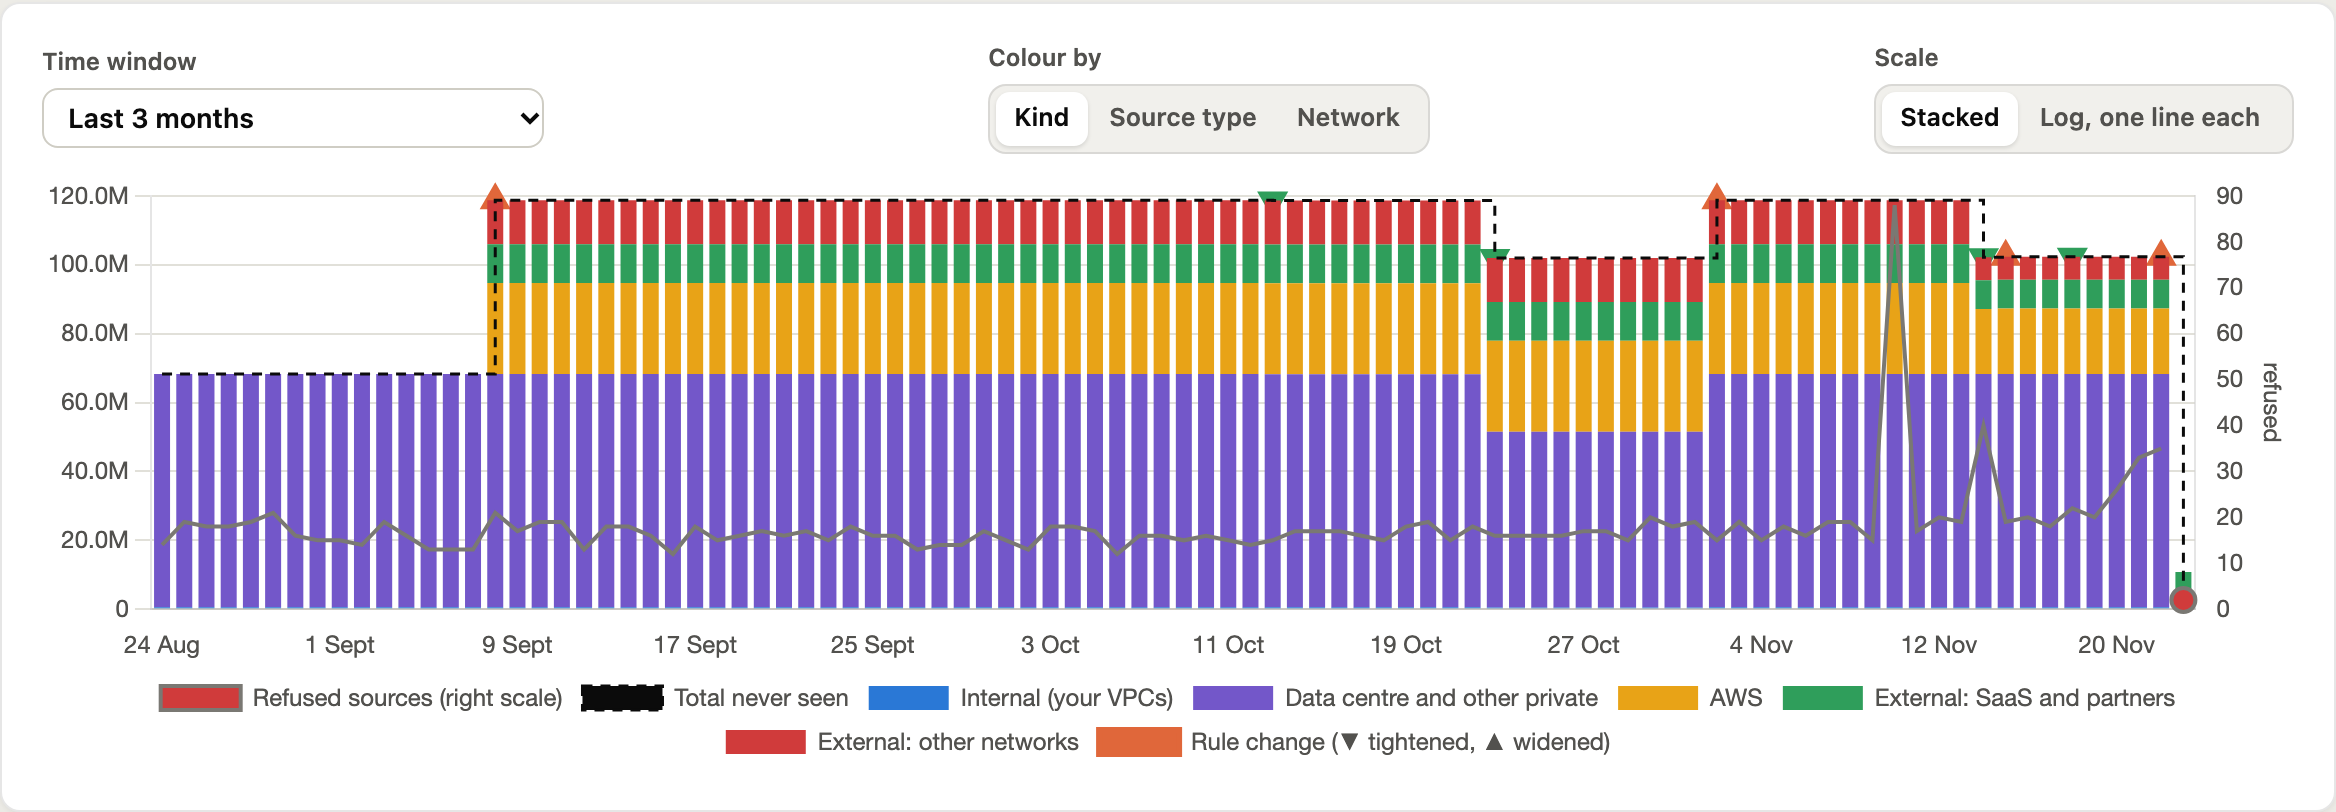
The first graph is the one that matters: how many unused addresses your rules let in, over time, and whose they are. Each bar is the number of addresses allowed in that never connected, stacked by who owns them: internal (your VPCs), data centre and other private space, AWS, SaaS and partners, and other networks. Every tightening is a step down.
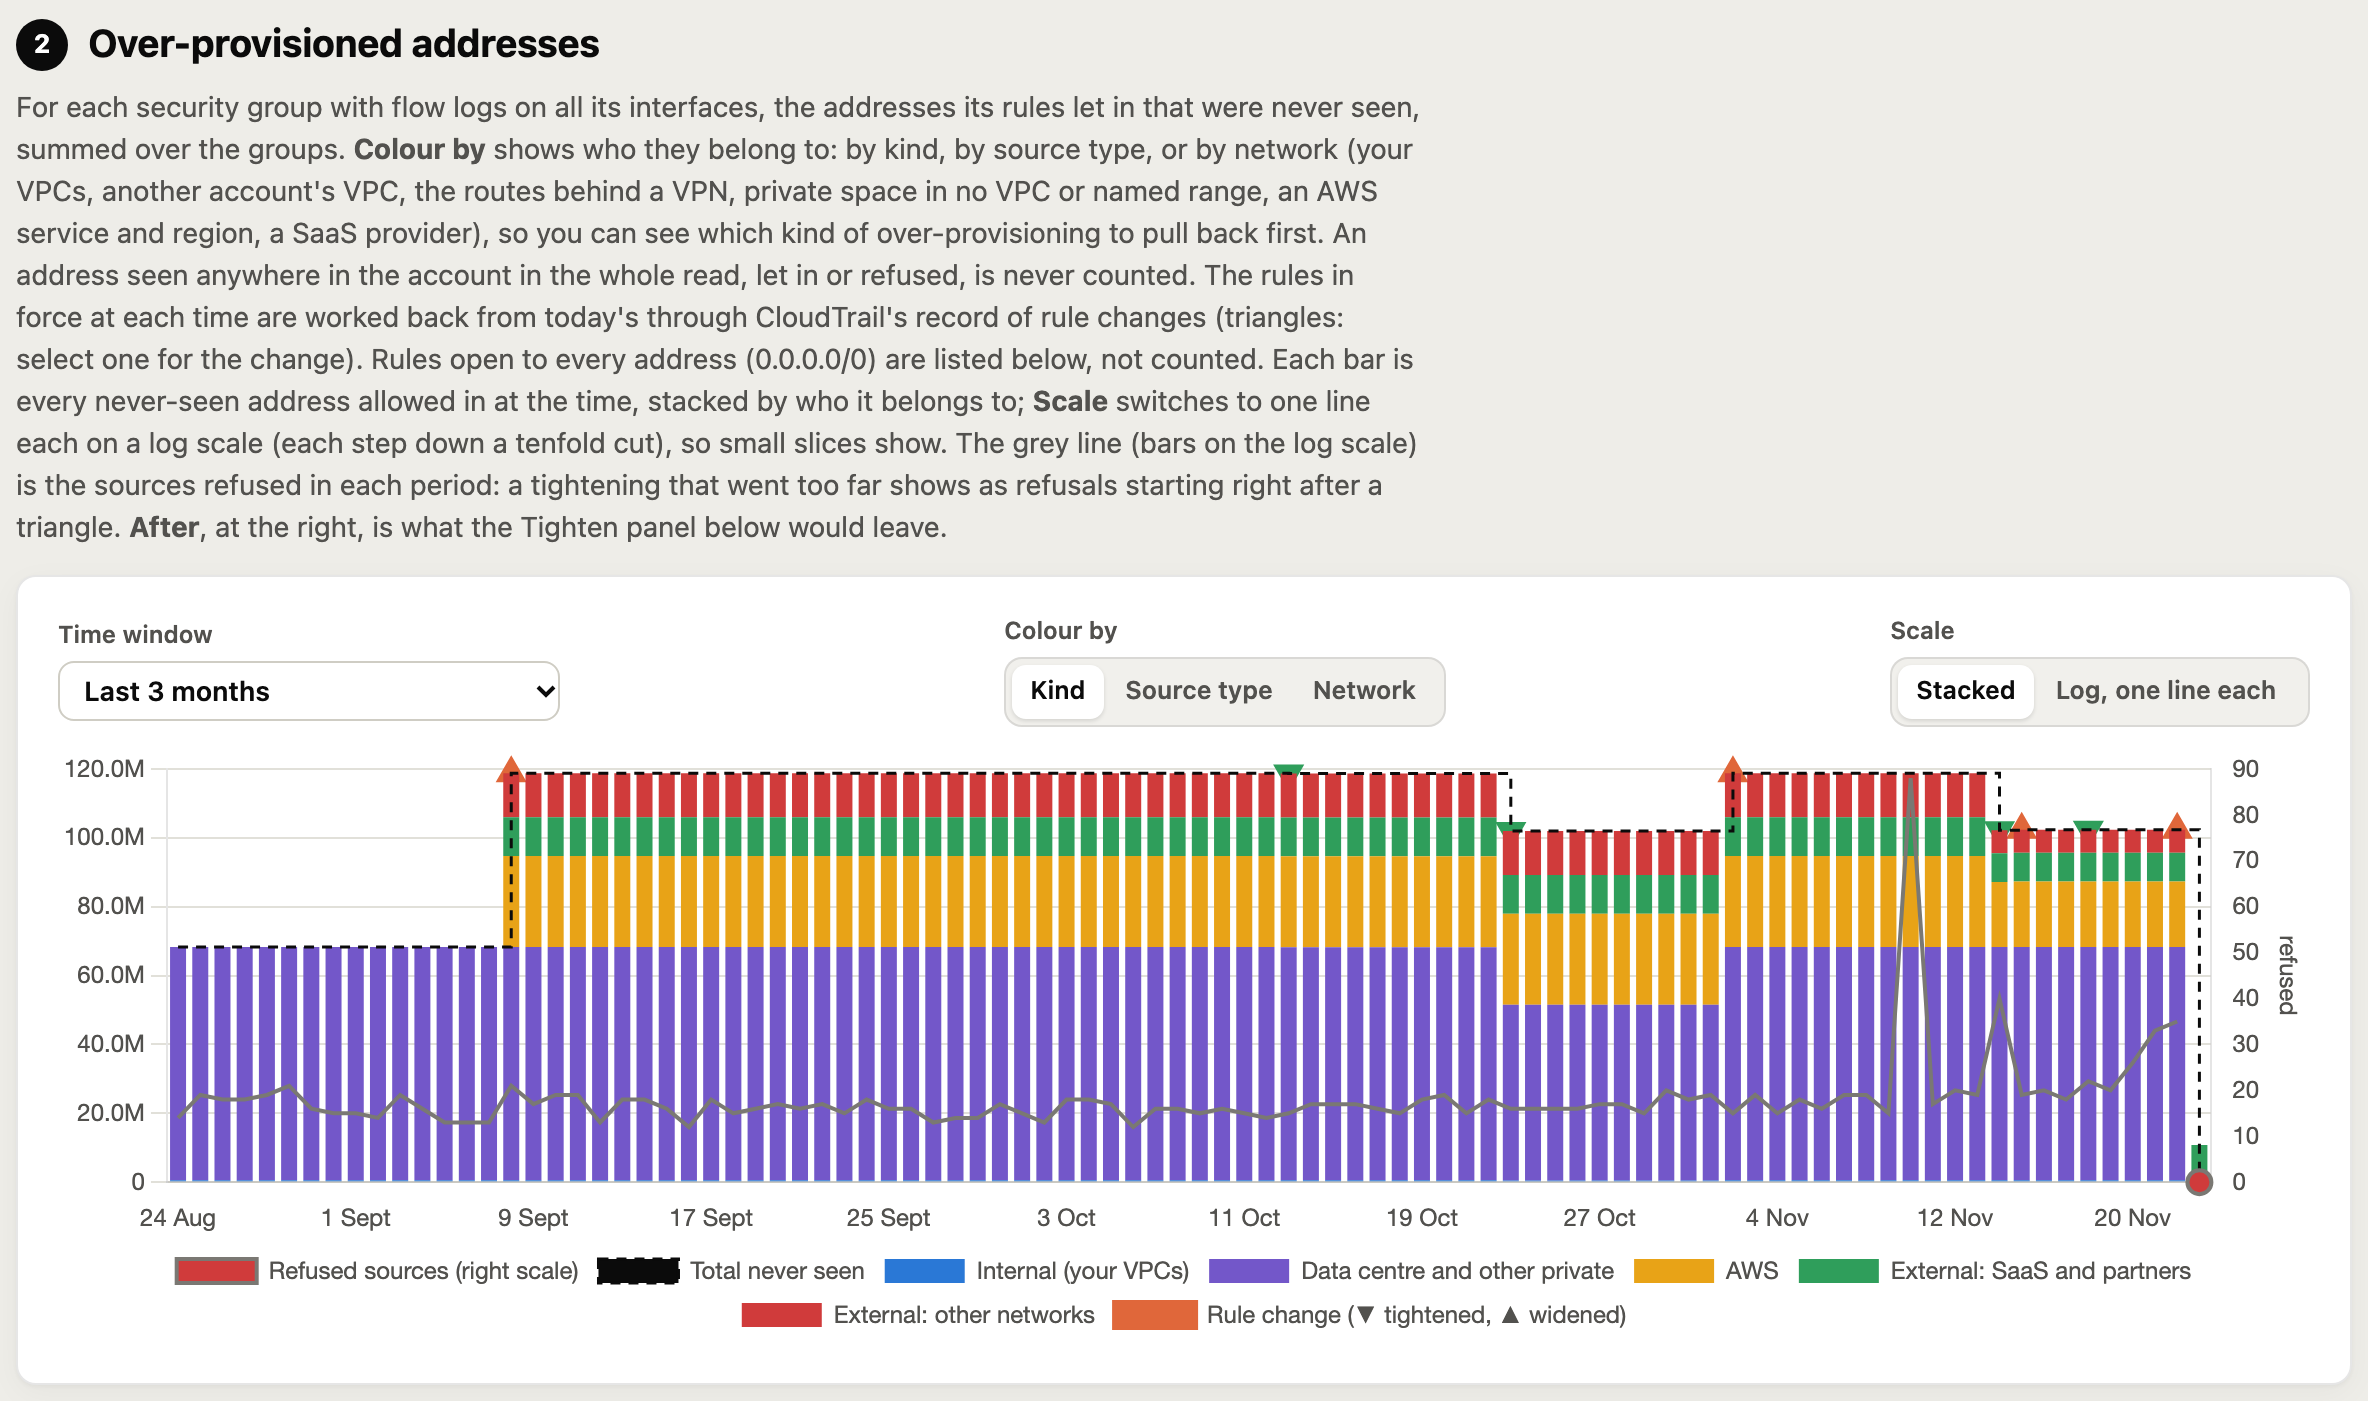
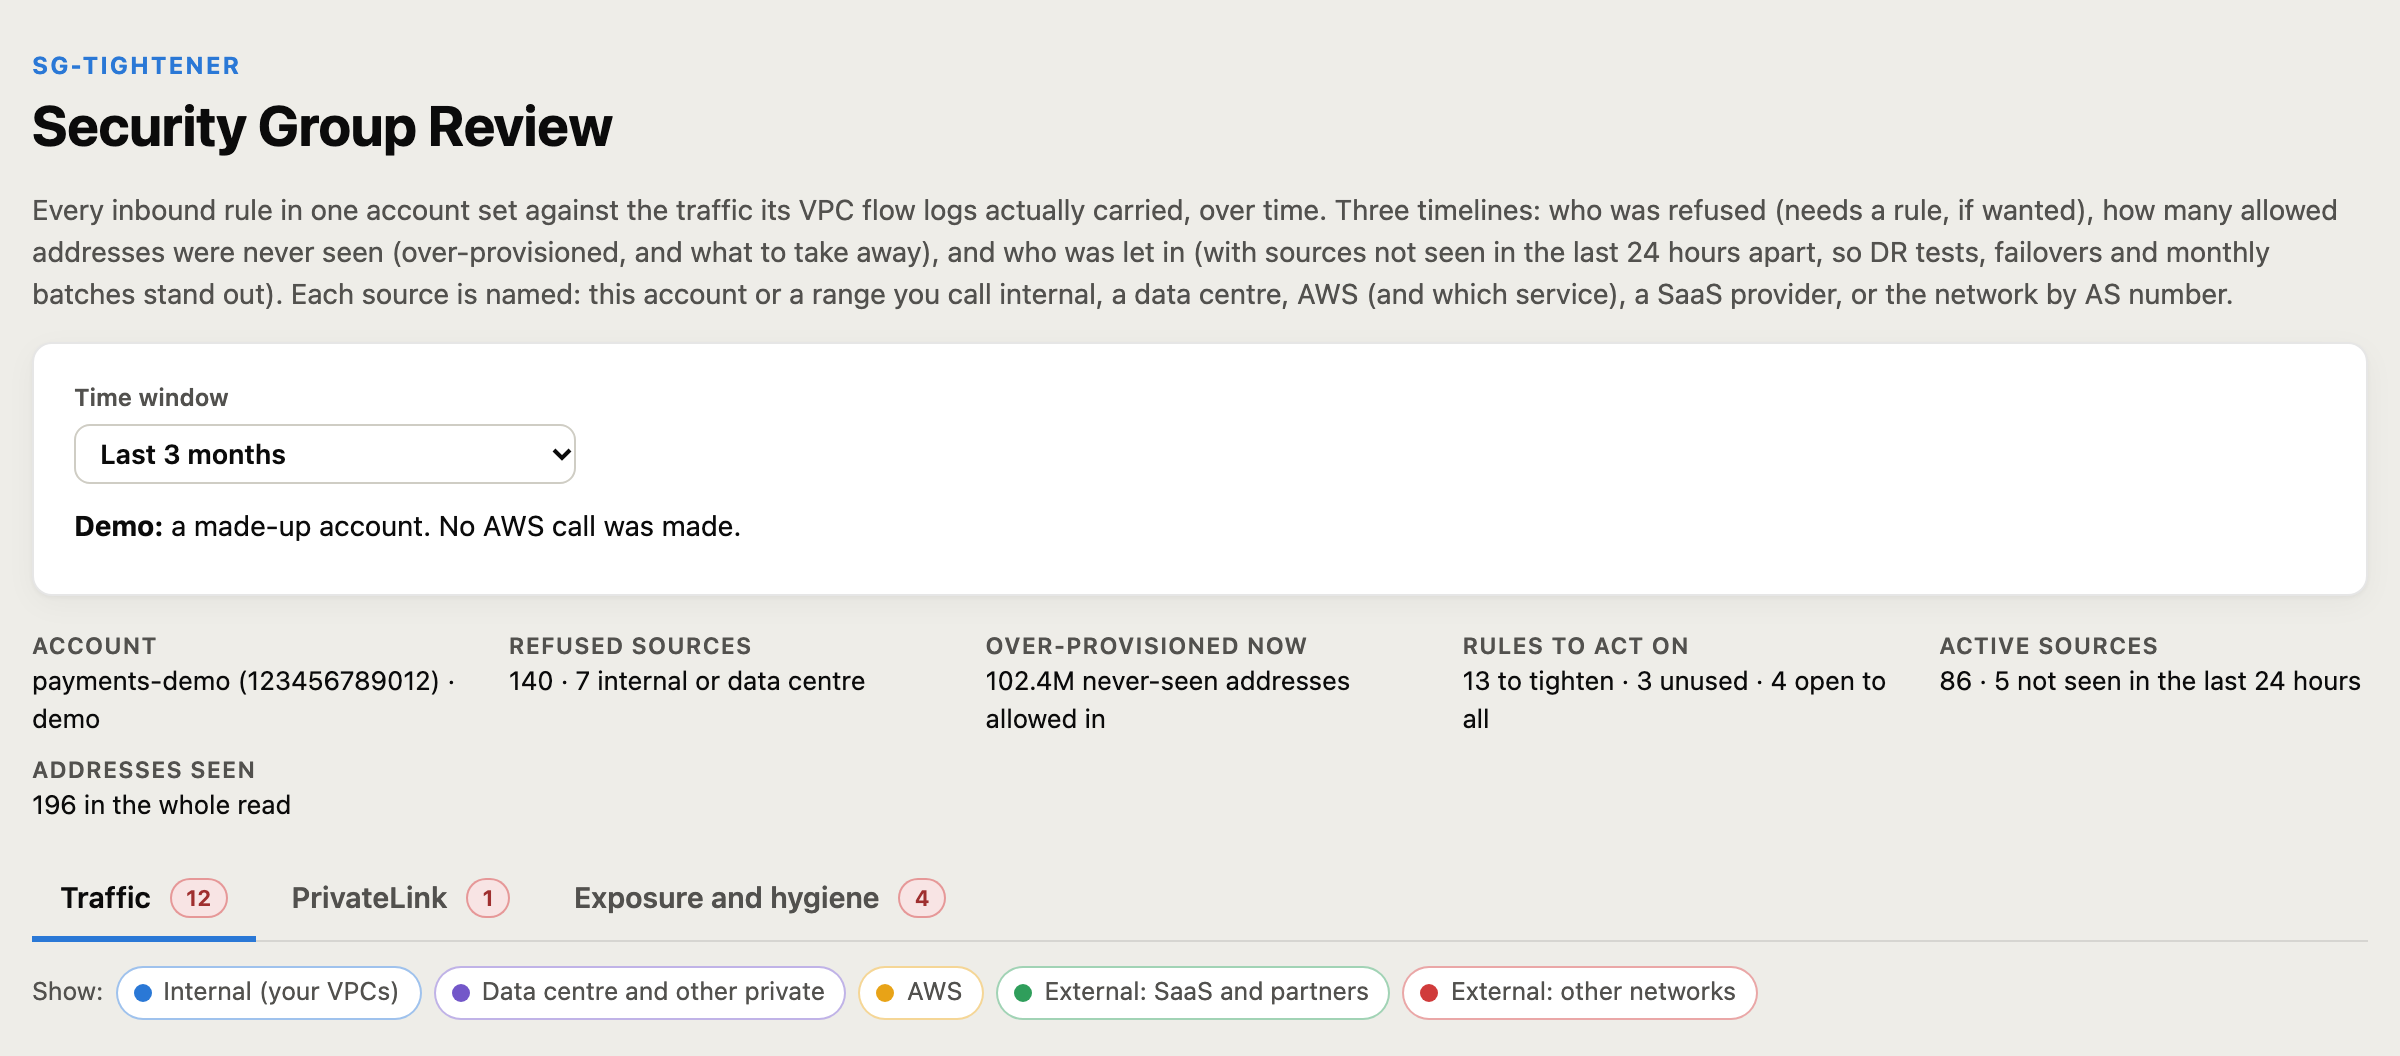
The headline number is never seen addresses allowed in: for every security group with flow logs on all its interfaces, the addresses its rules let in that never appeared anywhere in the account during the whole read. In the demo account that is 102.4 million. Every source is named: your VPCs, ranges you call internal, your data centres, the AWS service and region, the SaaS provider (Zscaler, GitHub, Cloudflare and so on), or the network by AS number and country. Each one is typed as well: CDN, secure access service, SaaS, anyone’s hosting, internet scanner, or Tor or VPN exit.
The over provisioning, over time, by type and by owner
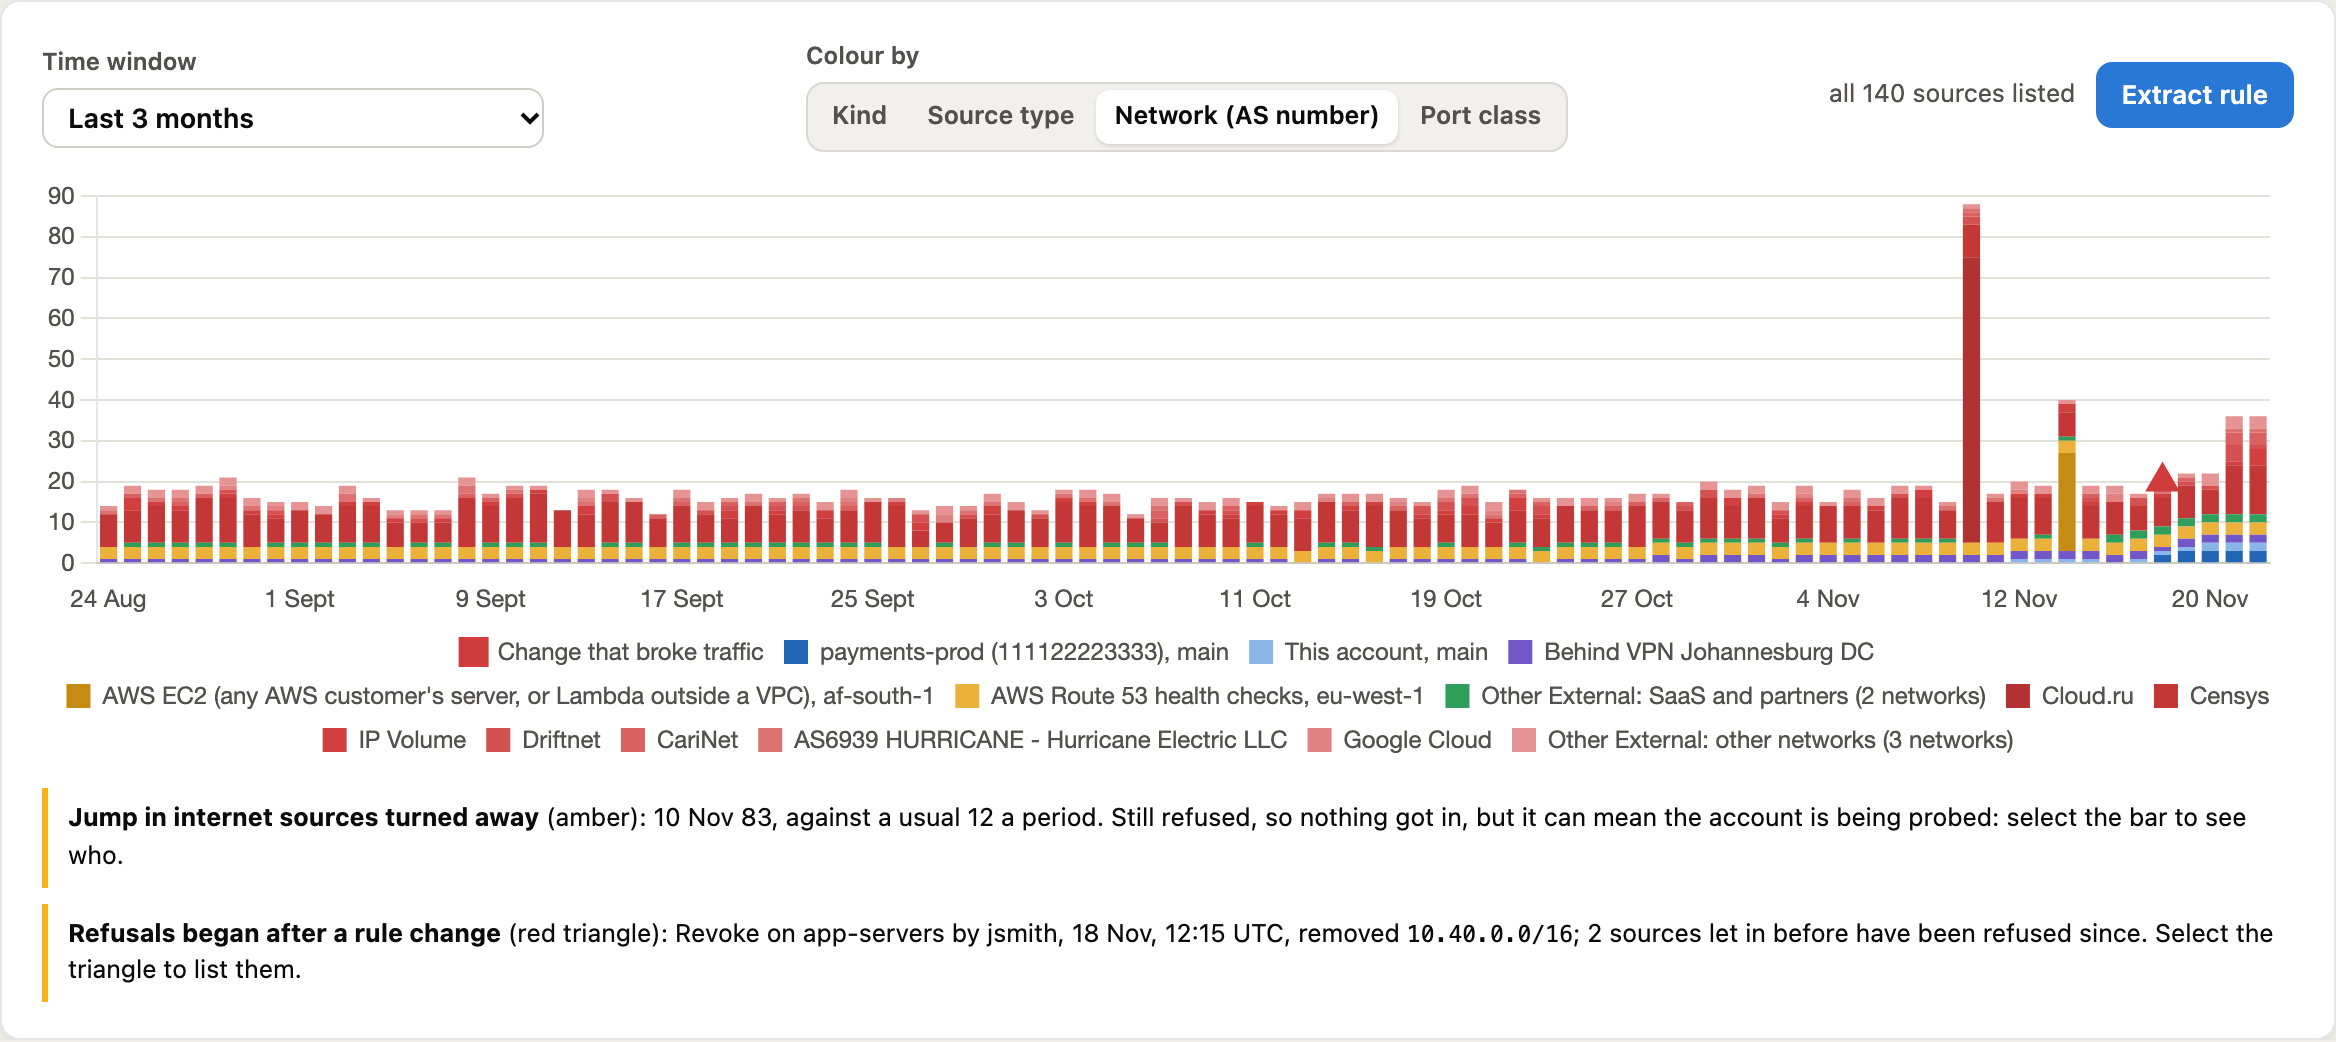
The over provisioning graph is a stacked timeline of those never seen addresses: the rules in force on each day are worked back through CloudTrail, every rule change is a triangle (▼ tightened, ▲ widened), the dashed line is the total, and the grey line is the sources refused, so a tightening that went too far shows as refusals rising right after a ▼. Scale switches to one line per slice on a log scale, so a /28 is visible next to a /8. Colour by splits the stack three ways:
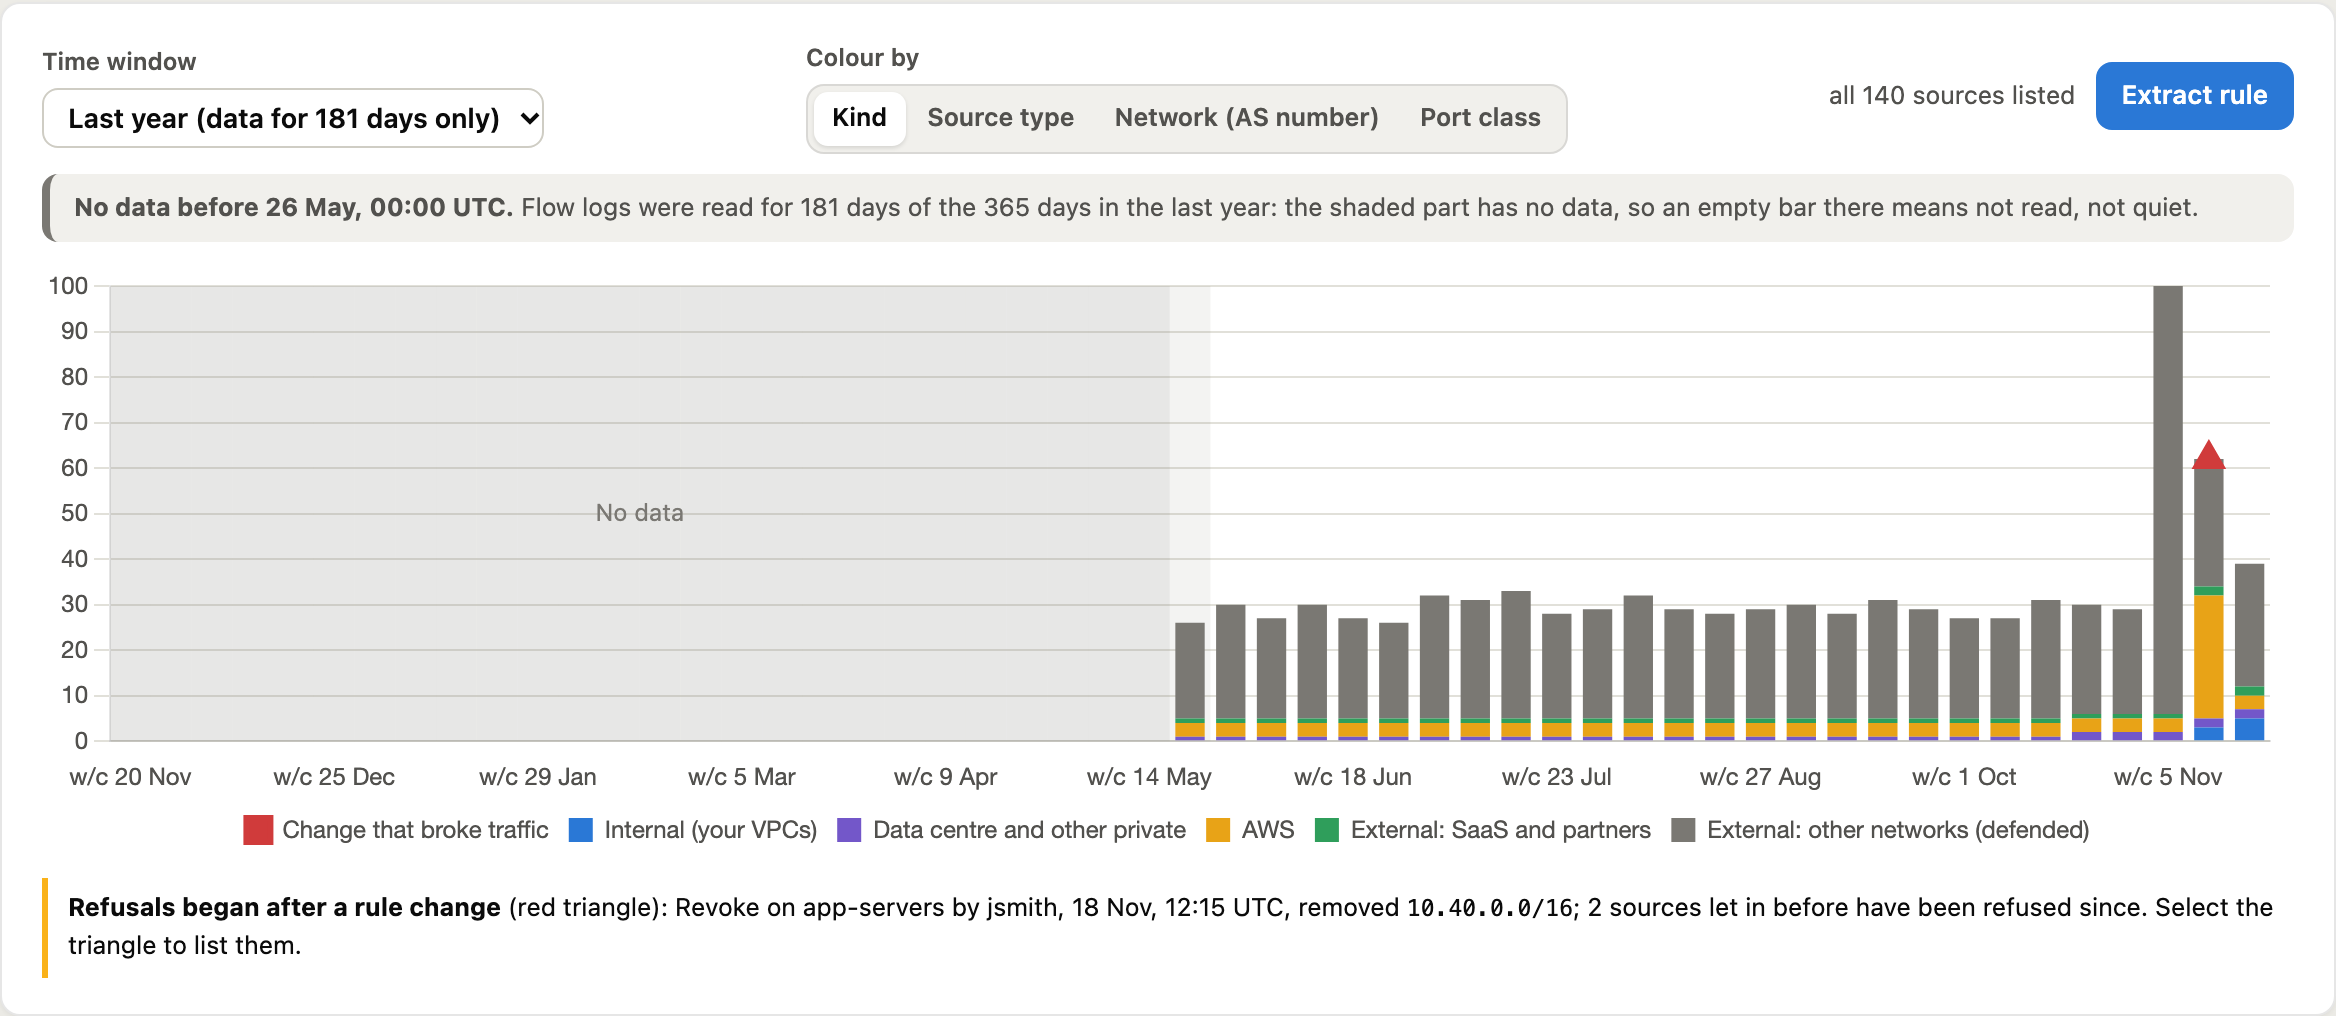
- Kind: internal, data centre and other private, AWS, SaaS and partners, other networks.
- Source type: secure access (Zscaler), SaaS, hosting, named partners, other networks.
- Network, who each never seen address belongs to: this account’s VPCs, your other accounts’ VPCs, the routes behind each VPN, private space no VPC or named range uses, each AWS service and region, each SaaS provider and AS.
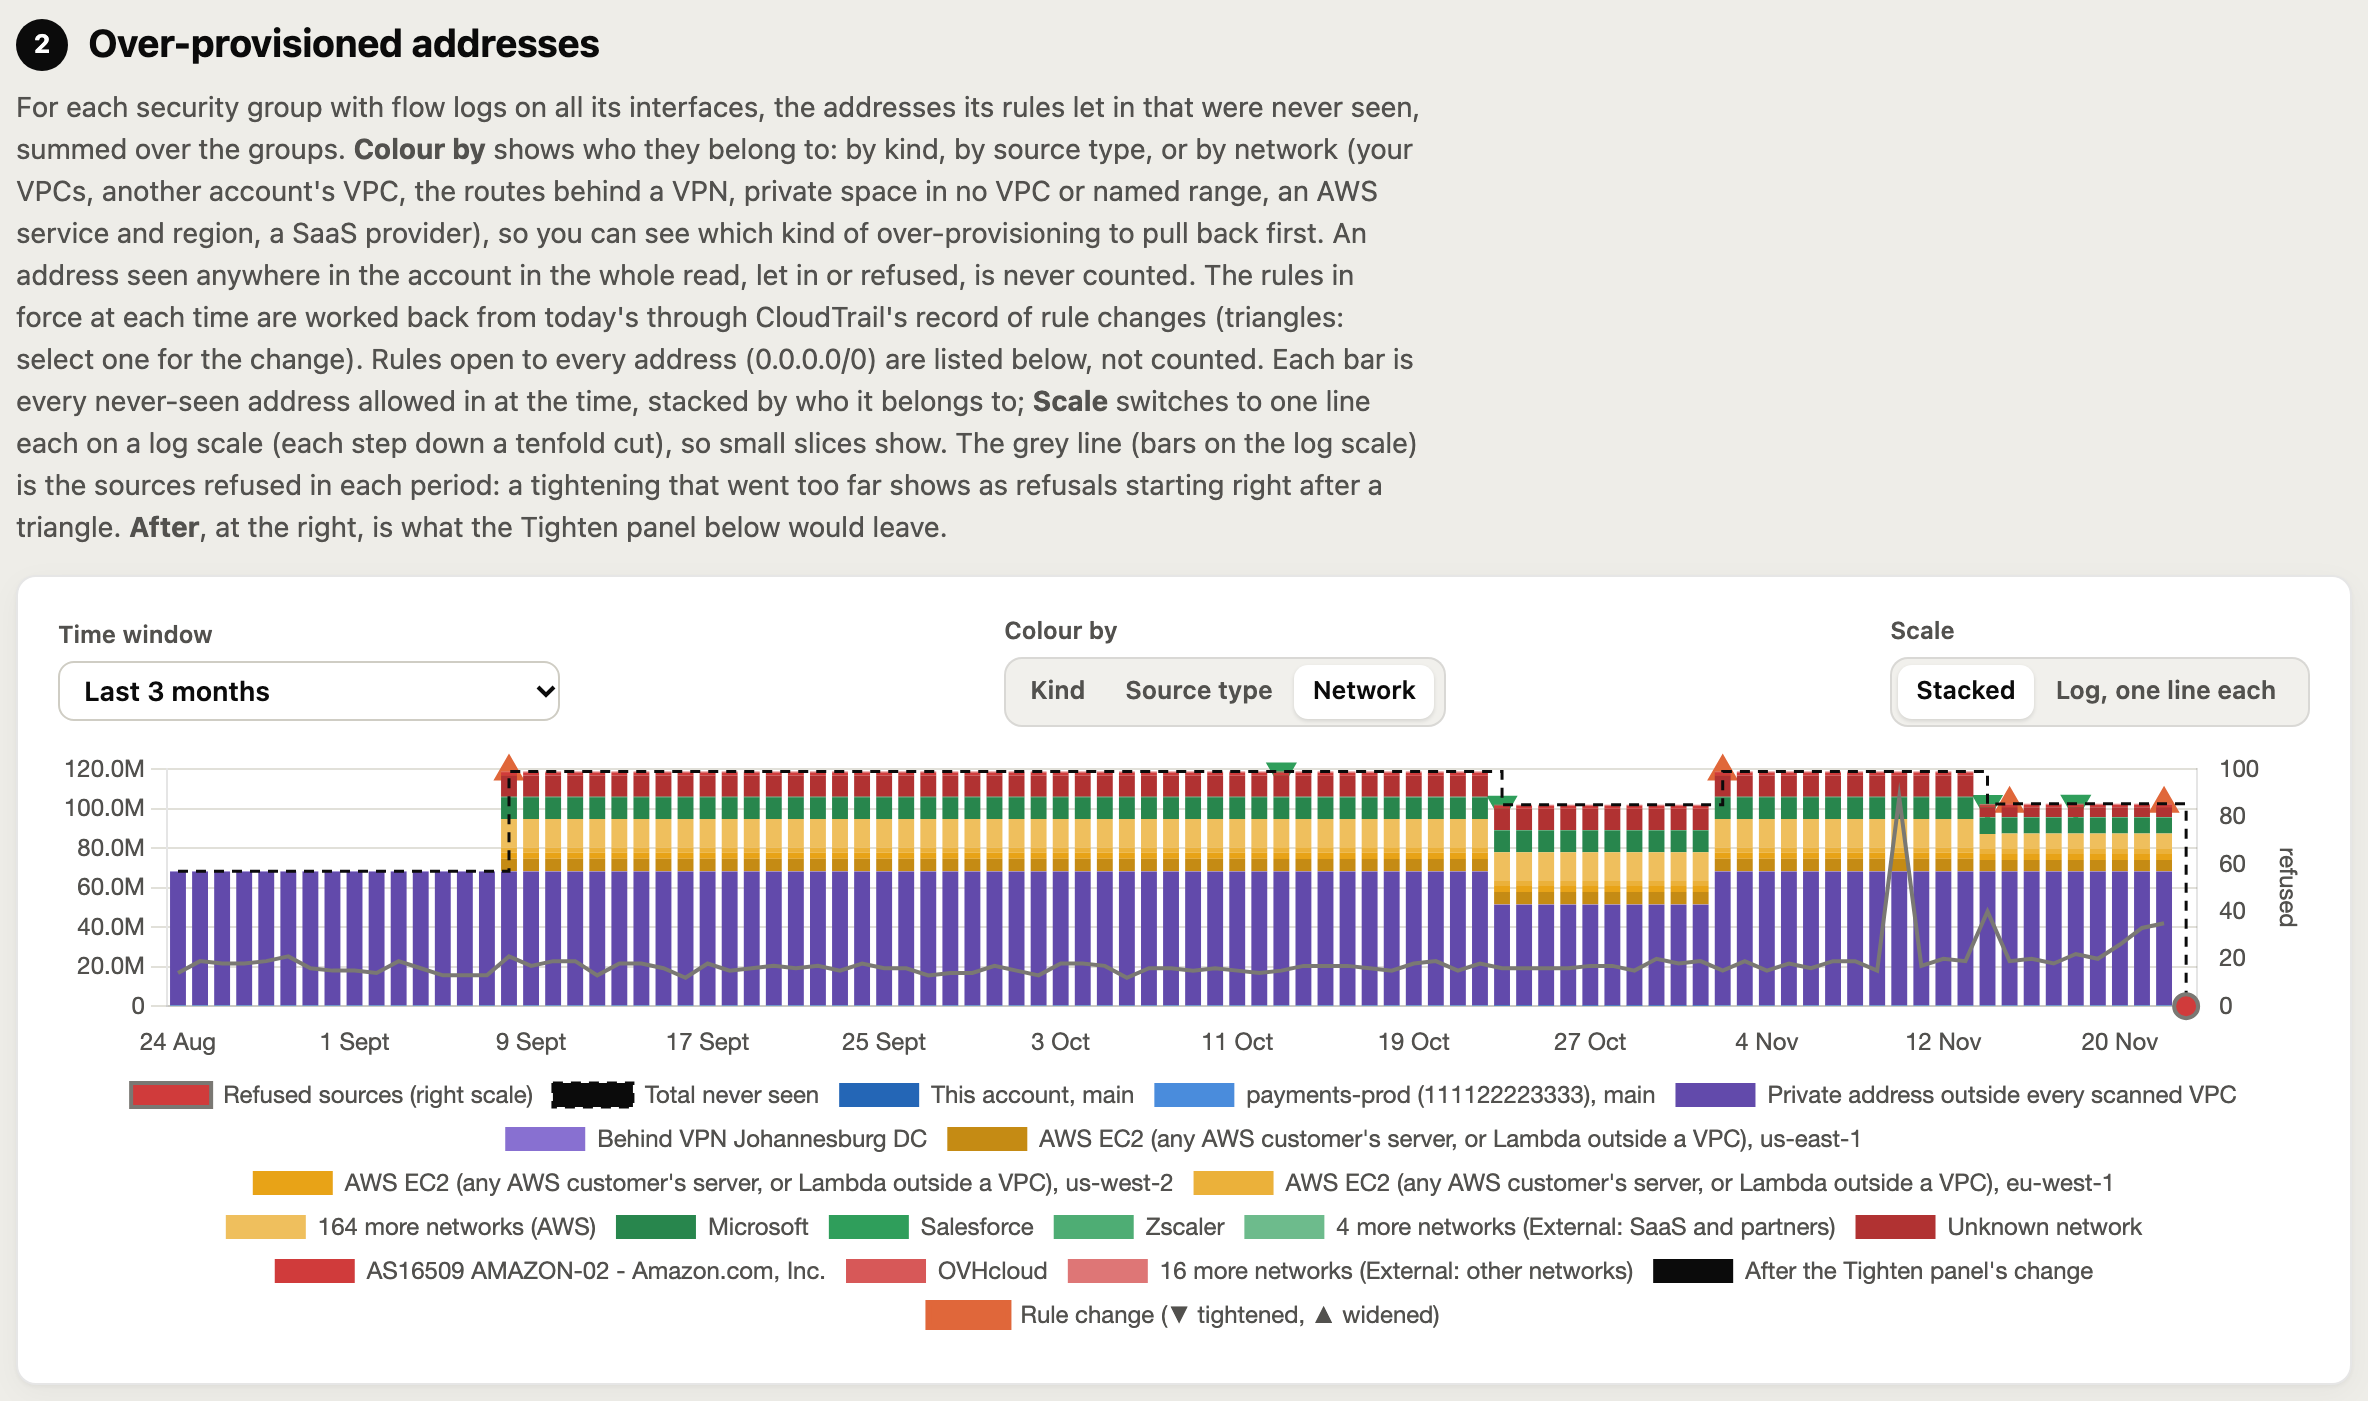
In the demo two thirds of the 102 million never seen addresses are private space that no VPC, VPN route or named range uses, let in by the 10.0.0.0/8 rules. That is the backhaul risk in one line, and the first thing to pull back. AWS ranges come next, then the SaaS ranges.
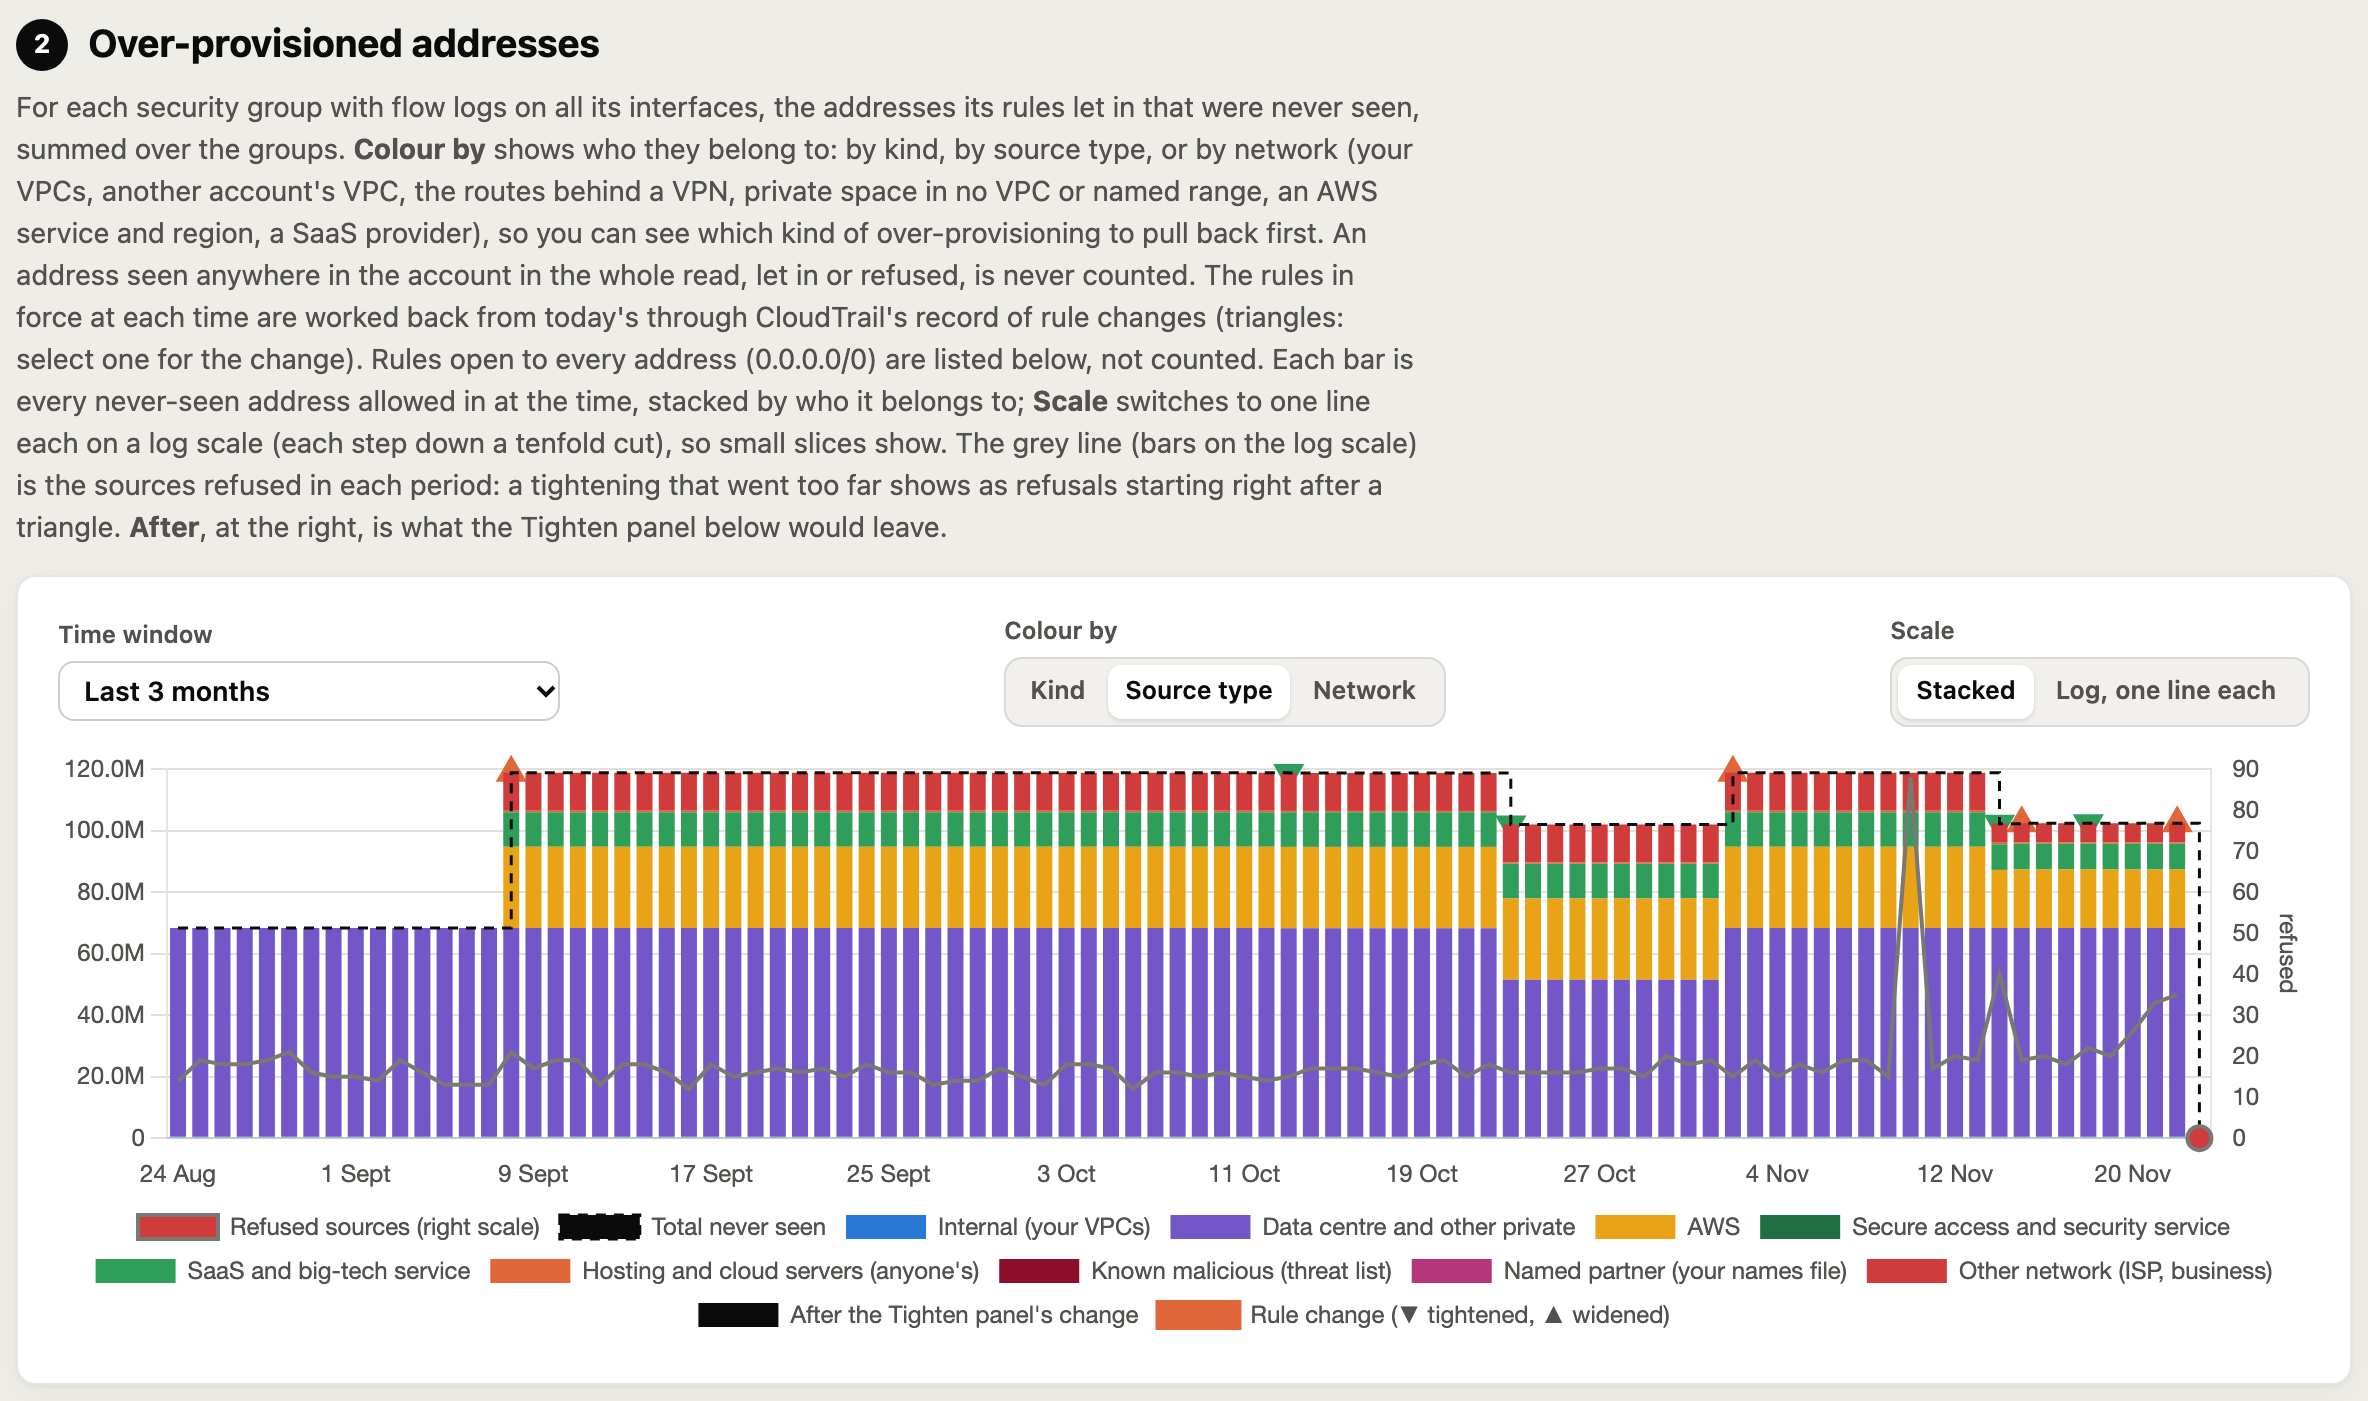
Sources not seen recently are kept apart, so a monthly batch job or a DR failover test is not mistaken for something unused.
A Time window drop-down at the top of the page and above each timeline switches every graph between the last 24 hours, week, month, 3 months, 6 months and year. Read a year (--days 365) and it is drawn a bar a week, so a year-end batch or an annual DR test shows up before you take its rule away. Choosing a window on one graph changes them all, and Needs attention and Ports have it too.
If a window reaches further back than the flow logs you have read (or kept), the page says so rather than letting an empty graph look quiet: a note beside each graph gives the date the data starts and how many of the window’s days were read, the time not read is shaded and labelled No data, the over-provisioned lines stop where the data does, and the note gives the read --days command that fills the gap.
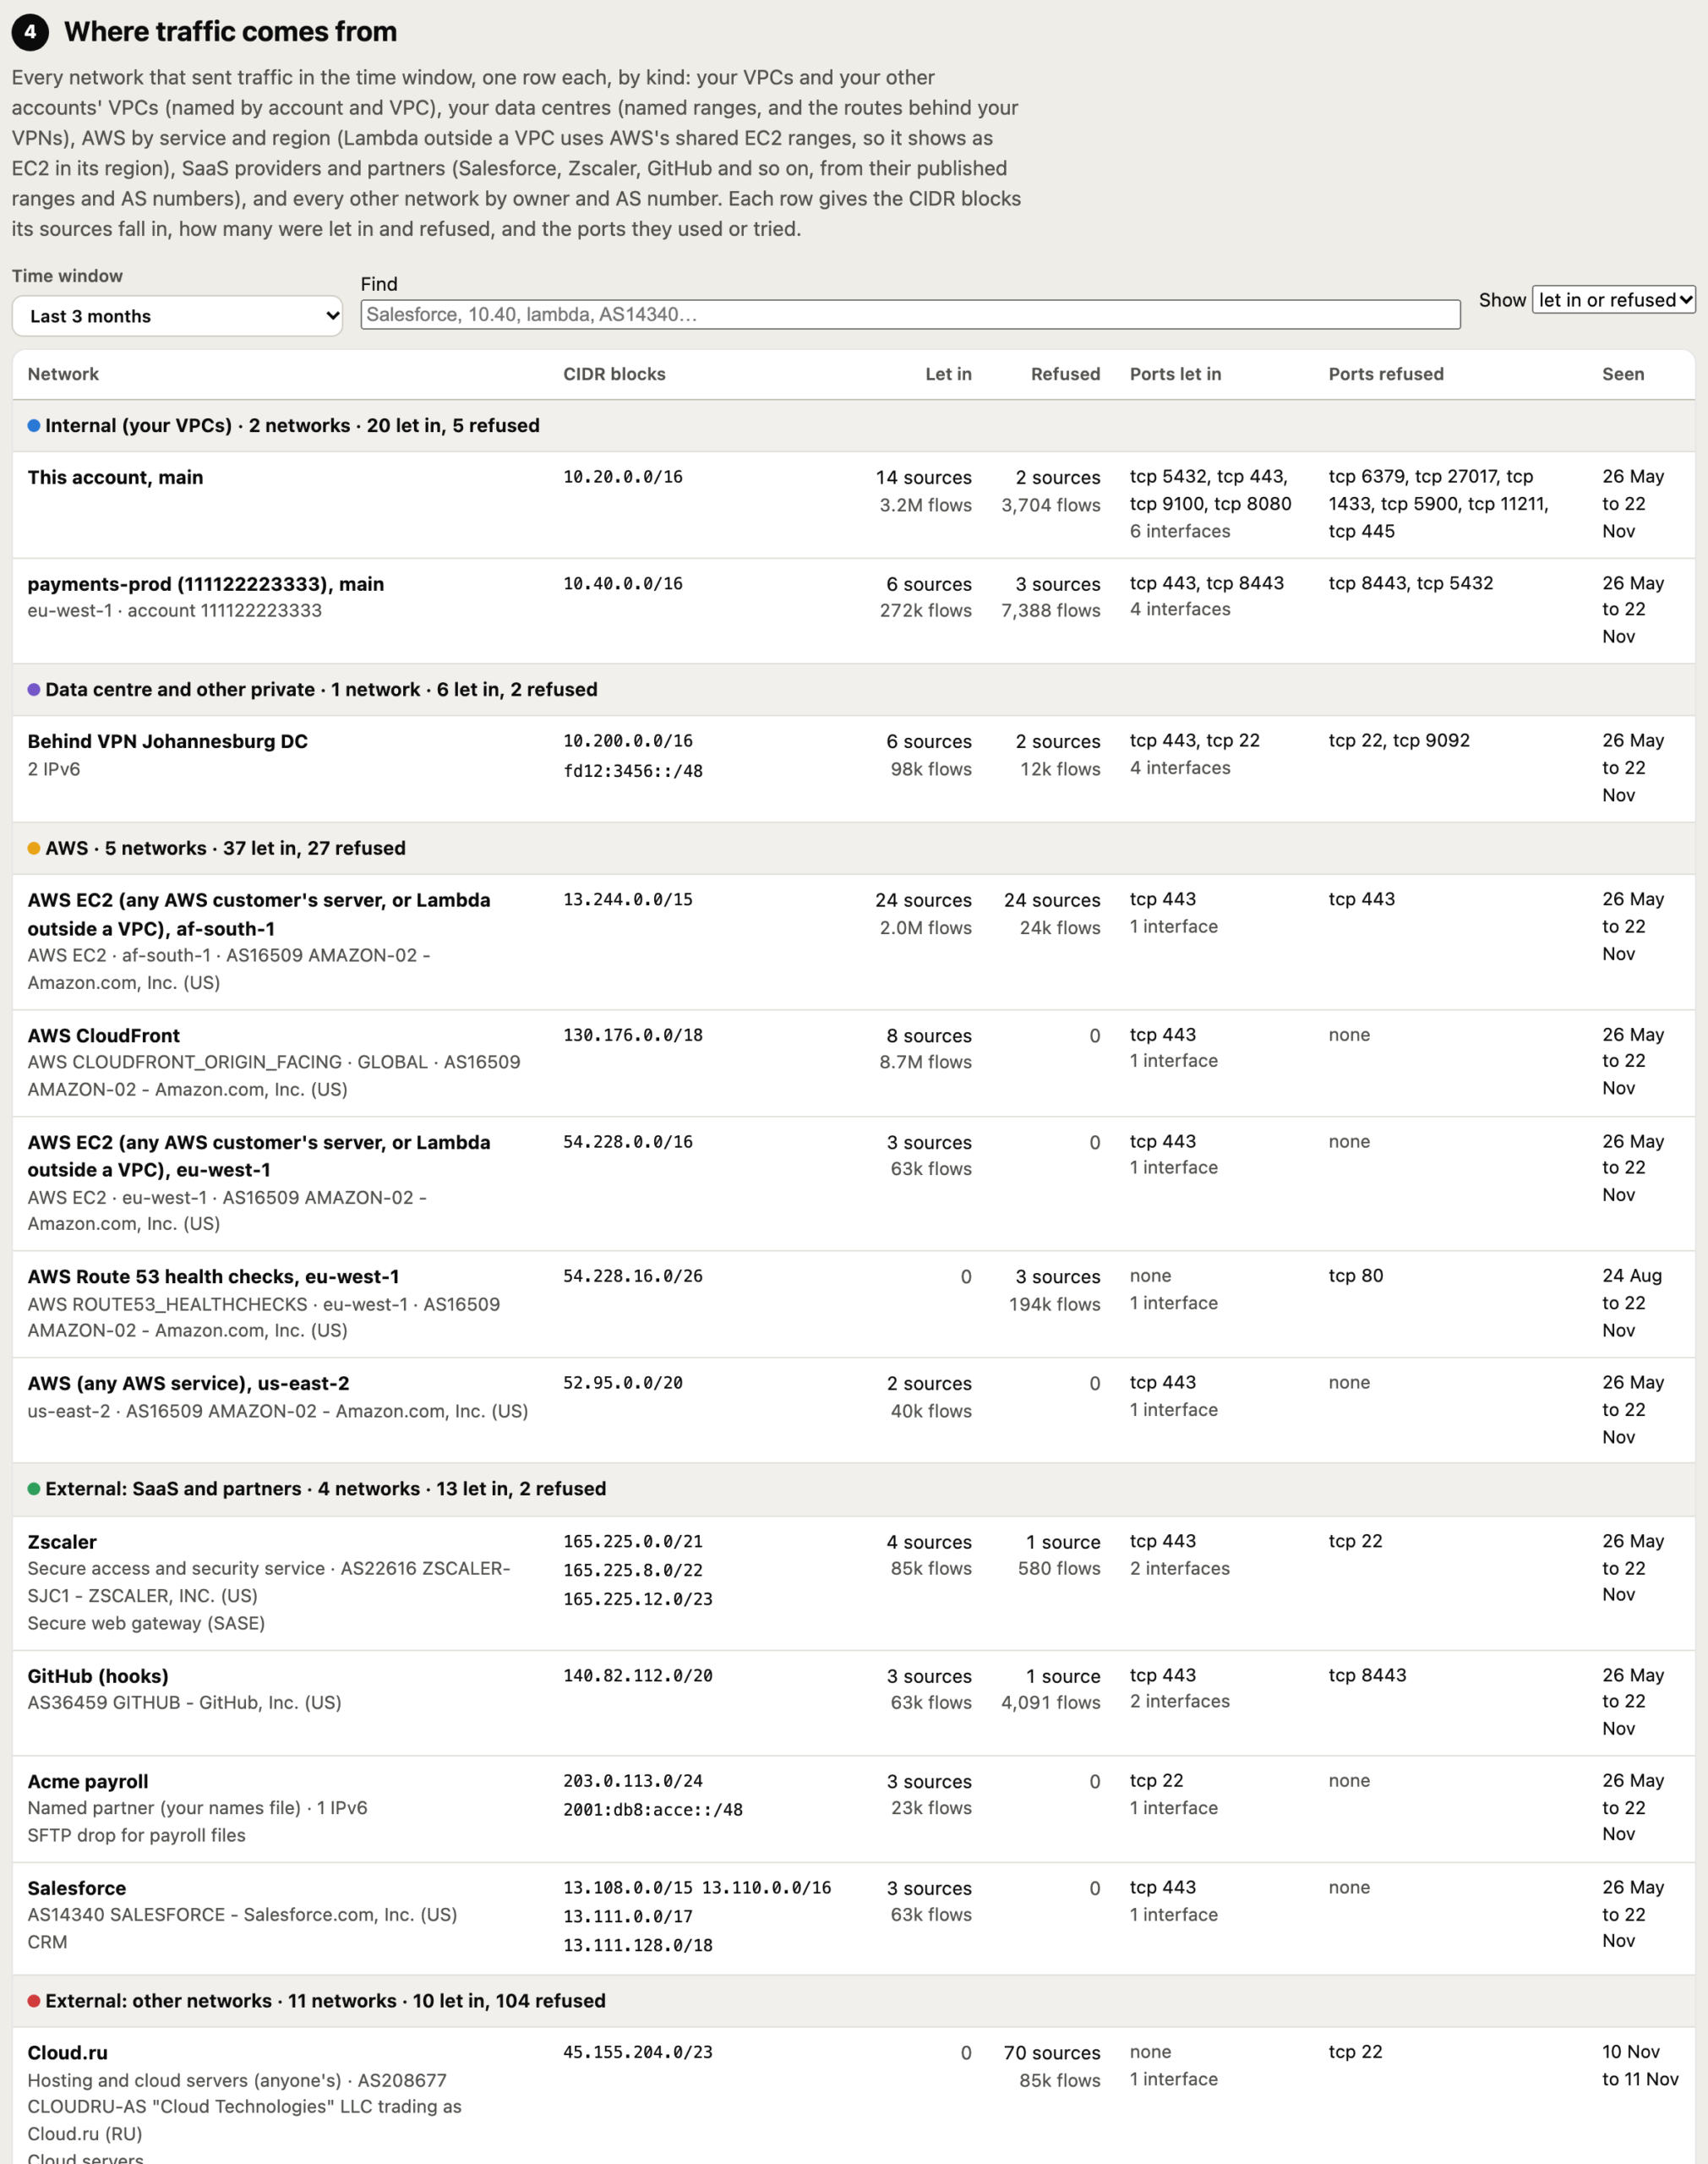
Where traffic comes from, down to the CIDR block
A table lists every network that sent or received traffic in the window, grouped by kind, with its CIDR blocks, ports and traffic in and out:
- On-premises: named from your VPN connections’ routes (“Behind VPN Johannesburg DC”),
--onpremor your names file. - Your other AWS accounts: every account you have read is remembered, so traffic from another account’s VPC is named “payments-prod (111122223333), main” with no flags.
- AWS services: by service and region, from AWS’s published ranges.
- Lambda: AWS publishes no Lambda ranges. Outside a VPC, Lambda uses the region’s shared EC2 ranges, so it shows as EC2 in that region; inside a VPC it shows as your own interface.
- SaaS: Salesforce, Zscaler, Okta, GitHub, Datadog, Atlassian, Cloudflare, Microsoft, Google, Zoom, SendGrid and more, from published feeds and AS numbers. Any other partner can be named by range or AS number.
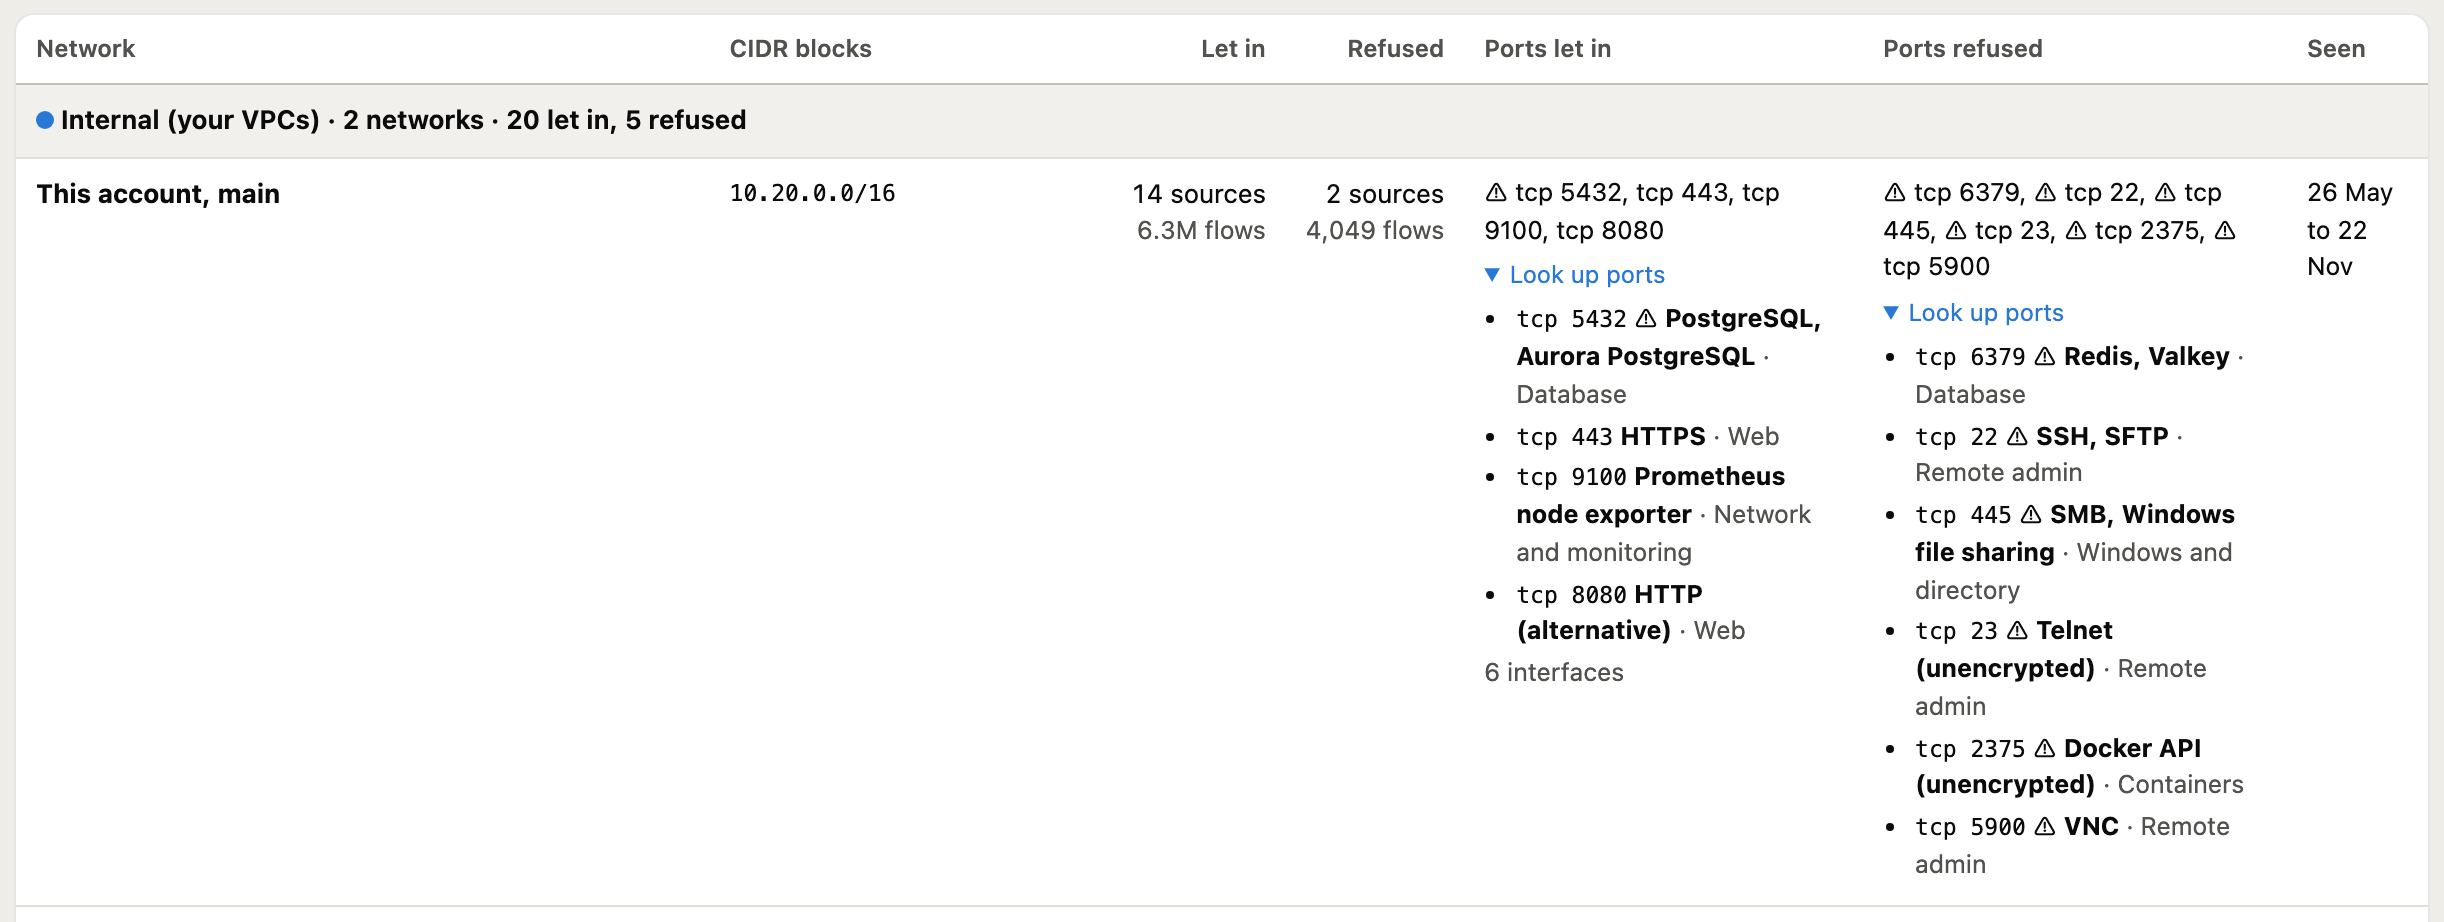
Not sure what a port is? Look up ports under any row lists what each port is commonly used for, and its class: tcp 5432 is PostgreSQL (a database), tcp 445 is SMB, Windows file sharing, tcp 9100 is the Prometheus node exporter. Remote admin, database, Windows and container ports are marked ⚠, hovering a port shows the same, and Find matches service names, so typing postgres or smb lists every network sending that traffic.
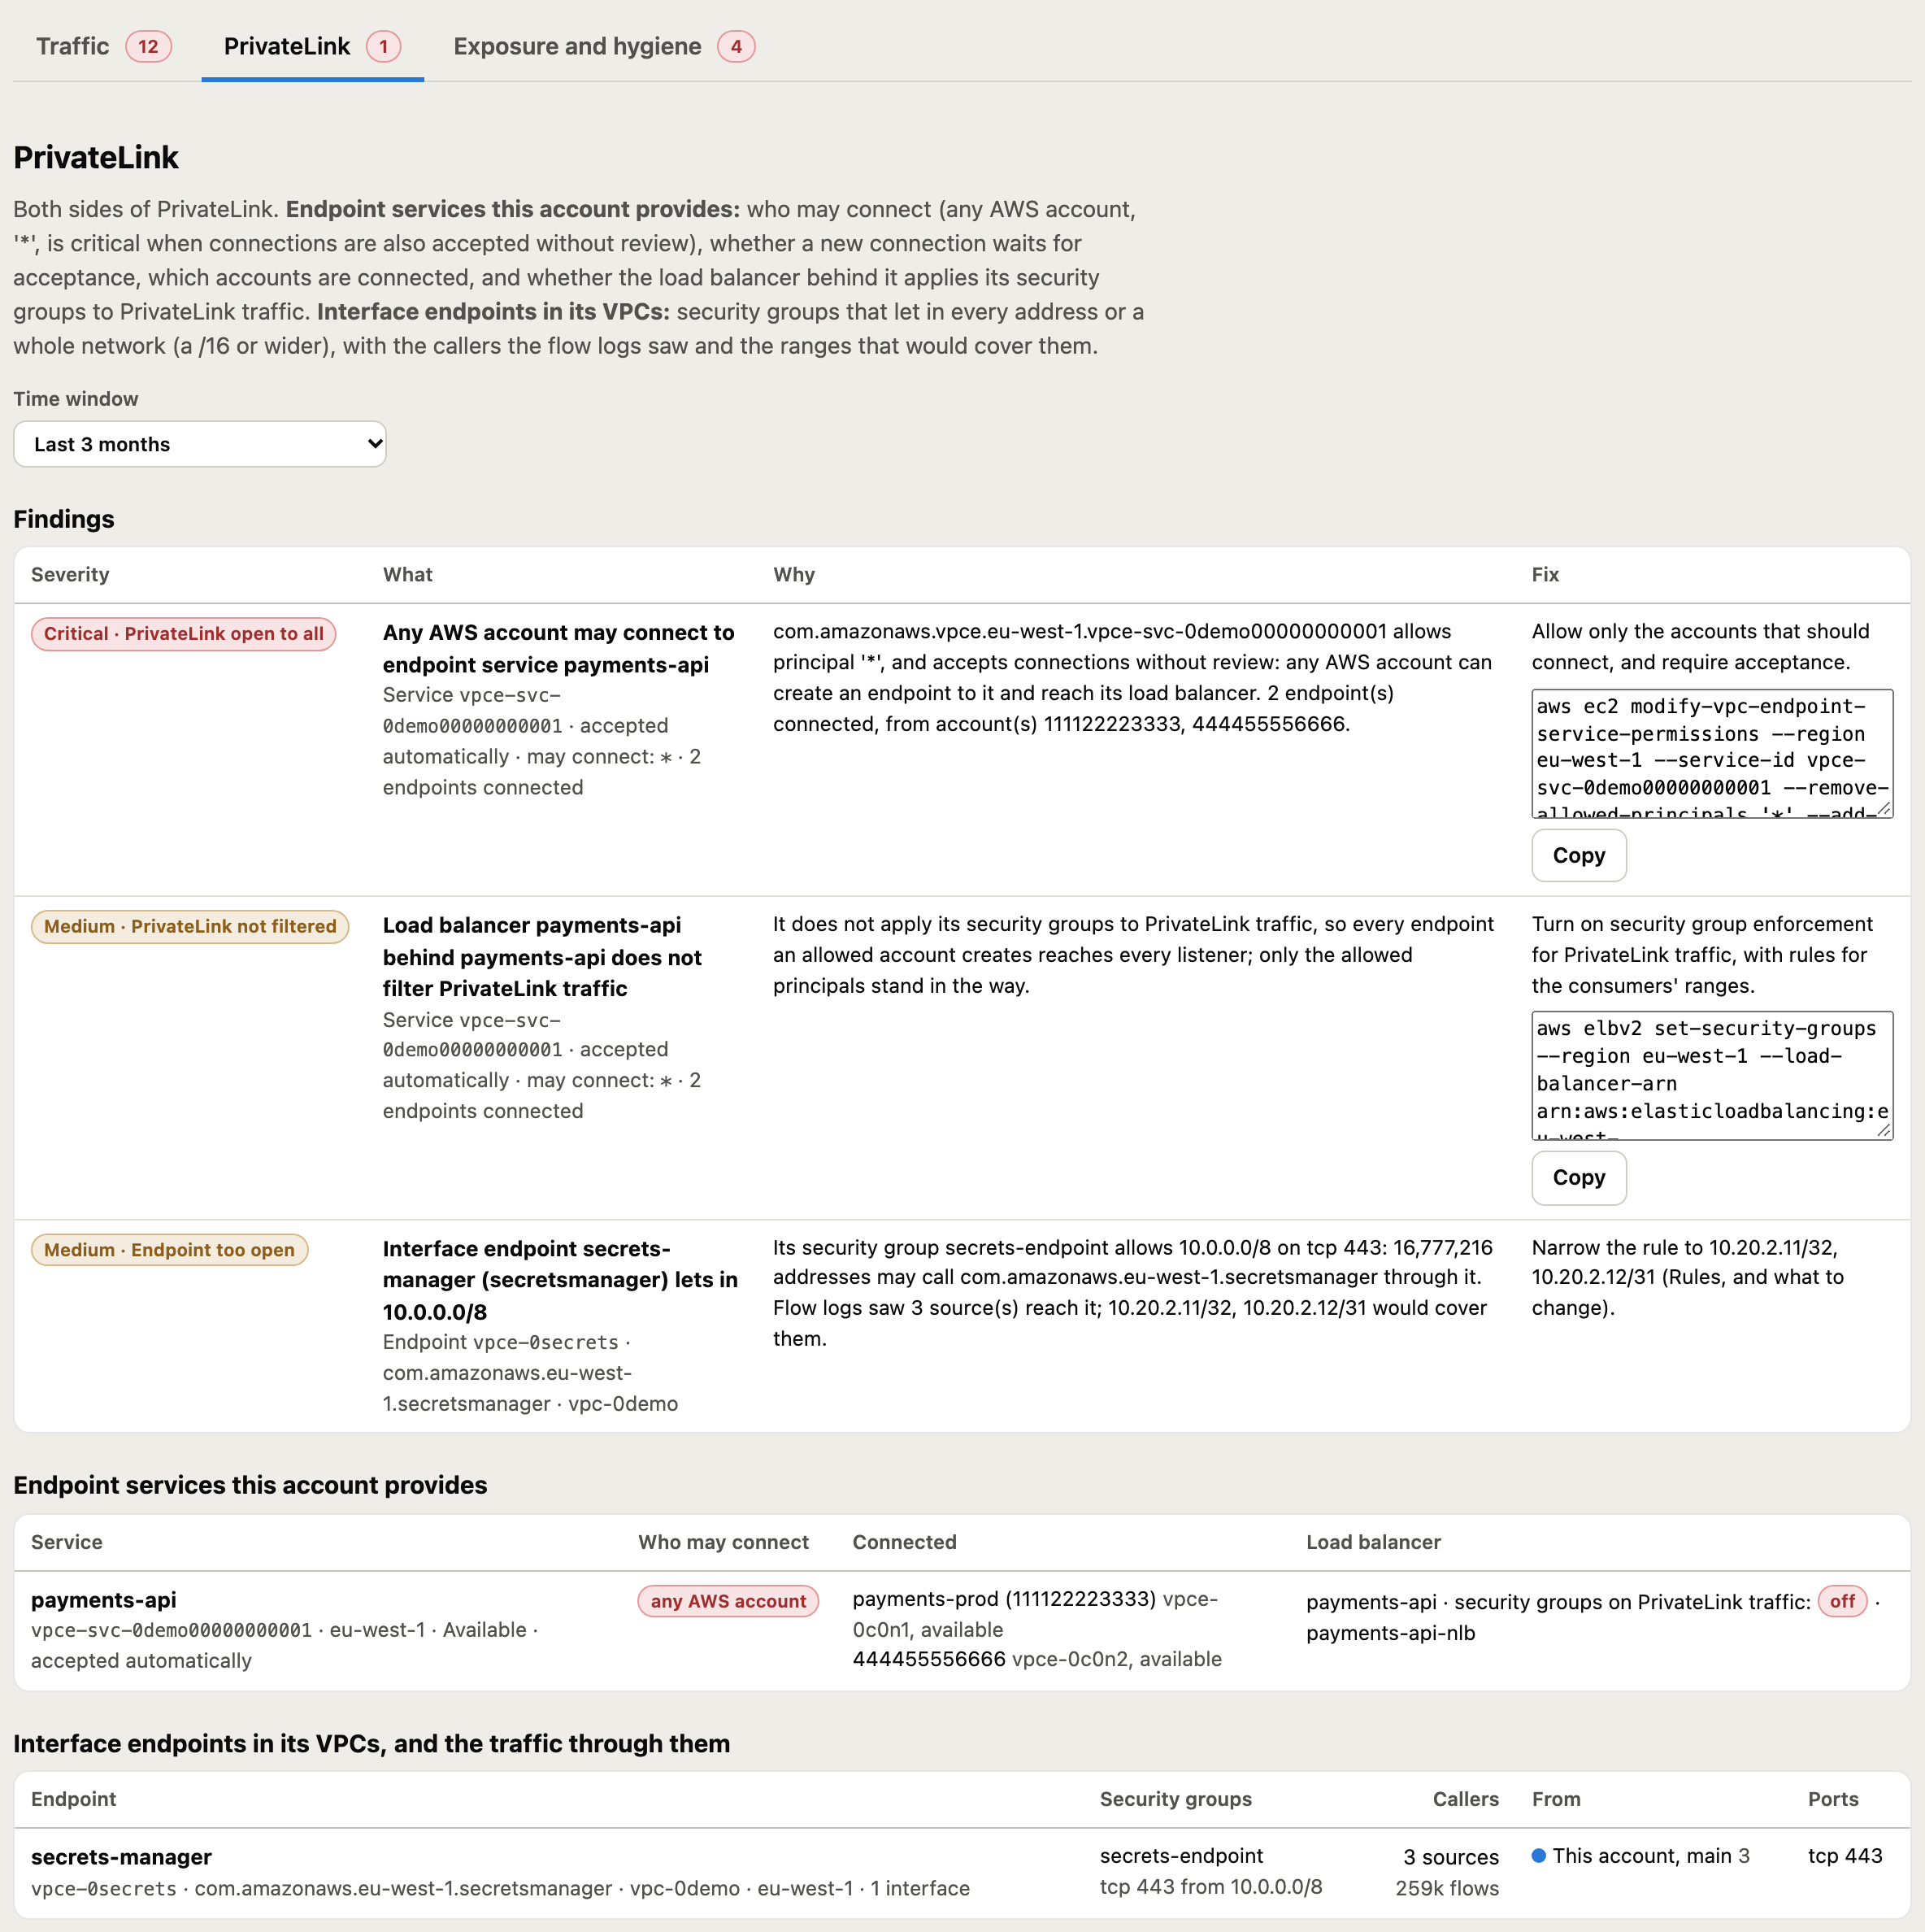
PrivateLink has its own tab: every endpoint service you provide and interface endpoint you use, who may connect, and the sources, networks and ports seen through each, under the findings to fix.
3. Tighten on the timeline, by type and attribution
The over provisioned graph is a timeline. The rules in force on each day are worked back from today’s rules through CloudTrail’s record of every rule change, and each change is marked on the stack: ▲ when it widened access, ▼ when it took more addresses away than it added. The grey line, on the right hand scale, is the sources refused each day.
Under the graph is the Tighten panel. It fits each rule to the sources that actually used it, and you choose how much room to leave around each source, by kind:
| Kind | Default room | Why |
|---|---|---|
| Internal (your VPCs) | The /24 around each address | Instances come and go inside a subnet |
| Data centre and other private | The /24 around each address | Your ranges, but wide |
| AWS | Its published range | Lambda, CloudFront and other services move within AWS’s published ranges |
| SaaS and partners | Its published or named range | Zscaler, GitHub hooks or a partner move within their own ranges |
| Other internet | Each address only | Anyone else gets exactly what was seen |
Then override it by source type (every secure access service, every CDN) or by name (one partner, Zscaler, a specific AWS service). The most specific choice wins. So internal callers can stay more generously provisioned than external ones, and services like Lambda or Zscaler keep a summary range instead of a list of individual addresses that will be wrong next week. The room is never wider than the rule is today.
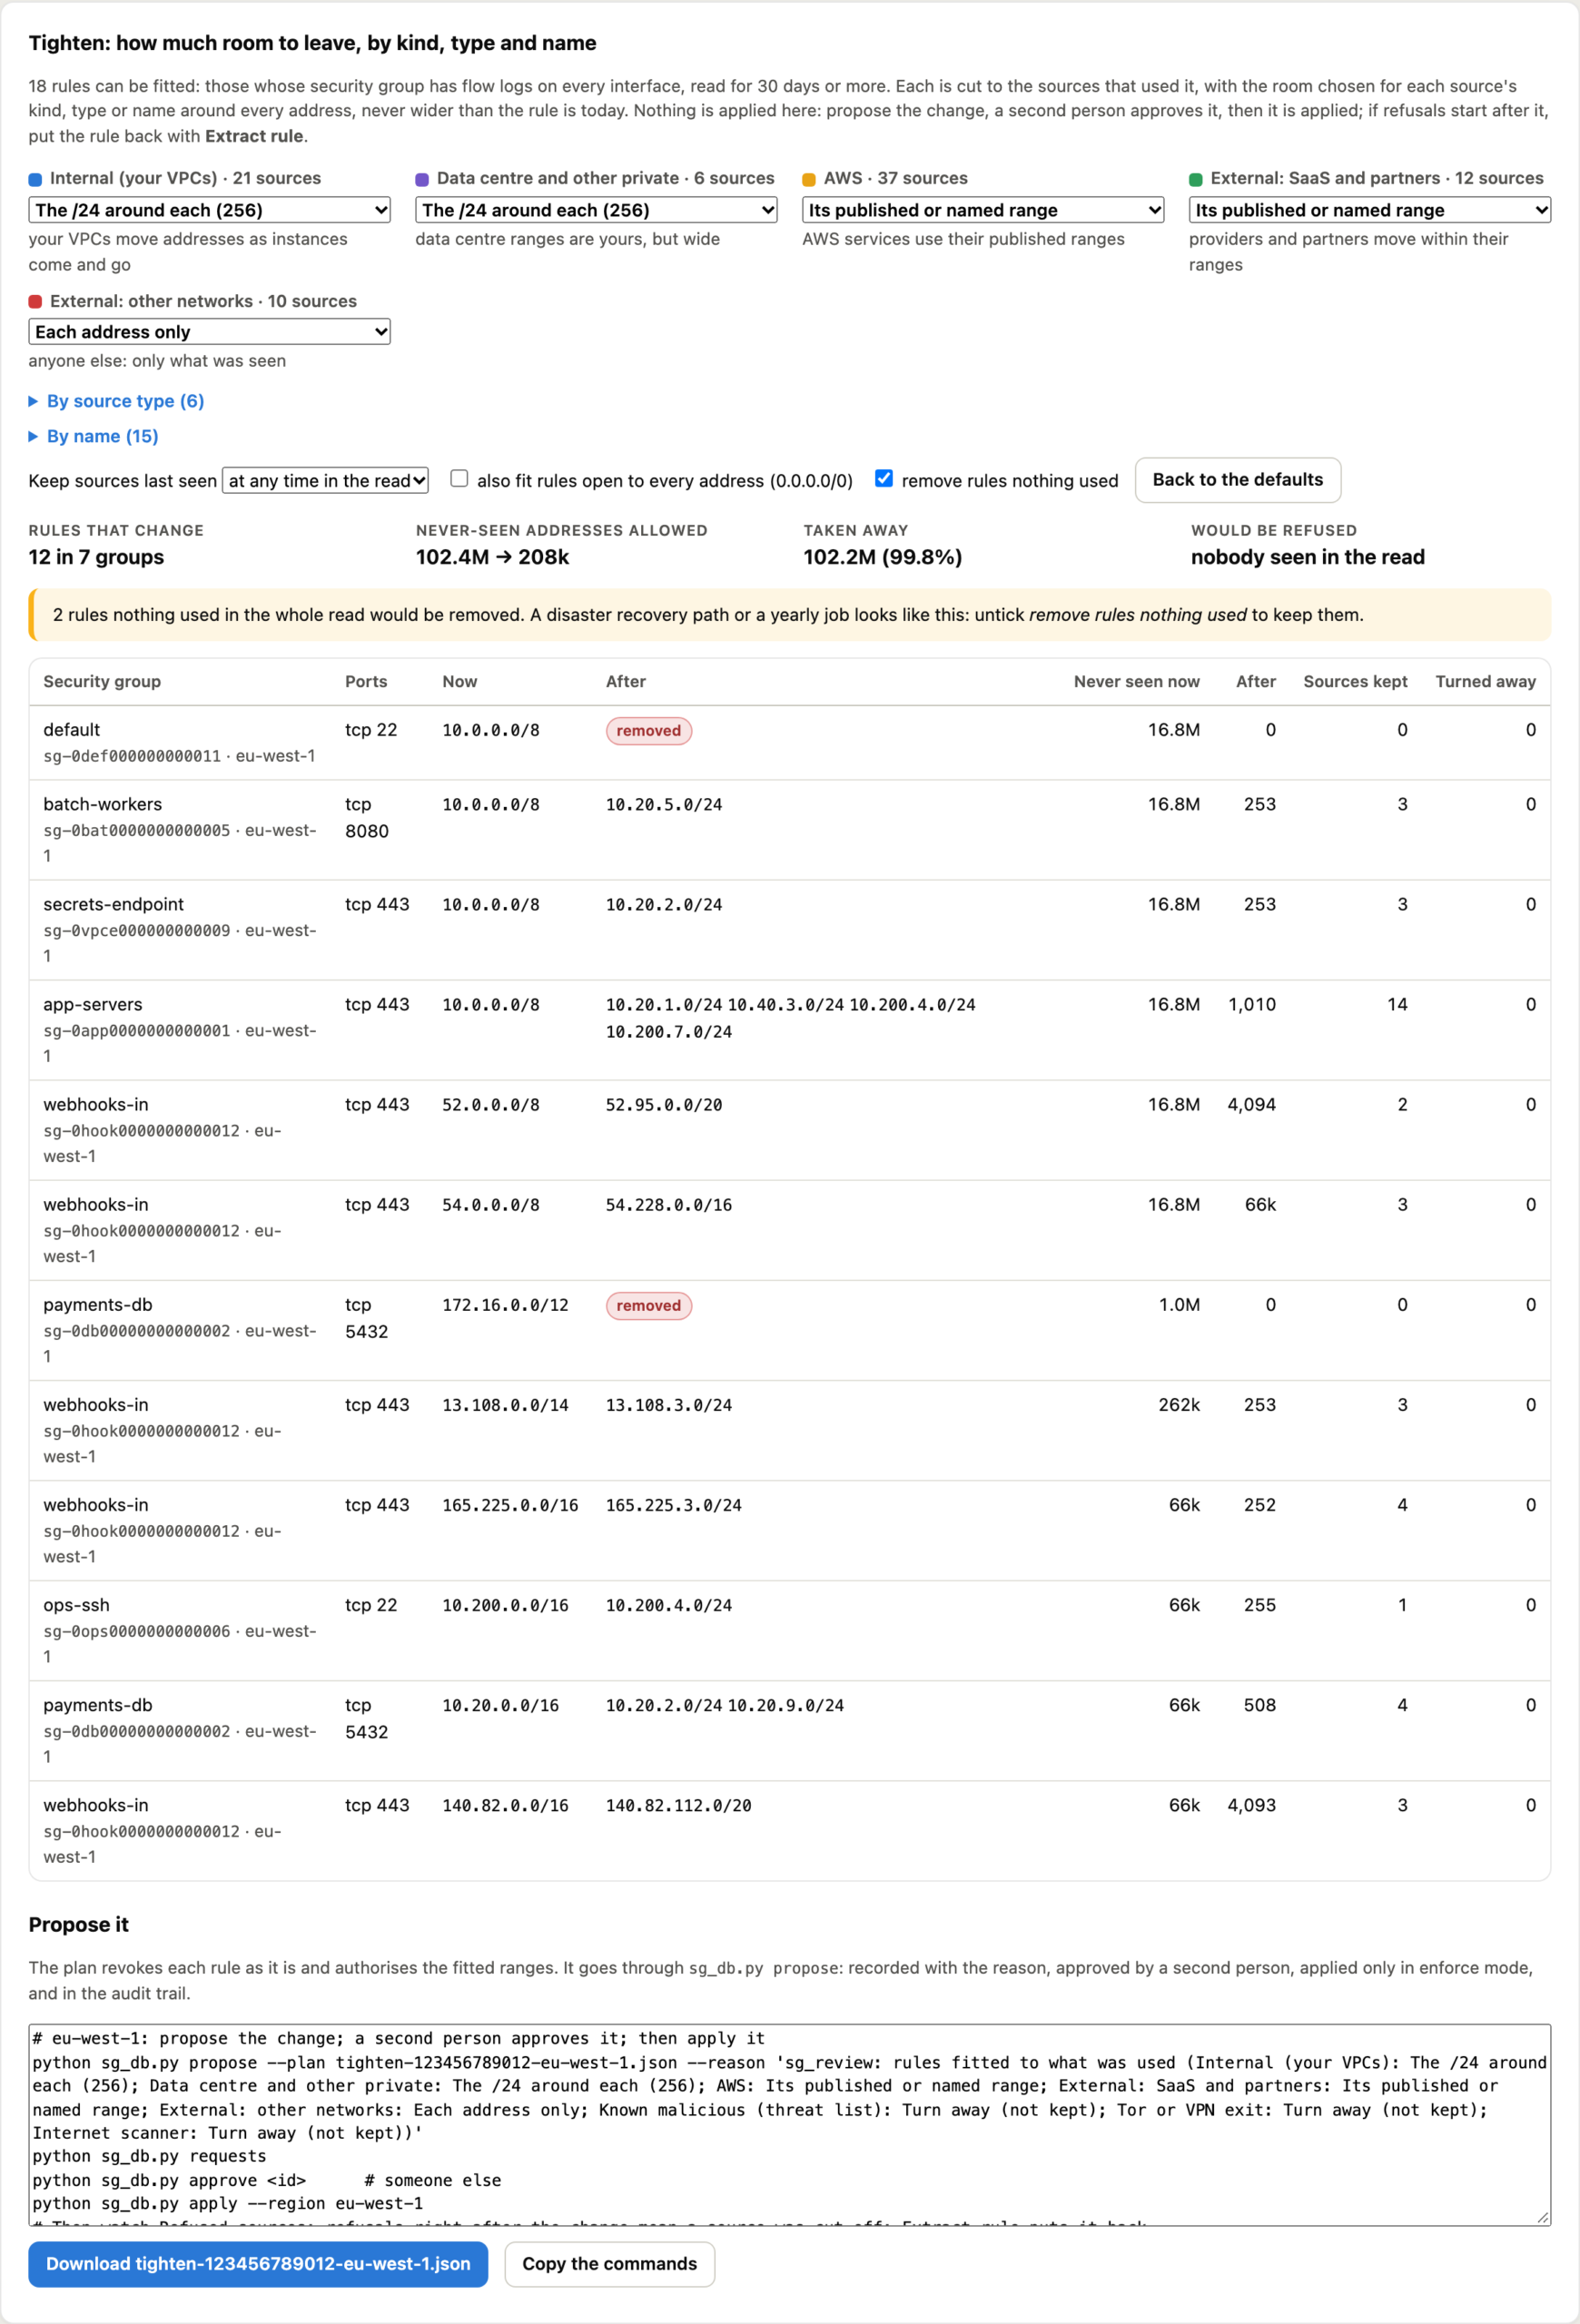
As you change the settings, the graph’s last point drops to an After point: what would be left. In the demo, the defaults take the account from 102.4 million never seen addresses allowed to 208 thousand, 99.8% less. The table lists every rule that changes, its ranges now and after, and the sources kept and turned away. Rules nothing used in the whole read are removed by default, with a warning that a DR path or a yearly job looks the same, so you can keep them. Rules open to every address are left alone unless you ask, because a public website has to stay public.
Nothing is applied from the page. Propose turns the result into a change request (from the console) or a signed plan file for sg_db.py propose --plan. A second person approves it, and it is applied only in an account that has been switched to enforce mode.
4. Mistakes show up in minutes, and are put back in one step
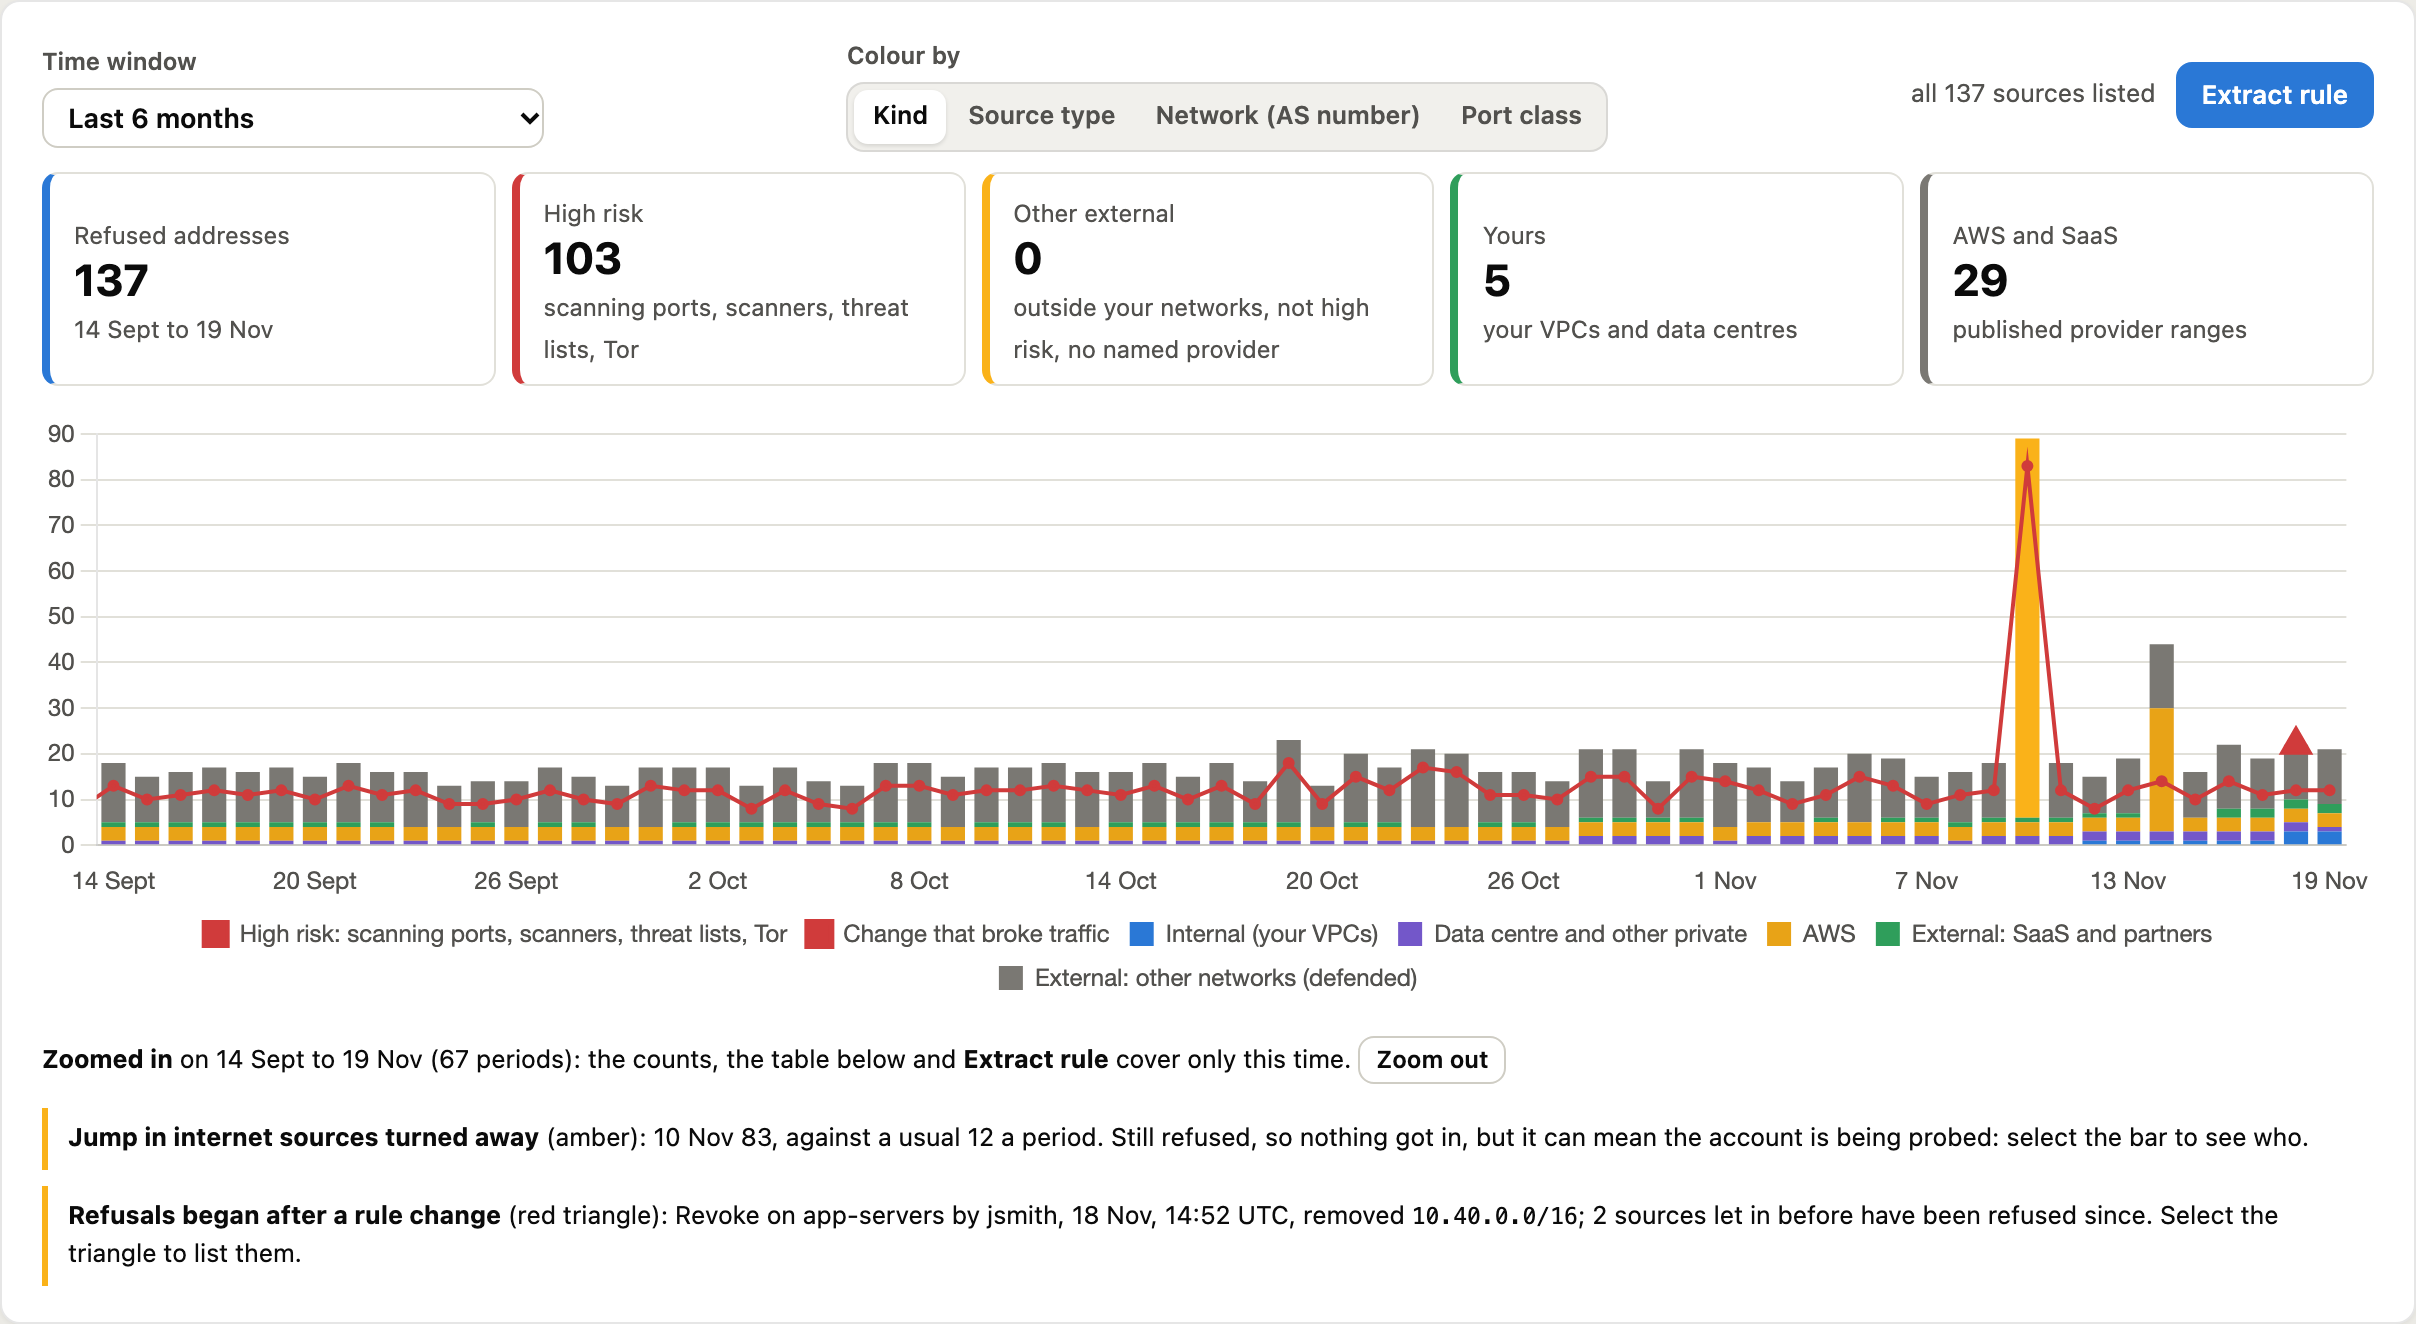
The point of putting tightening on a timeline is that a mistake is visible immediately. The demo tells exactly that story. A webhooks-in group was opened to every AWS, GitHub and Zscaler address. Eight days ago the network team narrowed 13.0.0.0/8 to Salesforce’s /14, which is the ▼ on the timeline. The Lambda callers in 13.244.0.0/15 were refused straight away, which is the grey spike right after it. The range was put back the next day, the ▲.
Before you propose anything, the panel tells you who would be refused:

The refused timeline: a counter, high risk in red, and zoom
The refused graph is a timeline of the addresses turned away in each period, with a counter above it: refused addresses, split into High risk, Other external, Yours (your VPCs and data centres) and AWS and SaaS. Anything scanning ports (10 or more ports, or 5 or more addresses), a known scanner, an address on a threat list, or a Tor or VPN exit is high risk: it gets a red pill saying why, and the red line on the graph is how many there were in each period. Select a box or the line to list them.
Drag across the graph to zoom into a period, such as the hour after a change. The counter, the table below and Extract rule then cover only that time.
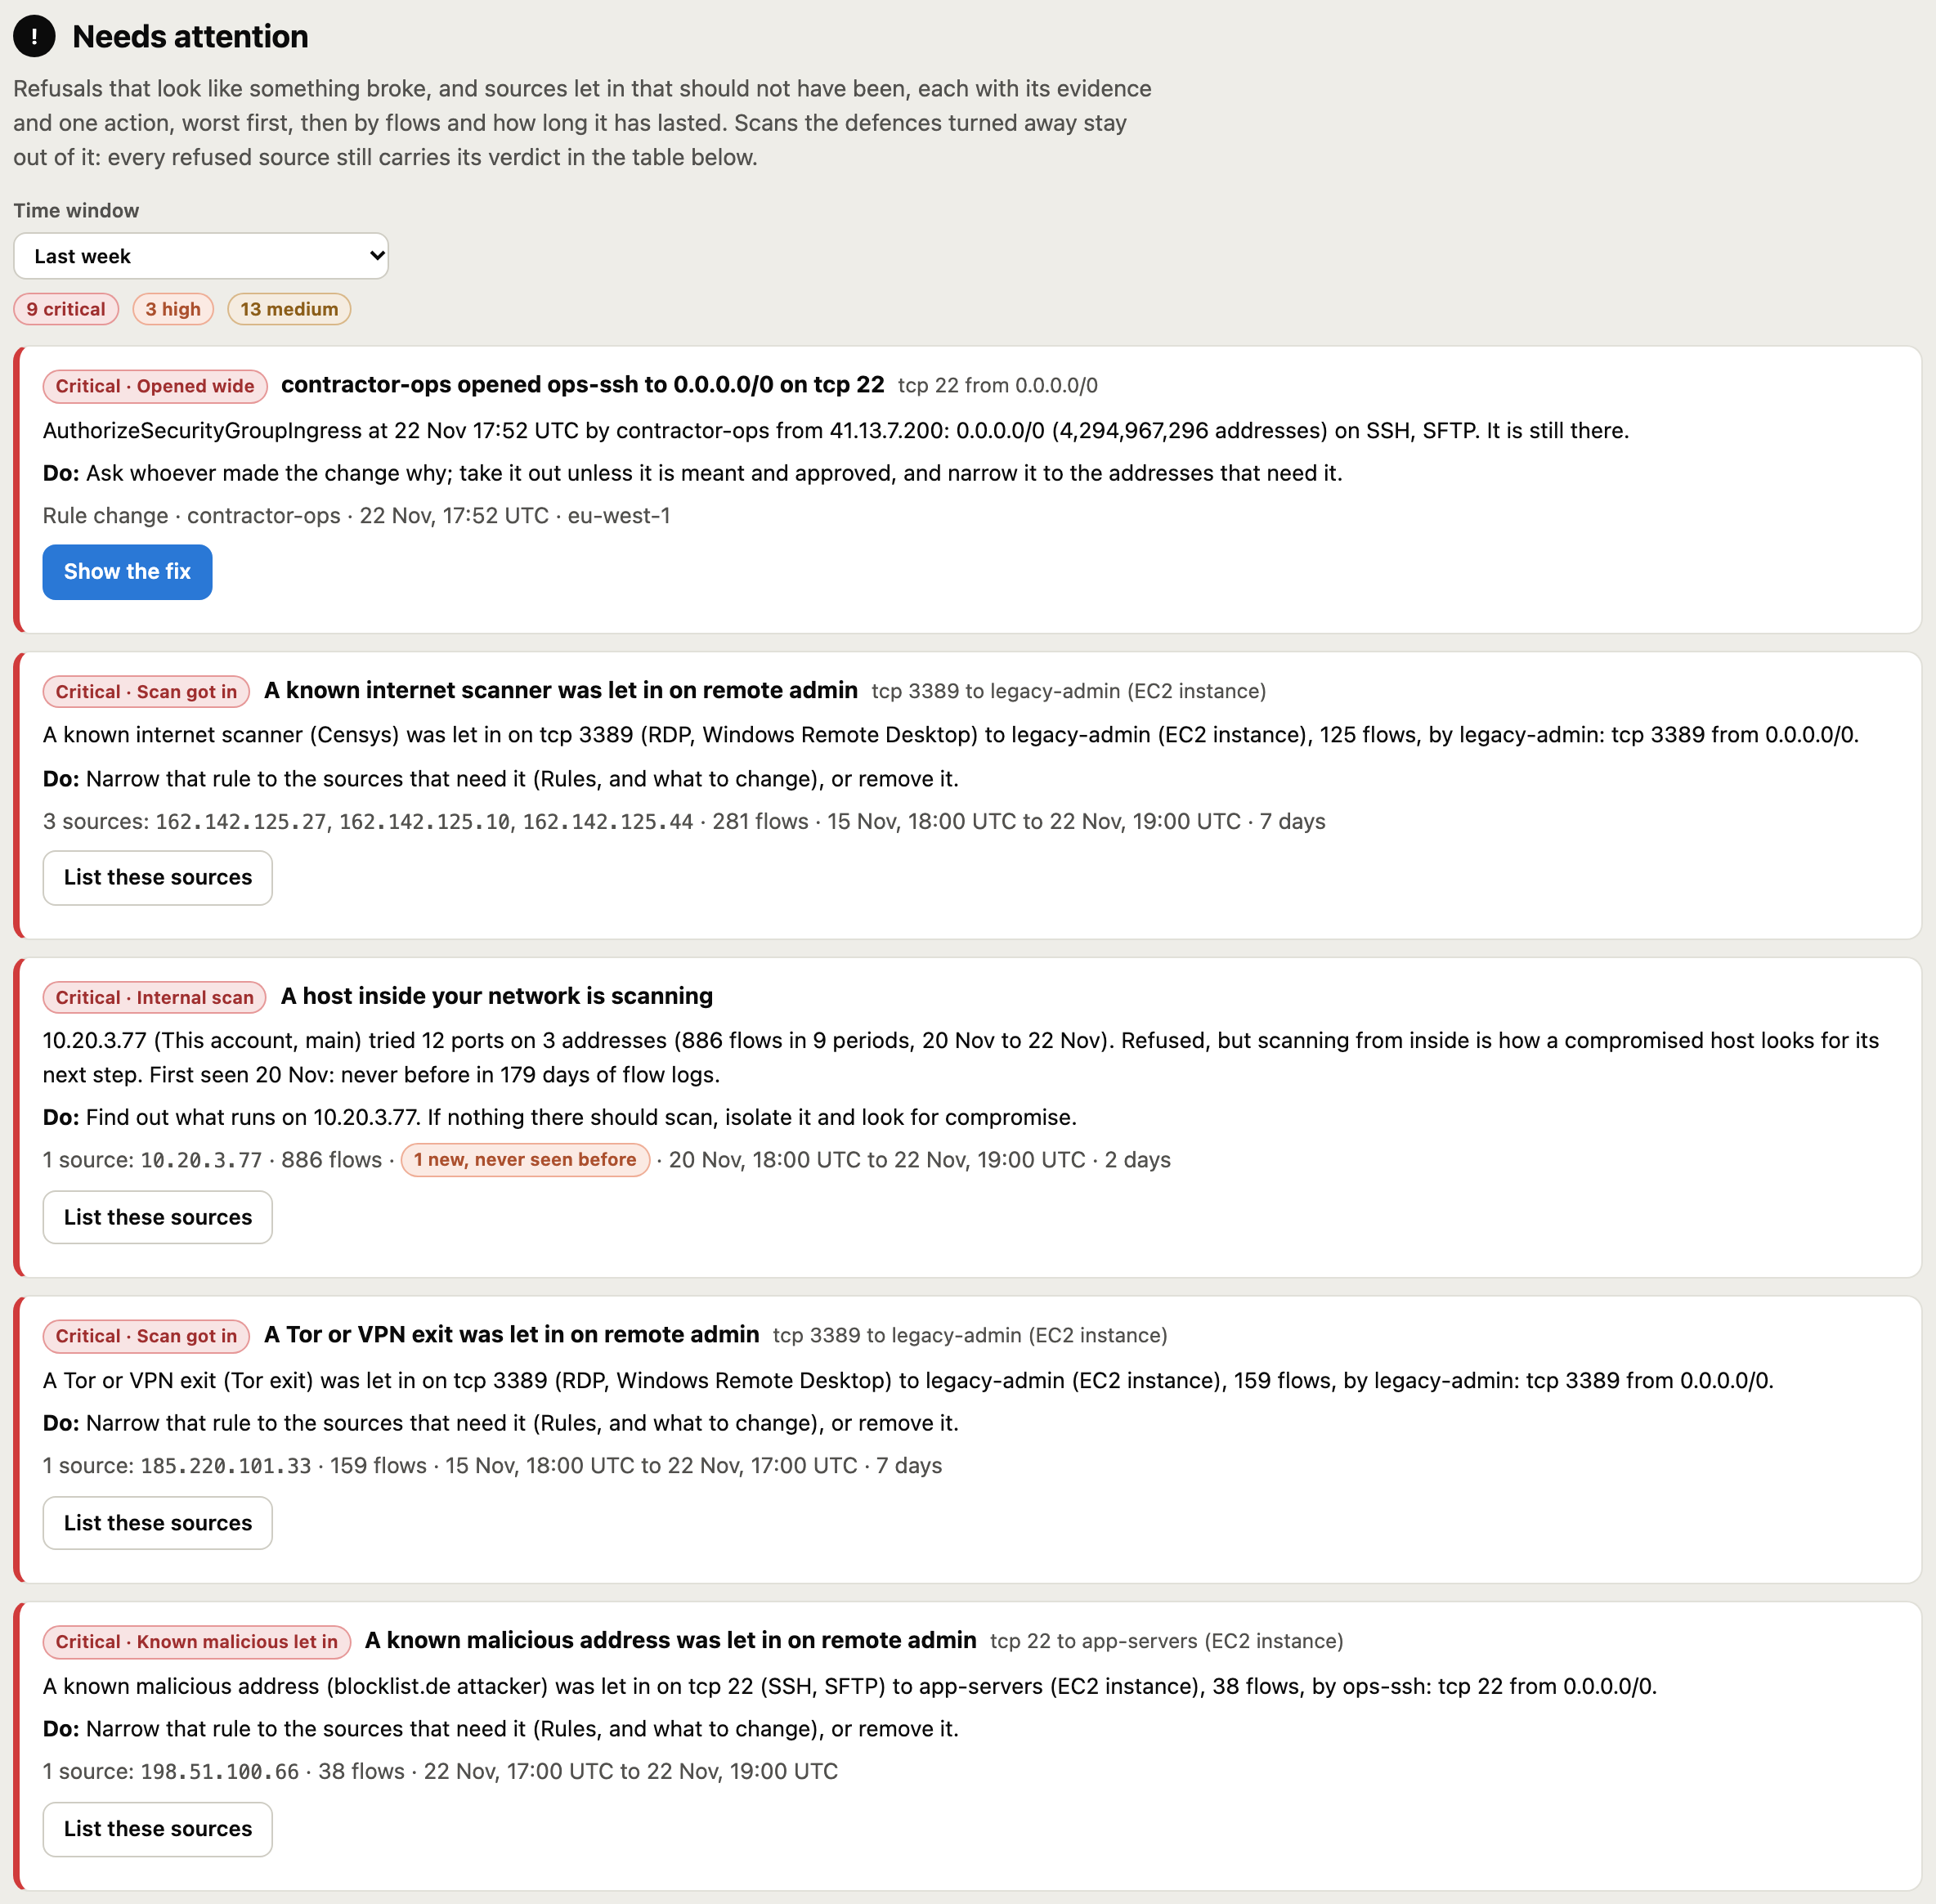
After a change is applied, sg_review.py watch --loop reads the flow logs every 5 minutes and alerts Slack or email on rejected traffic that needs attention. The repository ships ready-made jobs for this in deploy/alerts: one settings file for the Slack webhook and email, a systemd service, a launchd agent for a Mac and a crontab, running watch every 5 minutes and sg_db.py reconcile hourly, so changes made outside the tool are reported too. The Needs attention box at the top of the page puts a rule change that cut traffic off first, with the command that restores it:
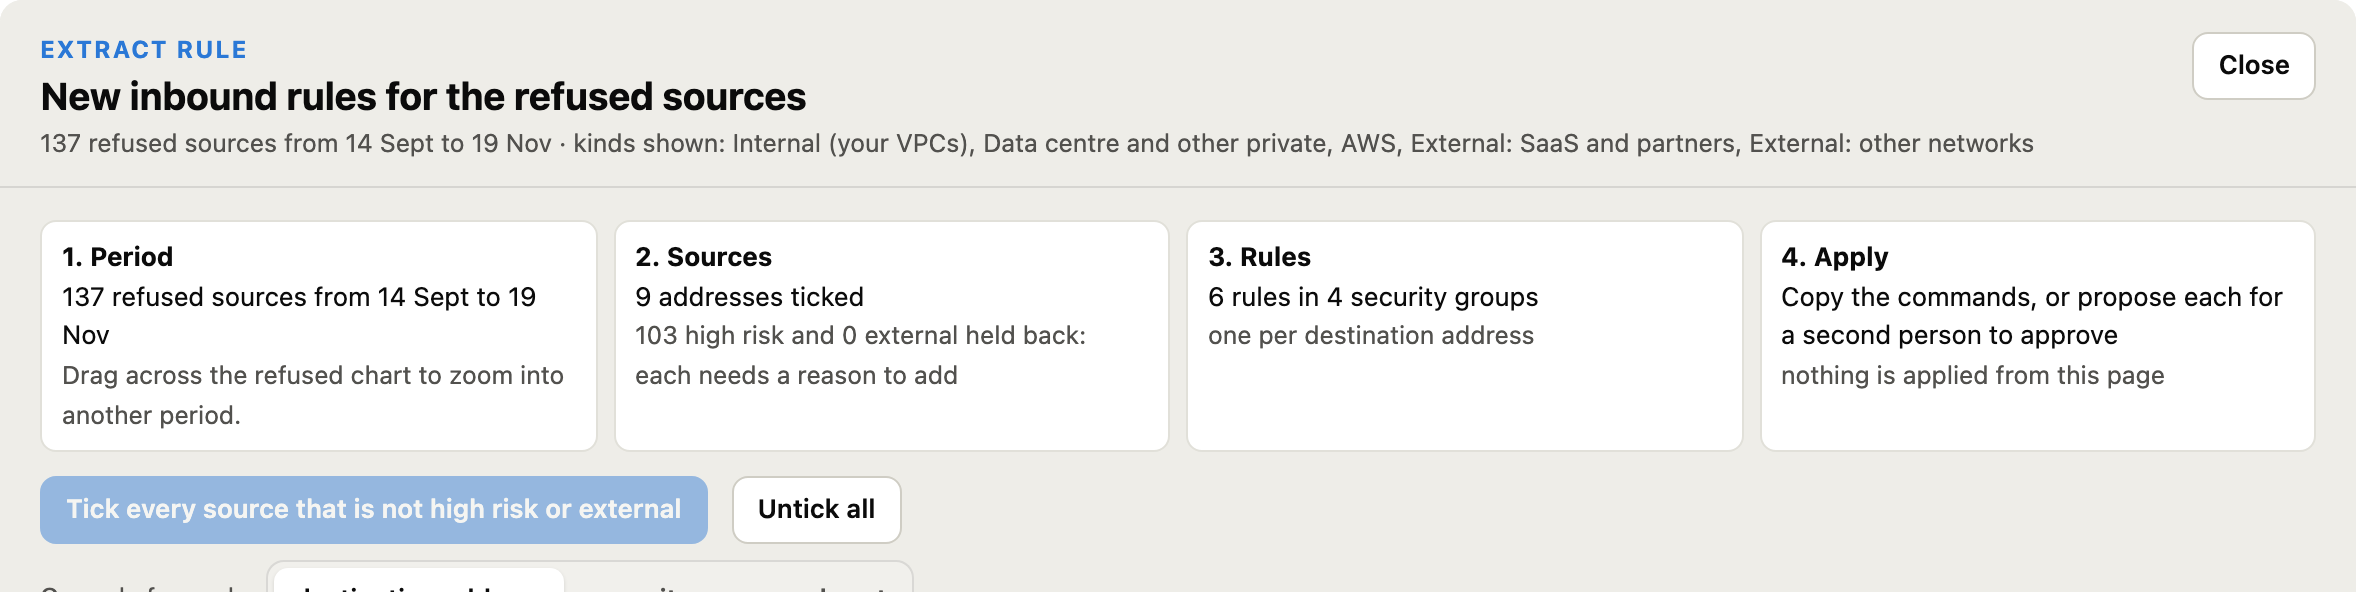
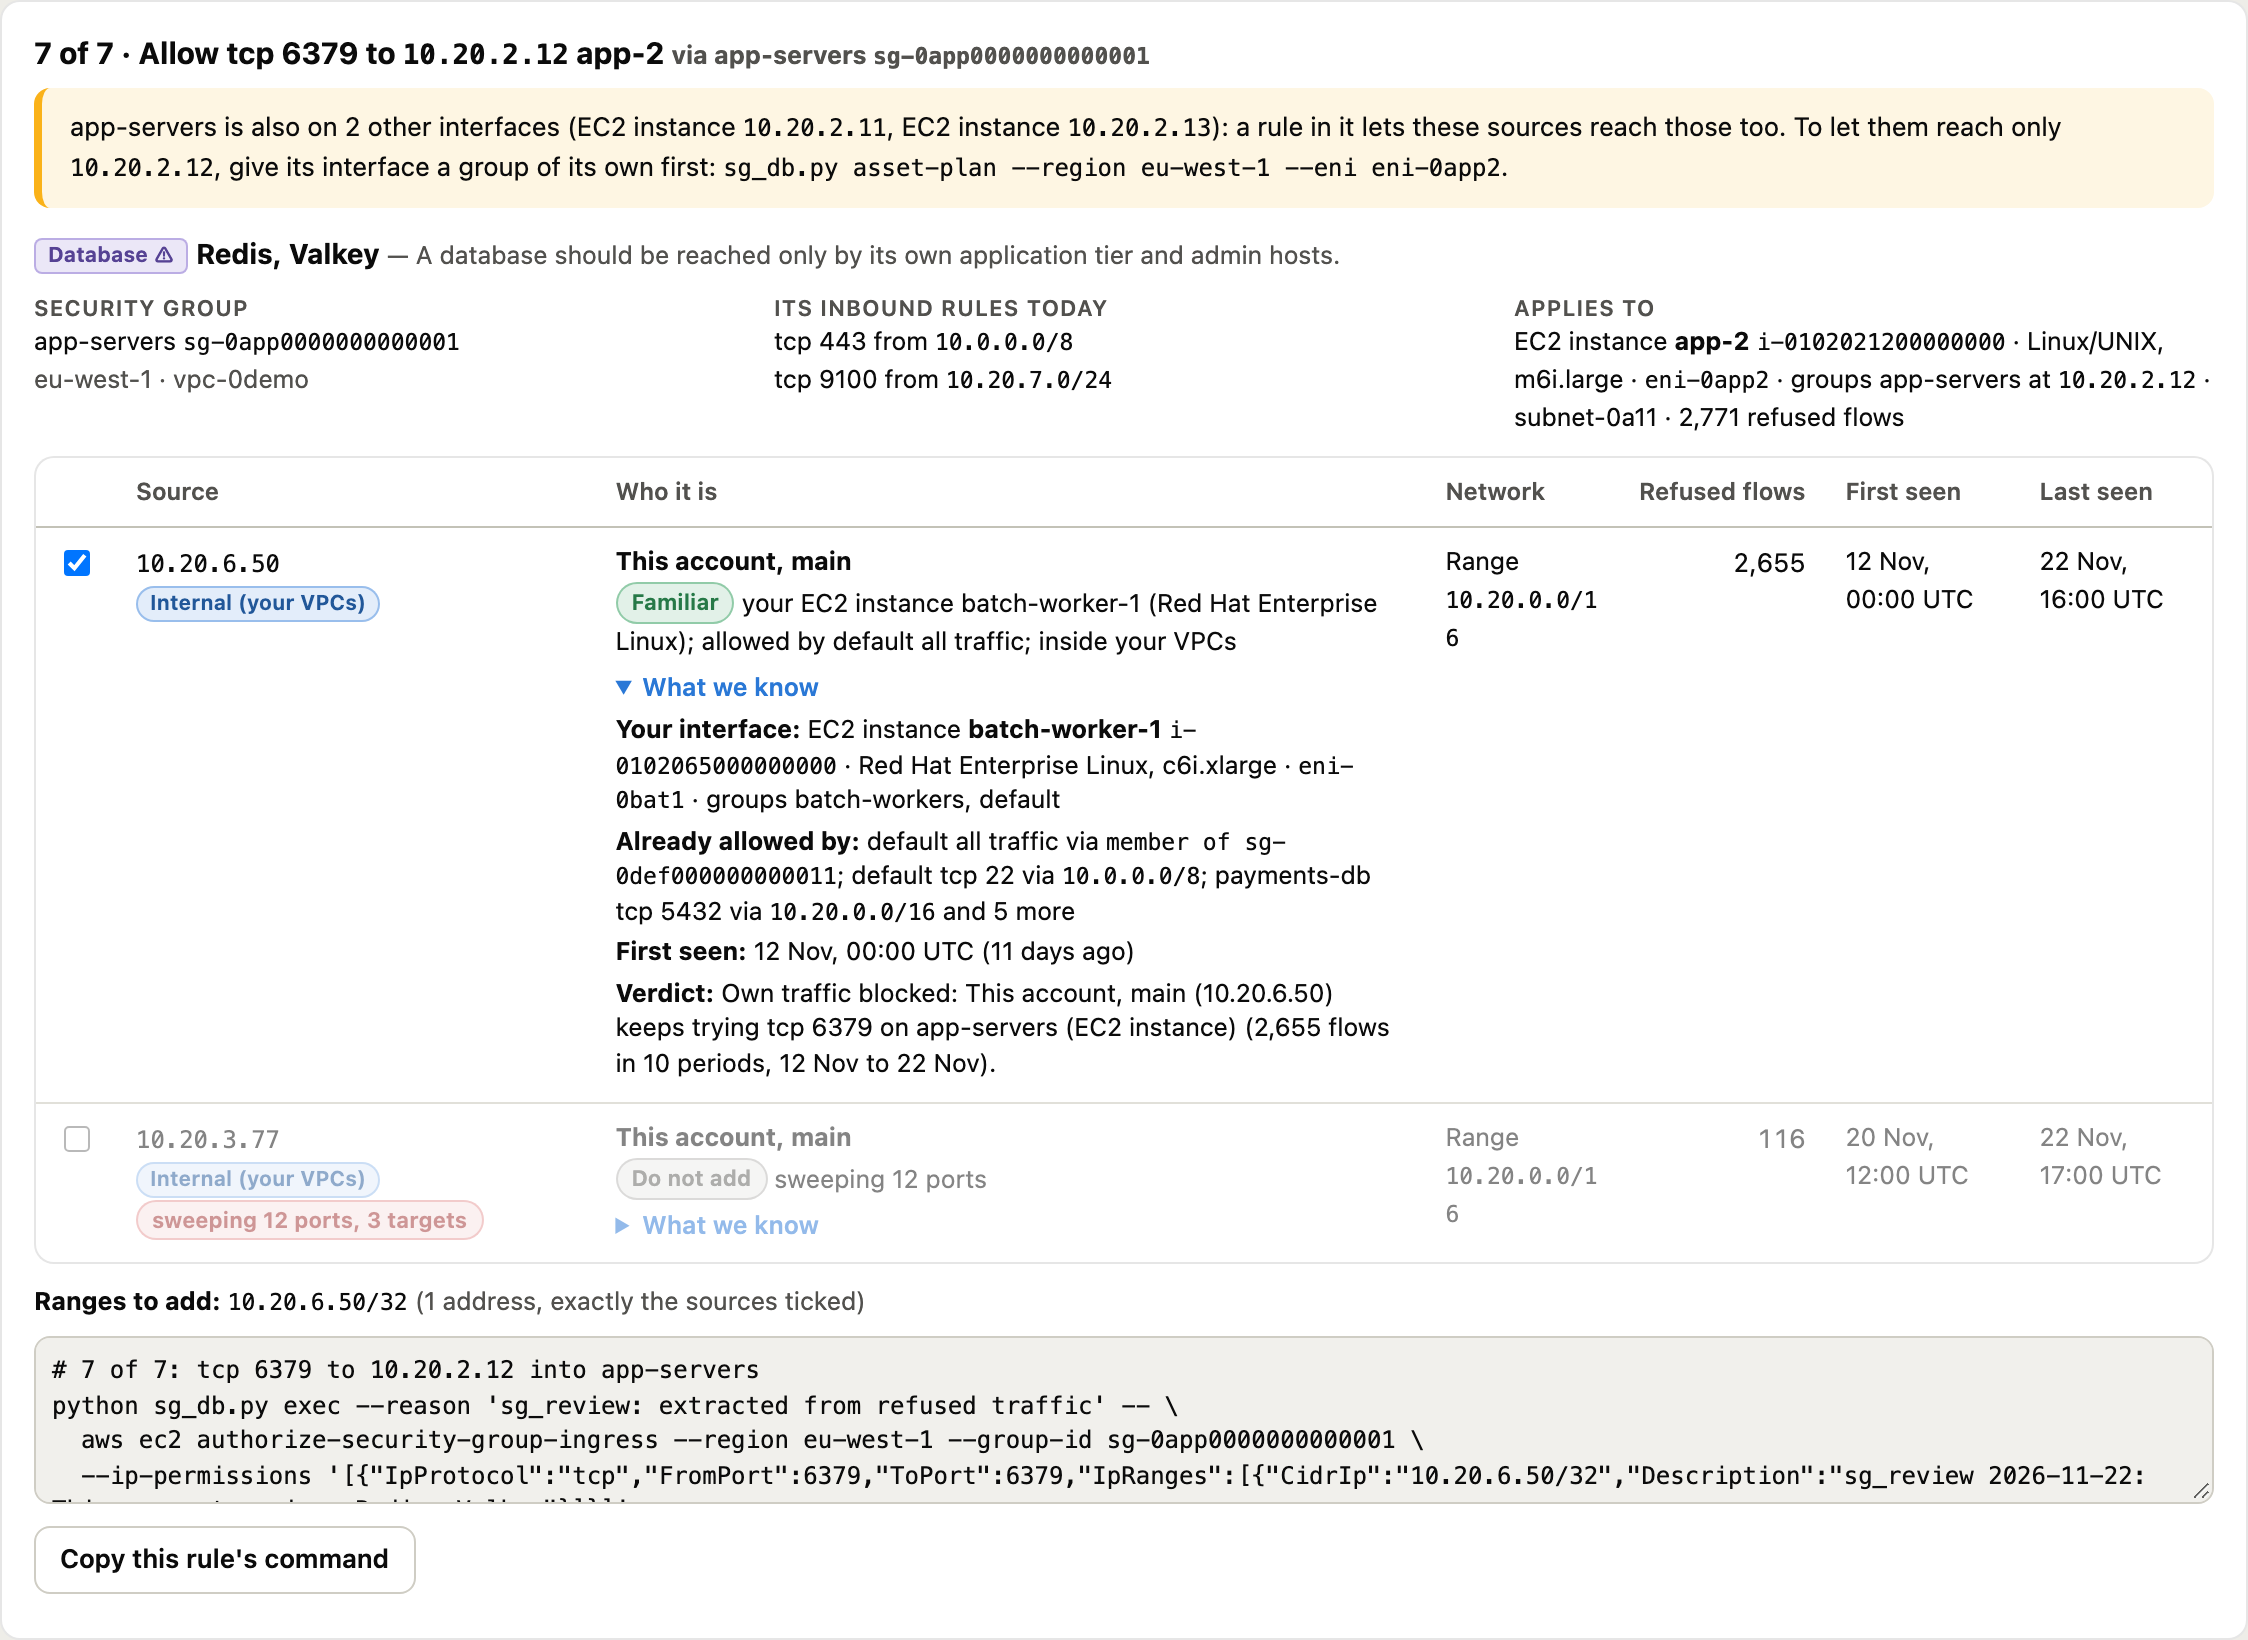
On the refused graph, Extract rule turns the refused sources in the period you chose into the exact inbound rules that would let them back in. It is a four step process: Period, Sources, Rules, Apply. One button ticks every source that is not high risk or external.
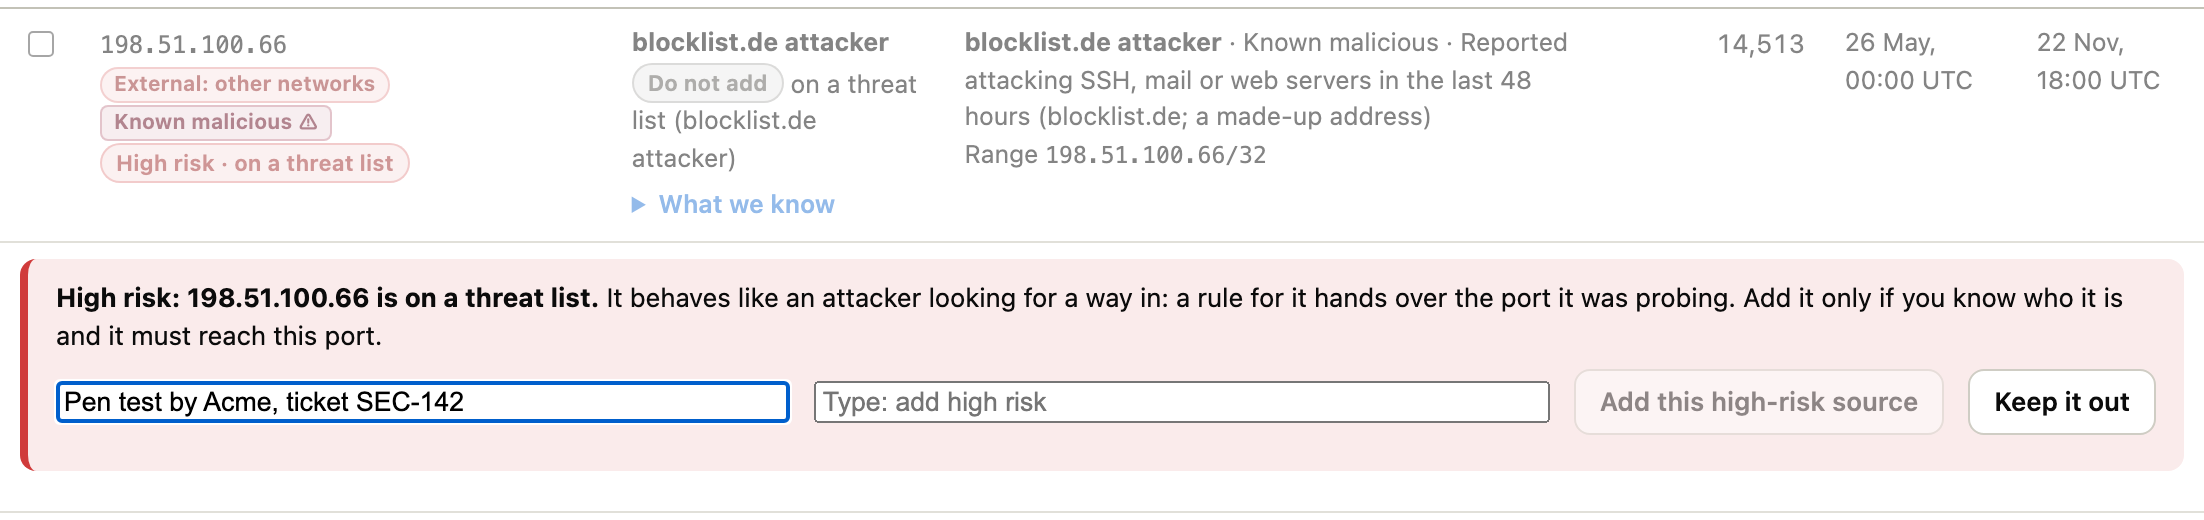
It will not let you easily add a high risk or an external address. Both always start unticked, and ticking one opens a box asking who it is and why it must be let in; a high risk source also needs the words add high risk typed. The reason goes into the command’s --reason, the change request and the audit trail, so letting a scanner in is never a single click and is always explained.
The rules themselves are exact. It does not add them all in one go: by default there is one rule per destination address (the interface that refused the traffic) and port, numbered “1 of 7”, each with its own command and, from the console, its own Propose this one button. Add one, watch its refusals stop, then the next. If the destination’s security group is also on other interfaces, the card says so, because a rule in a group reaches every member, and gives the sg_db.py asset-plan command that gives that one interface a group of its own first.
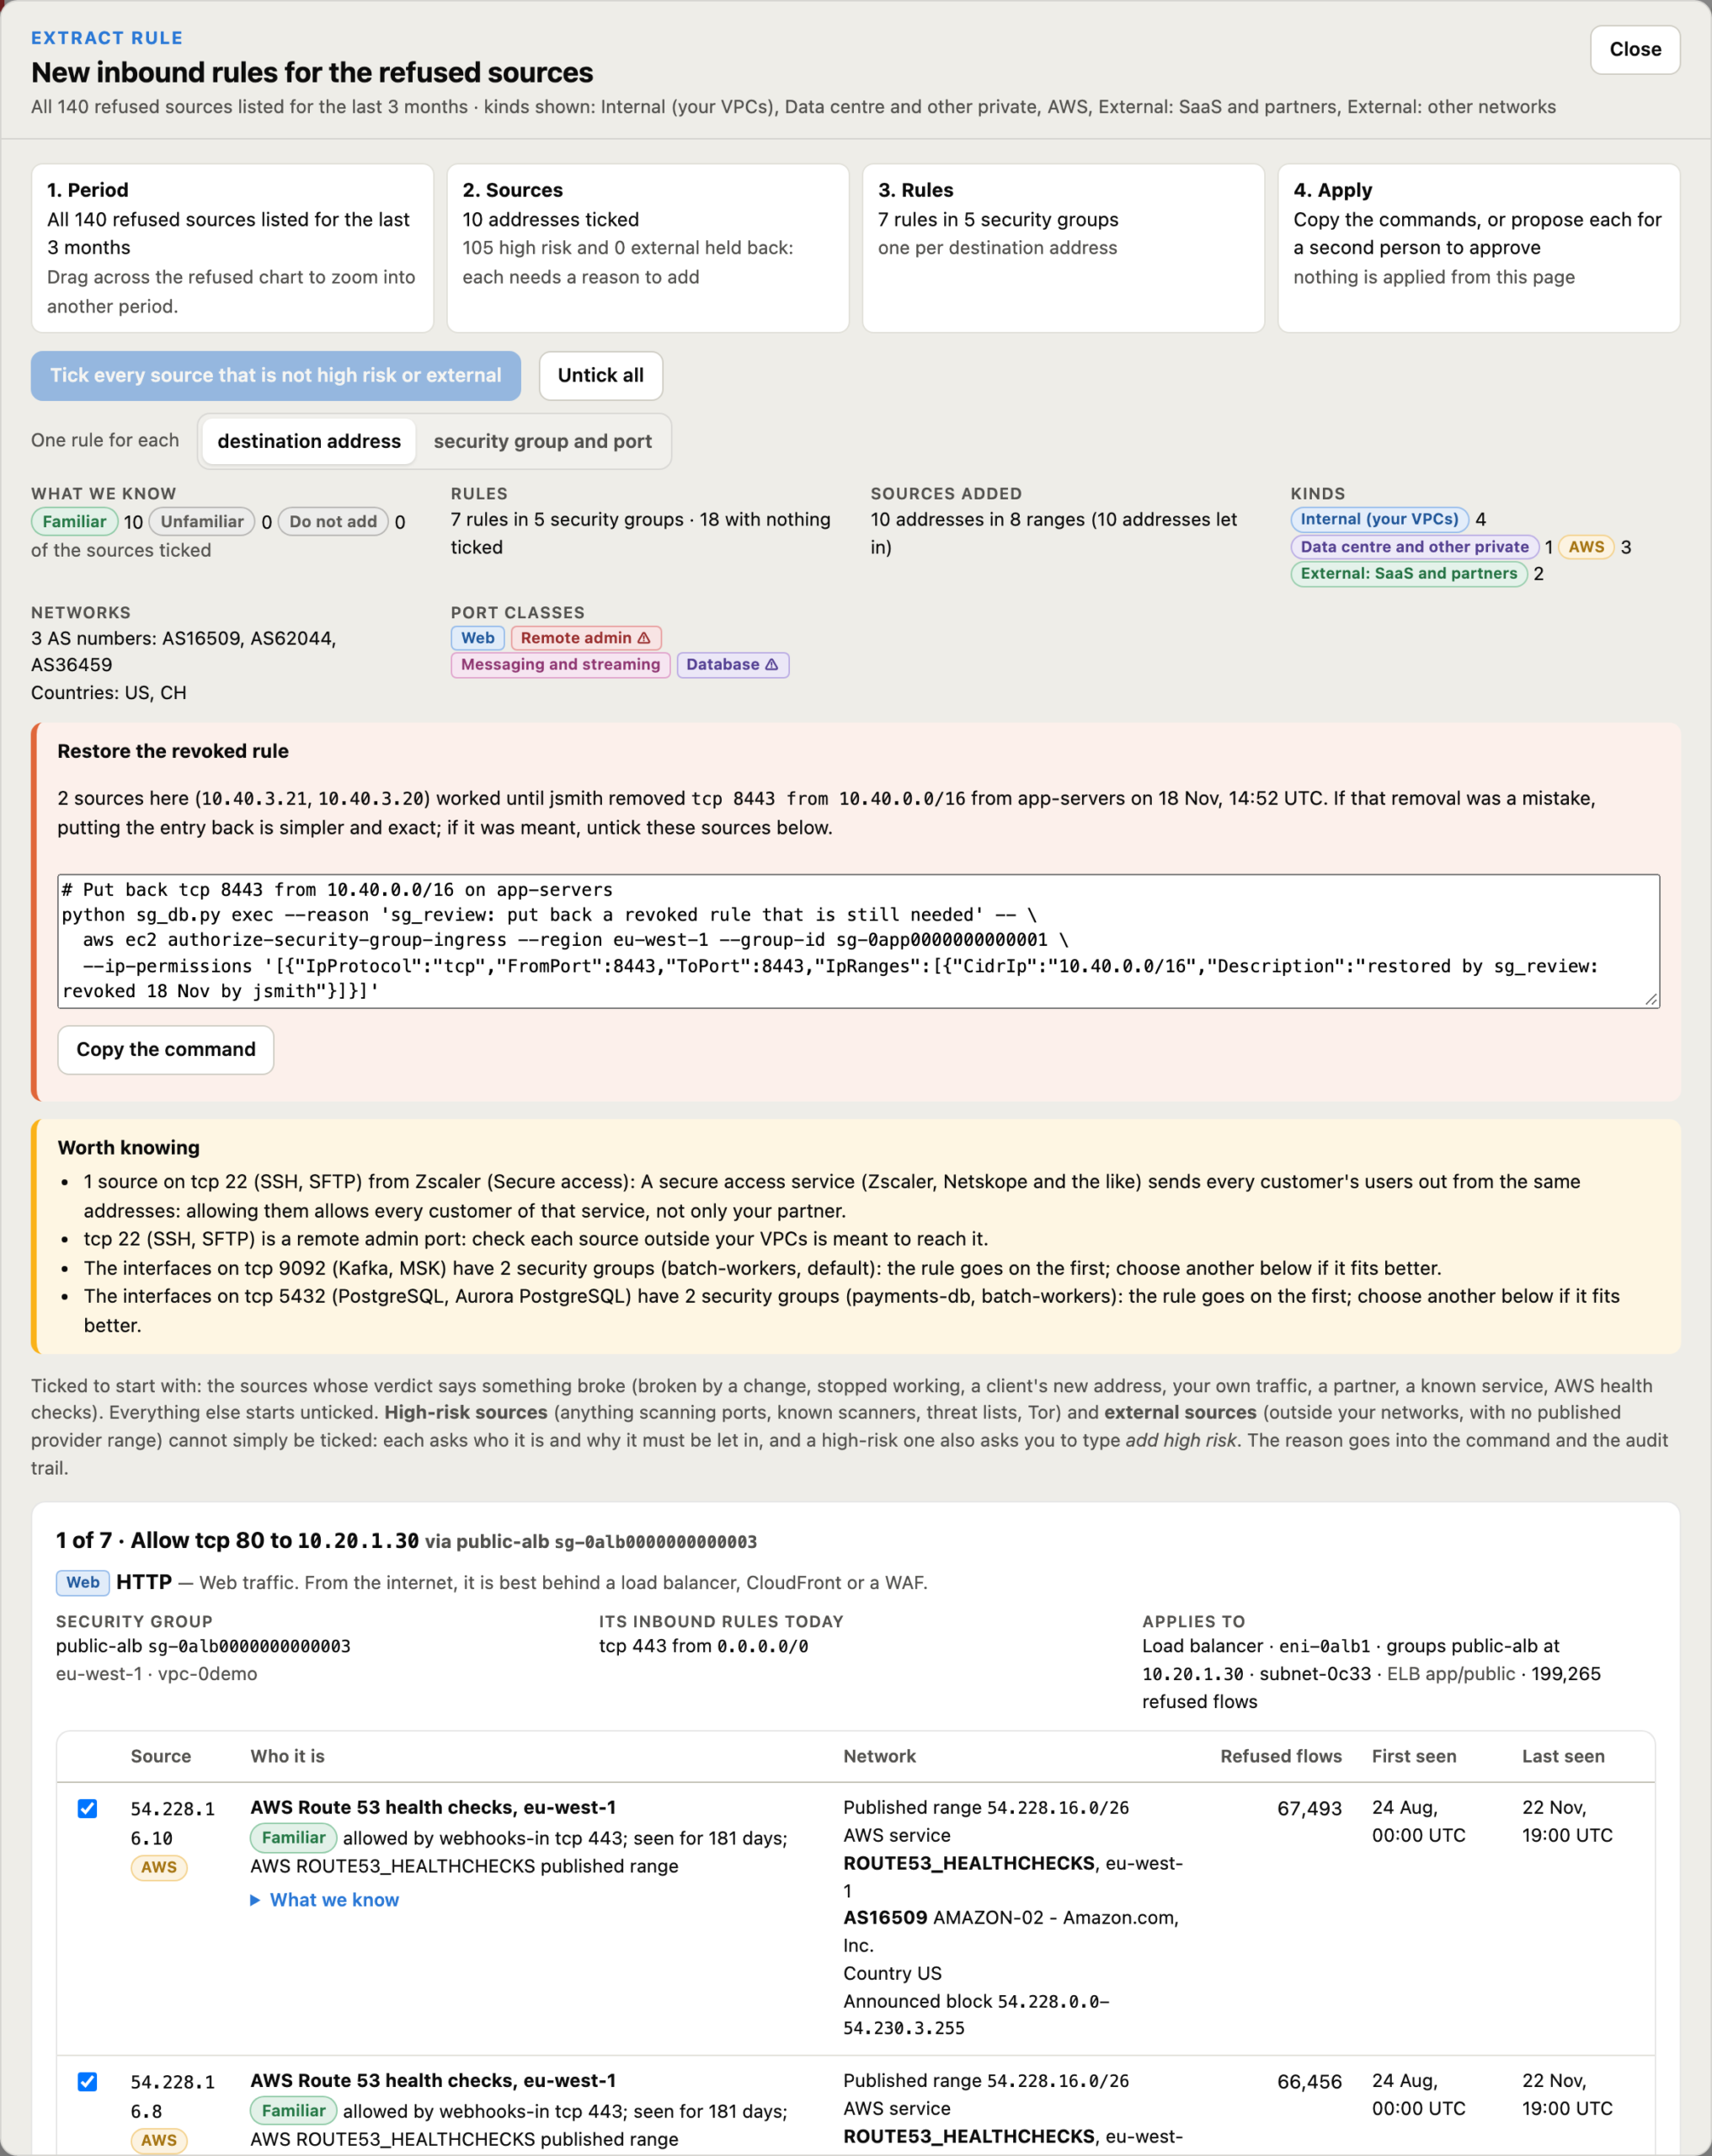
Before you let an address in, you want comfort that it is safe. Every source is marked Familiar, Unfamiliar or Do not add, and What we know opens the evidence:
- Your own interface: if the address is inside your VPCs, the instance behind it, its Name tag, its operating system (Linux, Red Hat, Windows, read from EC2) and type, and its security groups.
- Already let in: every port it is already allowed through, to which instance, how many flows and since when.
- Already allowed by: other rules whose range already covers it.
- First seen: how long it has been around, and whether it is new this week.
- Also refused: what else it tried, and the verdict (a threat list, a Tor exit, a scanner or a host sweeping ports is Do not add).
An outside address nothing vouches for is Unfamiliar: find out who it is before adding it. Flow logs cannot tell you the operating system of an address outside your account; for your own hosts they don’t need to.
5. Blast radius: how far could one compromised host get?
This is the board question from the start of this post, answered for one address. Type an address into the Blast radius card under the Tighten panel (a data centre laptop, a build server, a partner’s egress address, or “anyone”) and the page lists every security group, port and network interface it can reach today, worst first. Risky ports (remote admin, databases, Windows and directory) are marked ⚠, and rules that let it in only because they are open to every address are counted apart. An address inside one of your own groups also reaches every rule that names that group as its source.
It follows the Tighten settings, so you see the reach before and after. In the demo, data centre host 10.200.4.22 reaches 9 groups on 8 interfaces, 4 of them on risky ports. With the default Tighten it reaches 6 groups on 5 interfaces; fit the rules open to all as well and it is down to 4.
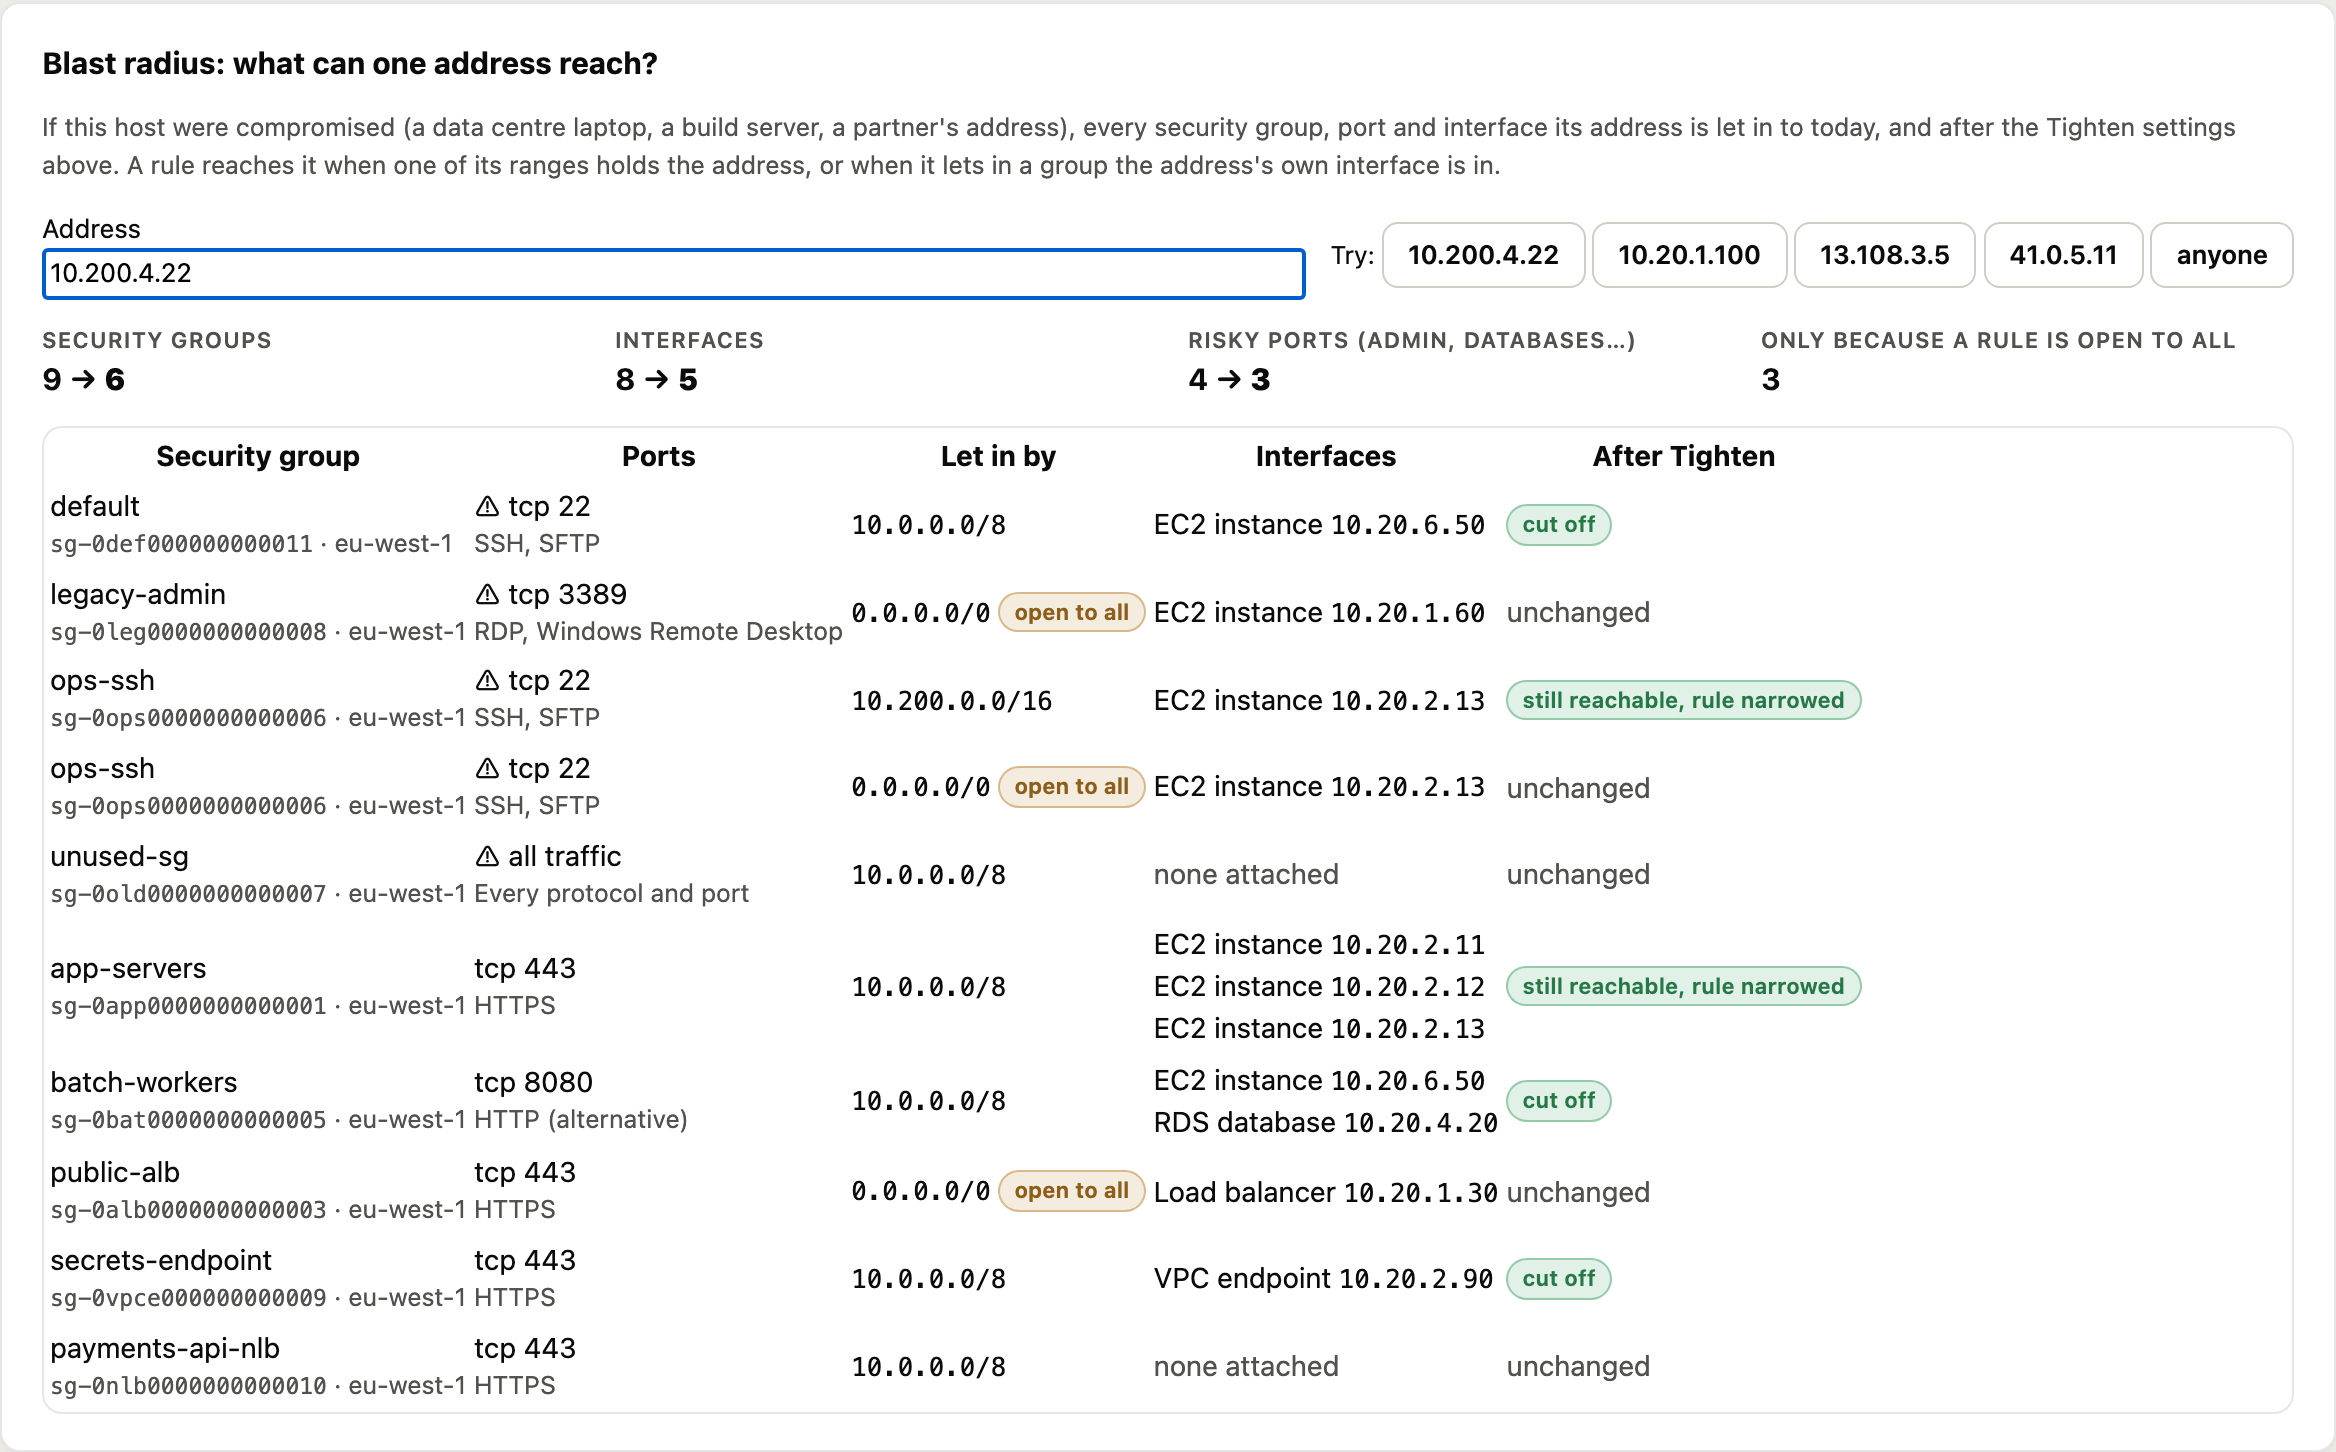
The same from the command line, from what was already read, with no AWS call:
python sg_review.py reach 10.200.4.22 --account 123456789012
# 10.200.4.22 can reach 9 security group(s) on 8 interface(s);
# 4 on risky ports, 3 only because the rule is open to every address
Run it for the hosts you worry about most: the jump box, the CI runners, the VPN pool. If the answer surprises you, that is where to tighten first.
6. Security groups live in a local database, not in Terraform
Every security group and rule is taken into a local SQLite database (sg_db.py import), from an API key or an SSO session, for one account or every account in an OU. The database is the source of truth: AWS is where rules are enforced, the database is where they are decided. Every change carries who, why and an optional ticket, in an append only, hash chained audit trail that sg_db.py verify proves nobody edited.
This is deliberately not Terraform. A security group’s sources are not infrastructure. They are a fact about who talks to whom, and that changes every week. If Terraform and sg-tightener both own a group, the next terraform apply puts the old /8 back. sg_db.py reconcile, run hourly, finds any change made outside the tool (in the console, the CLI or Terraform), records who made it from CloudTrail, and offers to put it back or keep it. A person decides.
7. Surveillance first, then apply per account, per group or per asset
Every account starts in surveillance mode. sg-tightener reads, reports what is over provisioned, works out what each group should be and records change requests, but applies nothing. That is the mode most organisations need first: evidence, not changes.
When the organisation is comfortable, the move to enforce is per account and deliberate:
sg_db.py check --regions eu-west-1 --assetsmakes every write as an EC2 DryRun, so nothing changes, and tells you whether this identity, with its SSO permission set, boundaries and SCPs, can actually apply in that account.sg_db.py mode enforce --account 123456789012 --reason "CAB-17"then allows approved changes to be applied, either across the account, one group at a time, or to one asset.- For one asset,
sg_db.py asset-plan --eni eni-…builds a group of its own from only the traffic that reached that interface. Once approved,asset-applycreatessgt-<eni>-…and moves the interface onto it.asset-revertputs it back. - Auto scaling, EKS and ECS assets are refused: new instances start from their launch template, so the right fix is to tighten the shared group, which every instance inherits.
- Every interface’s groups are recorded, and every change to them is in the audit trail, so you can ask what security groups a given instance had on any day.
8. One console, with two person approval
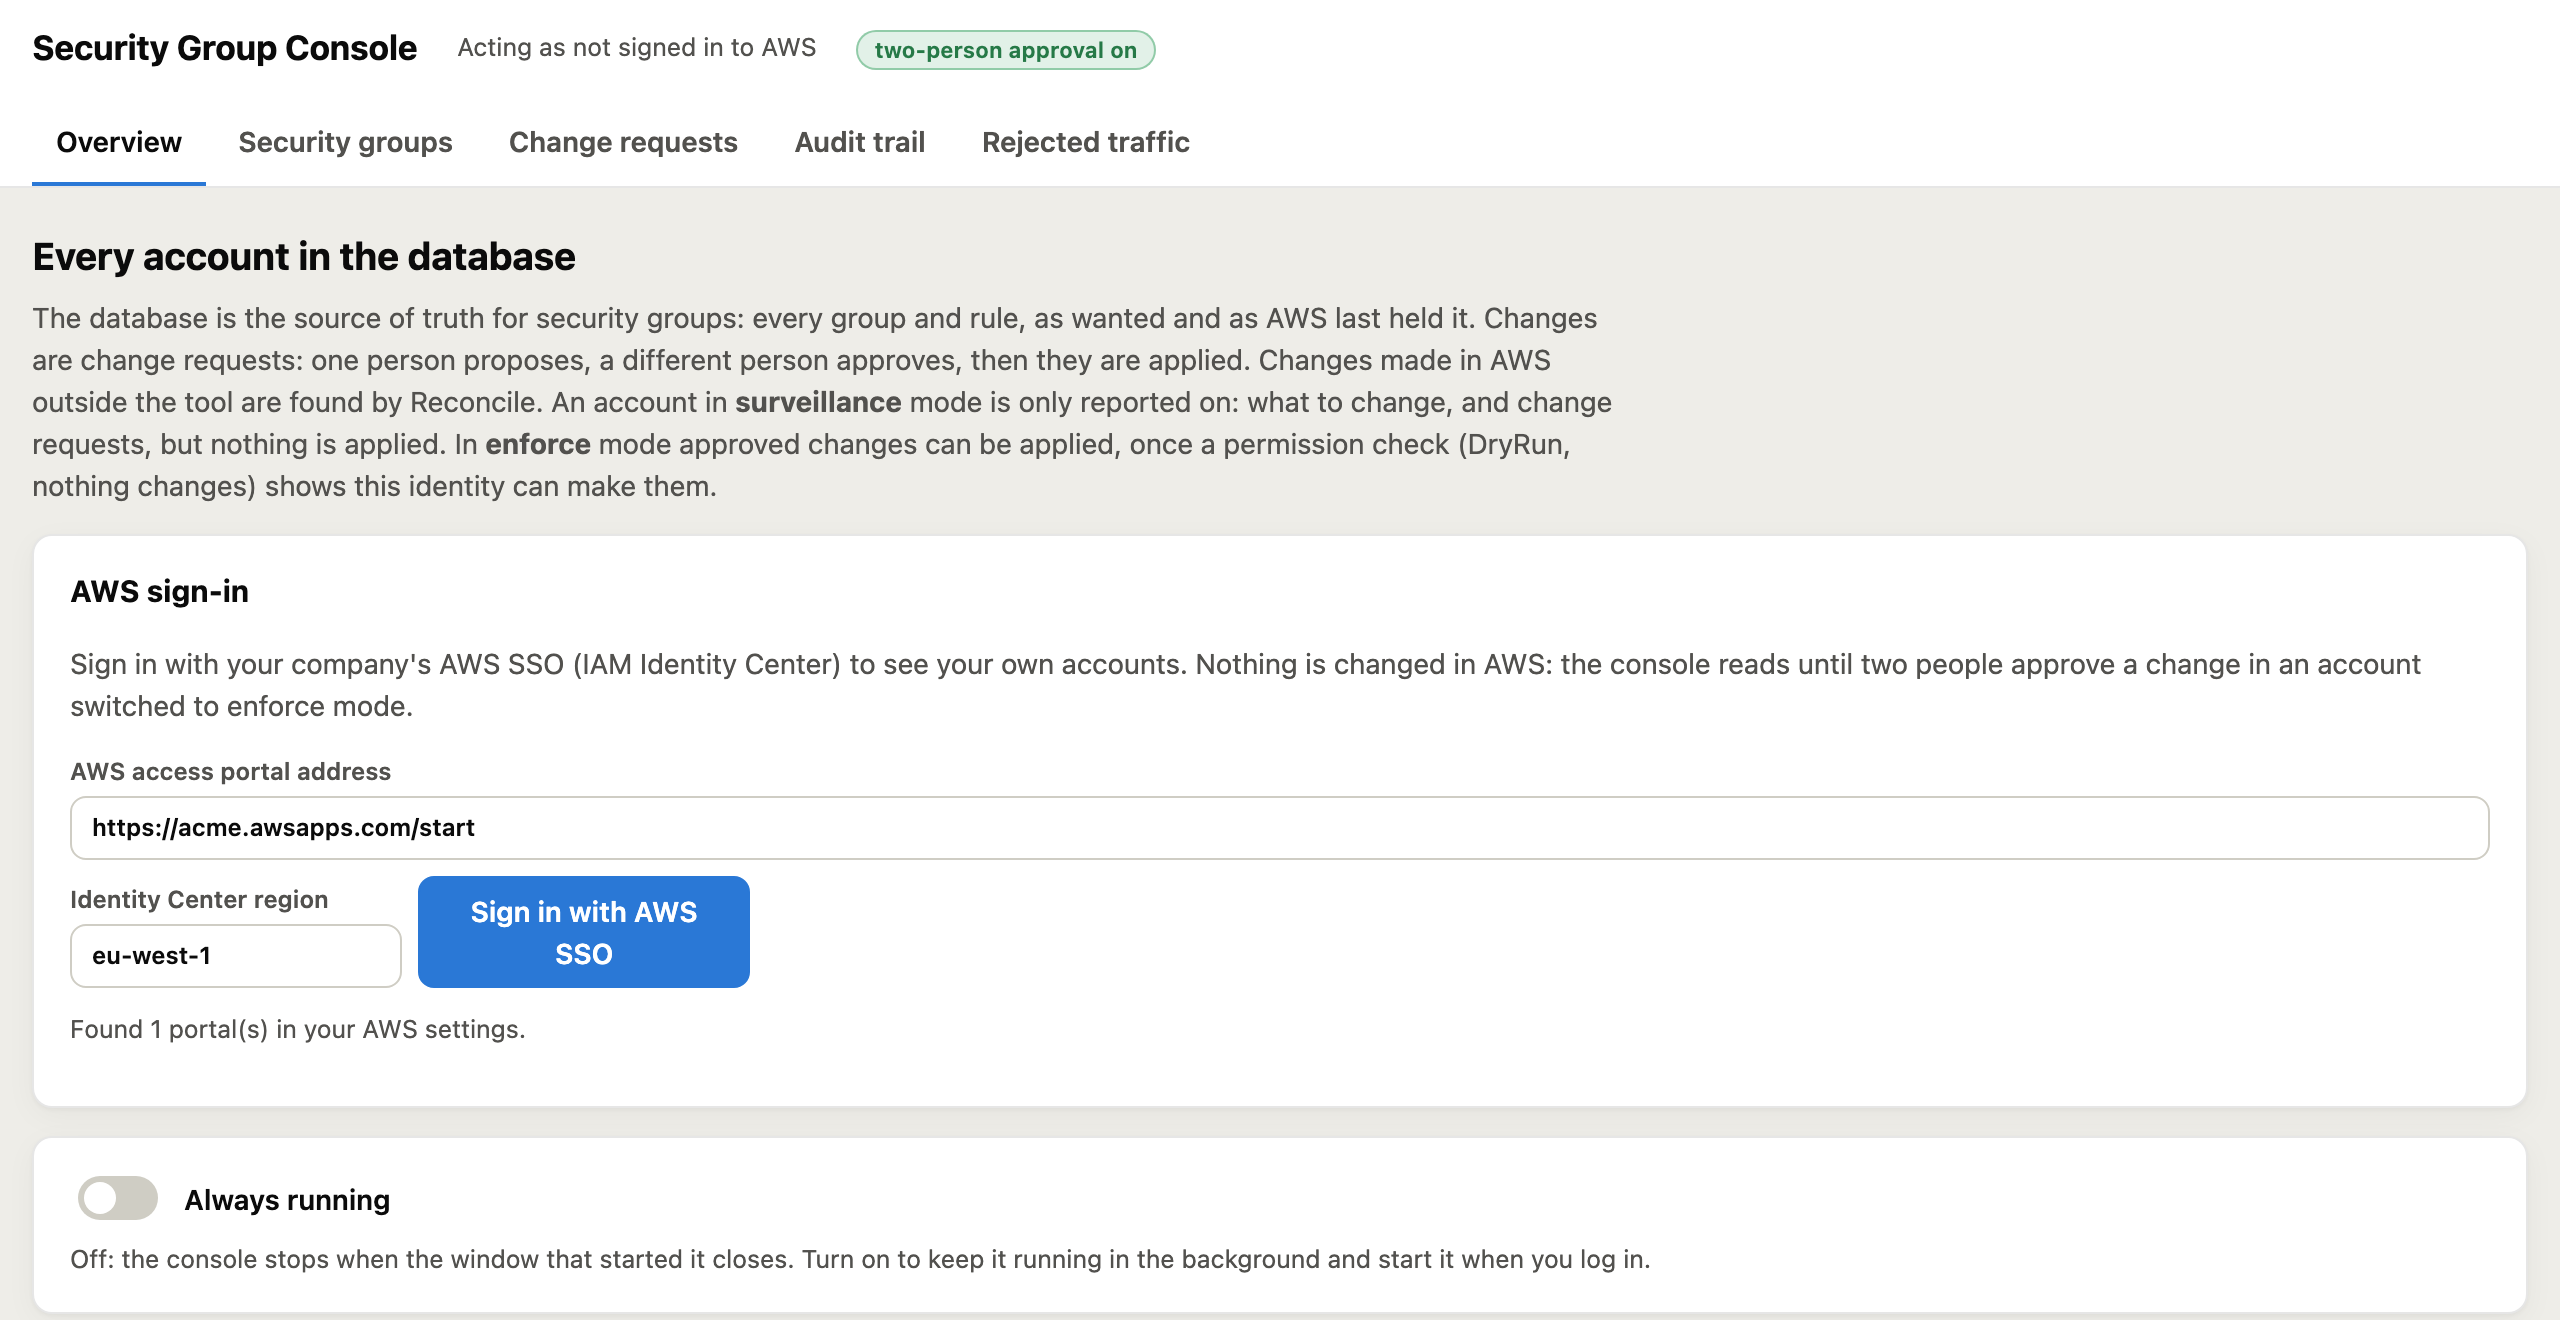
python sg_console.py install sets up a local web console that is always running: it starts when you log in and restarts if it stops (a launchd agent on macOS, a systemd user service on Linux), at a bookmarkable 127.0.0.1 address behind a token. serve runs it just for now. After that, no AWS CLI, profile or command line is needed.
Sign in with AWS SSO on the page. Enter your AWS access portal address (filled in from ~/.aws/config if it is there) and the console opens the AWS sign-in page with a code to check and approve. If you already ran aws sso login, you are signed in straight away.
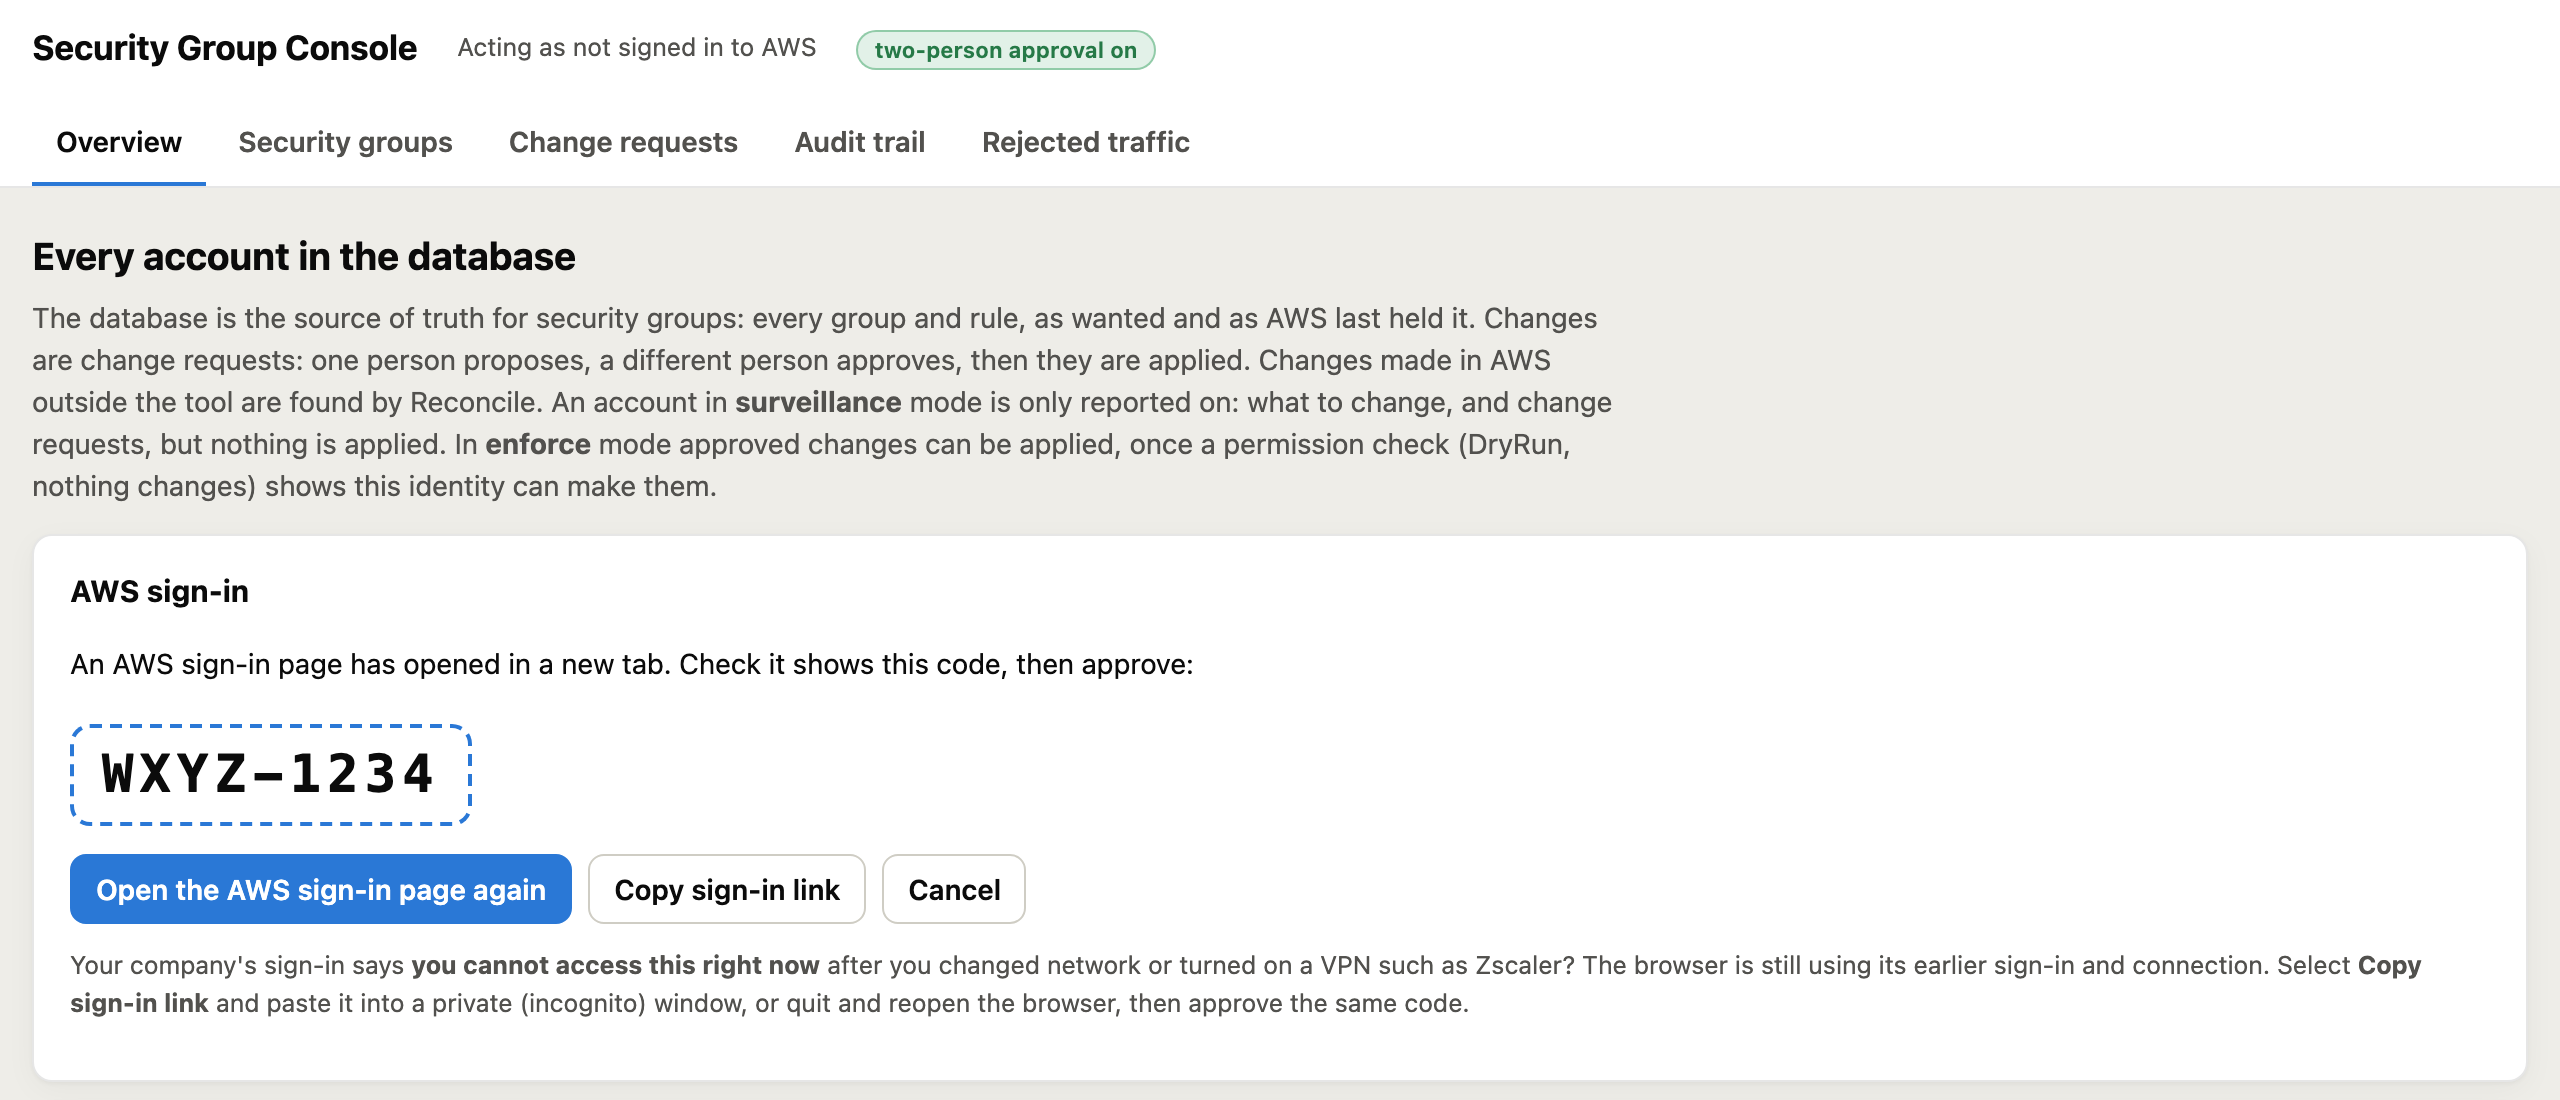
If your company sign-in page says “you cannot access this right now” after you changed network or turned on a VPN such as Zscaler, the browser is reusing its earlier sign-in: Copy sign-in link, paste it into a private window and approve the same code.
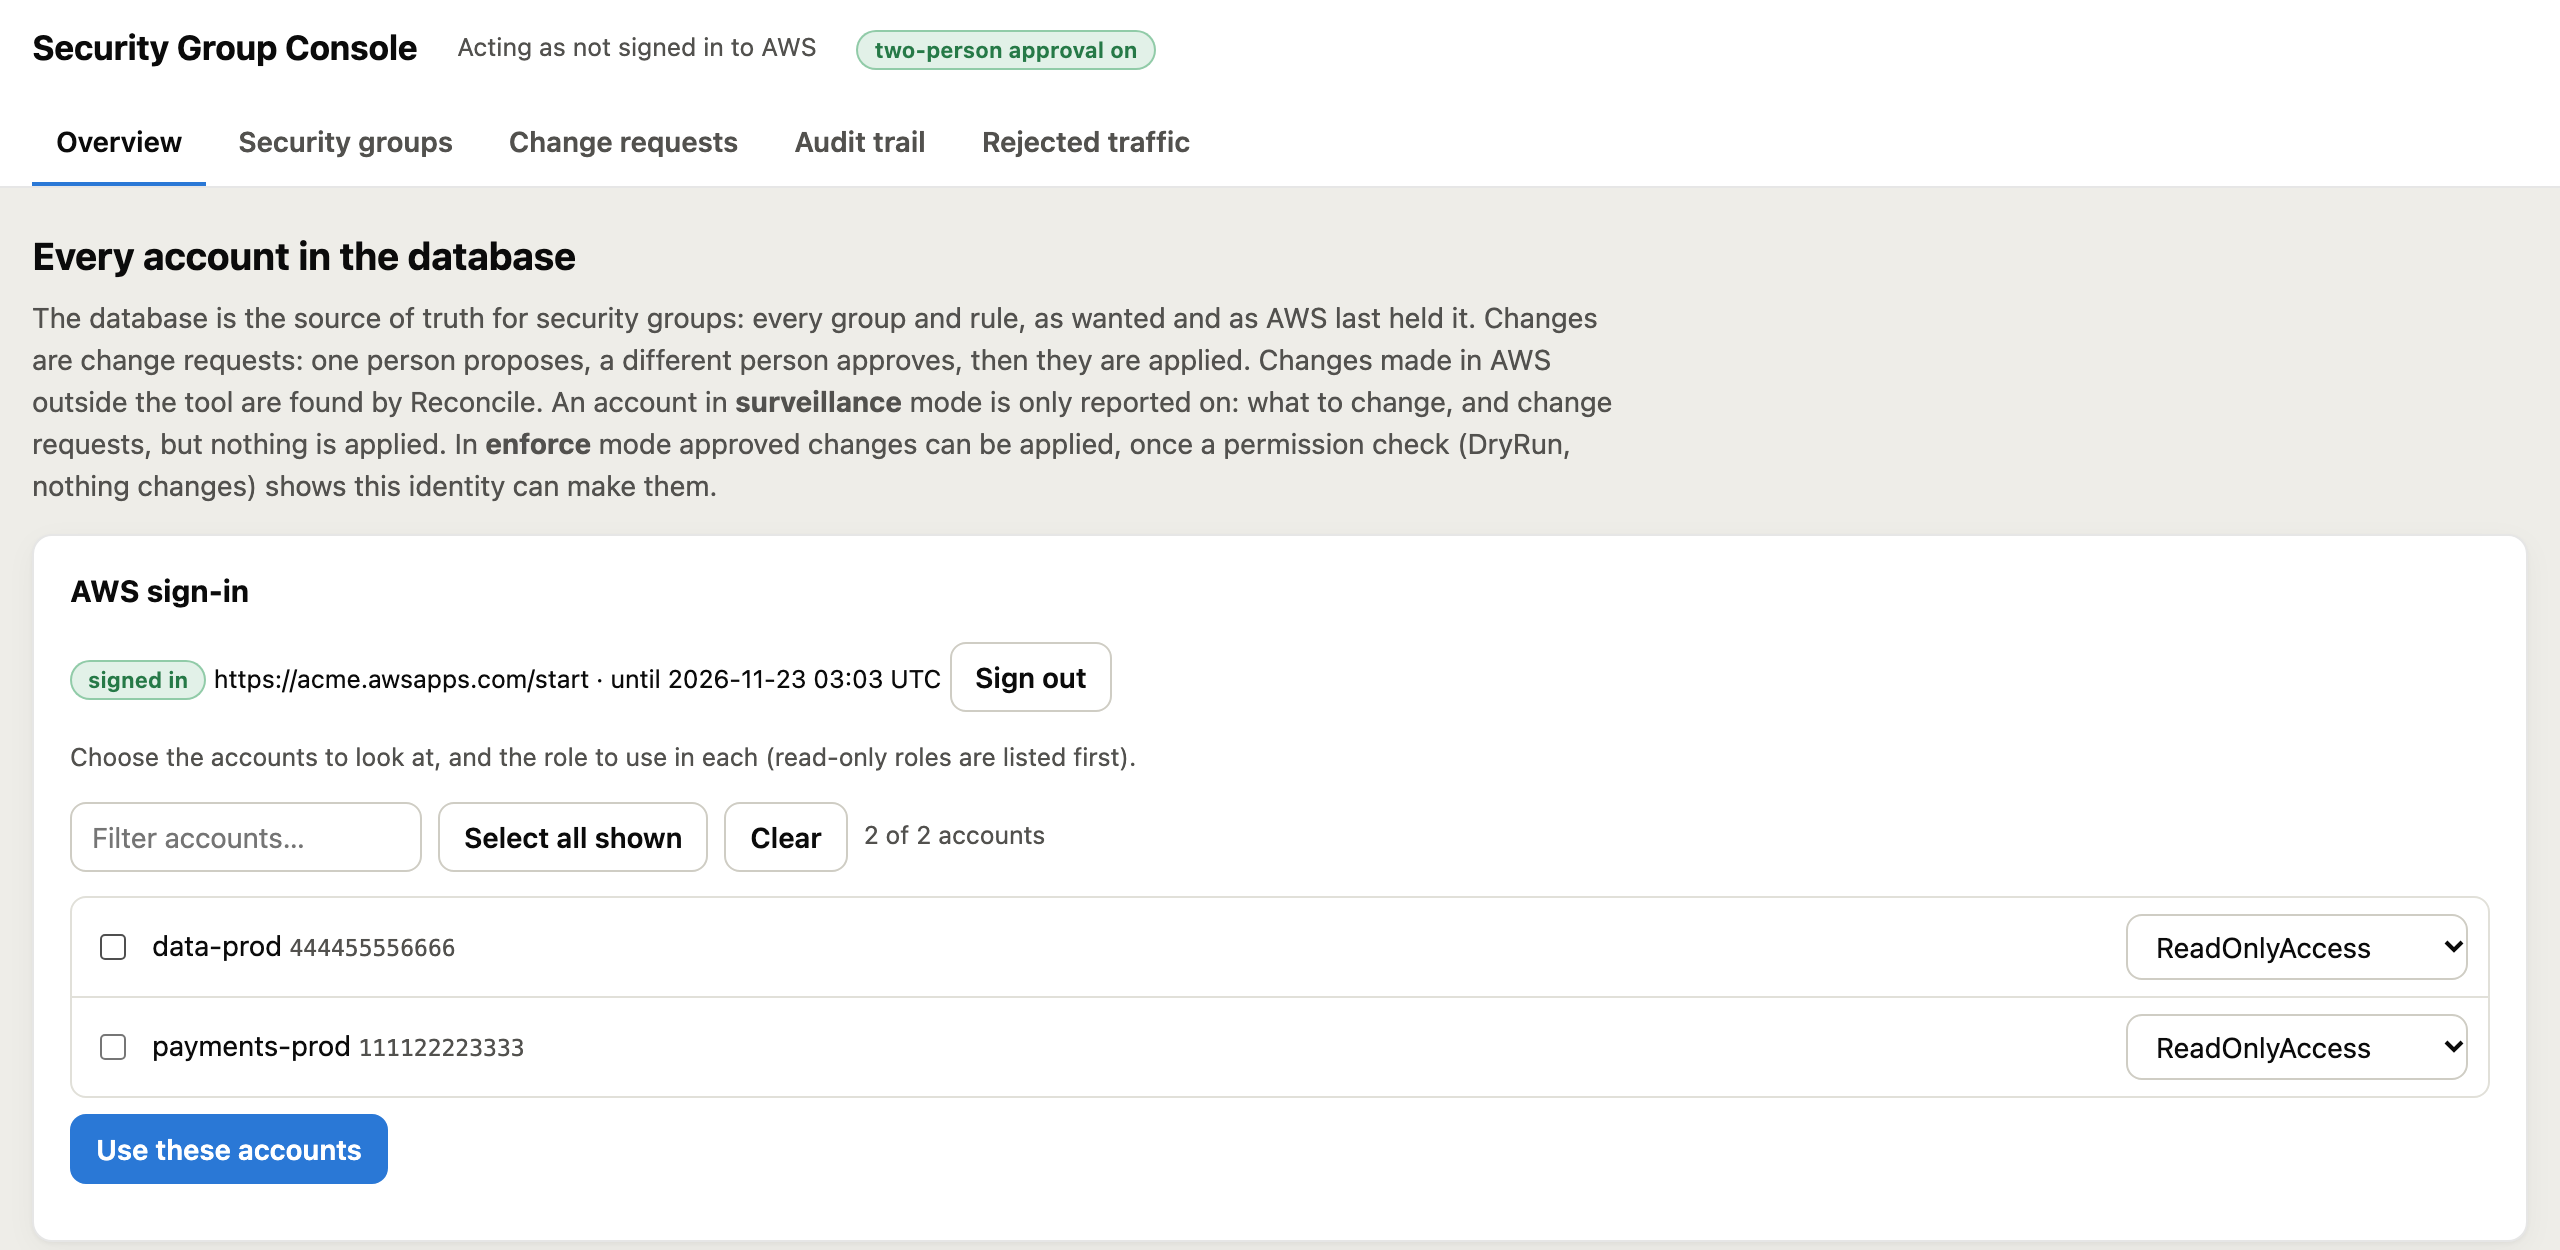
Choose your accounts. Every account your sign-in can use is listed with your roles there, read only roles first. Tick the accounts and pick a role in each.
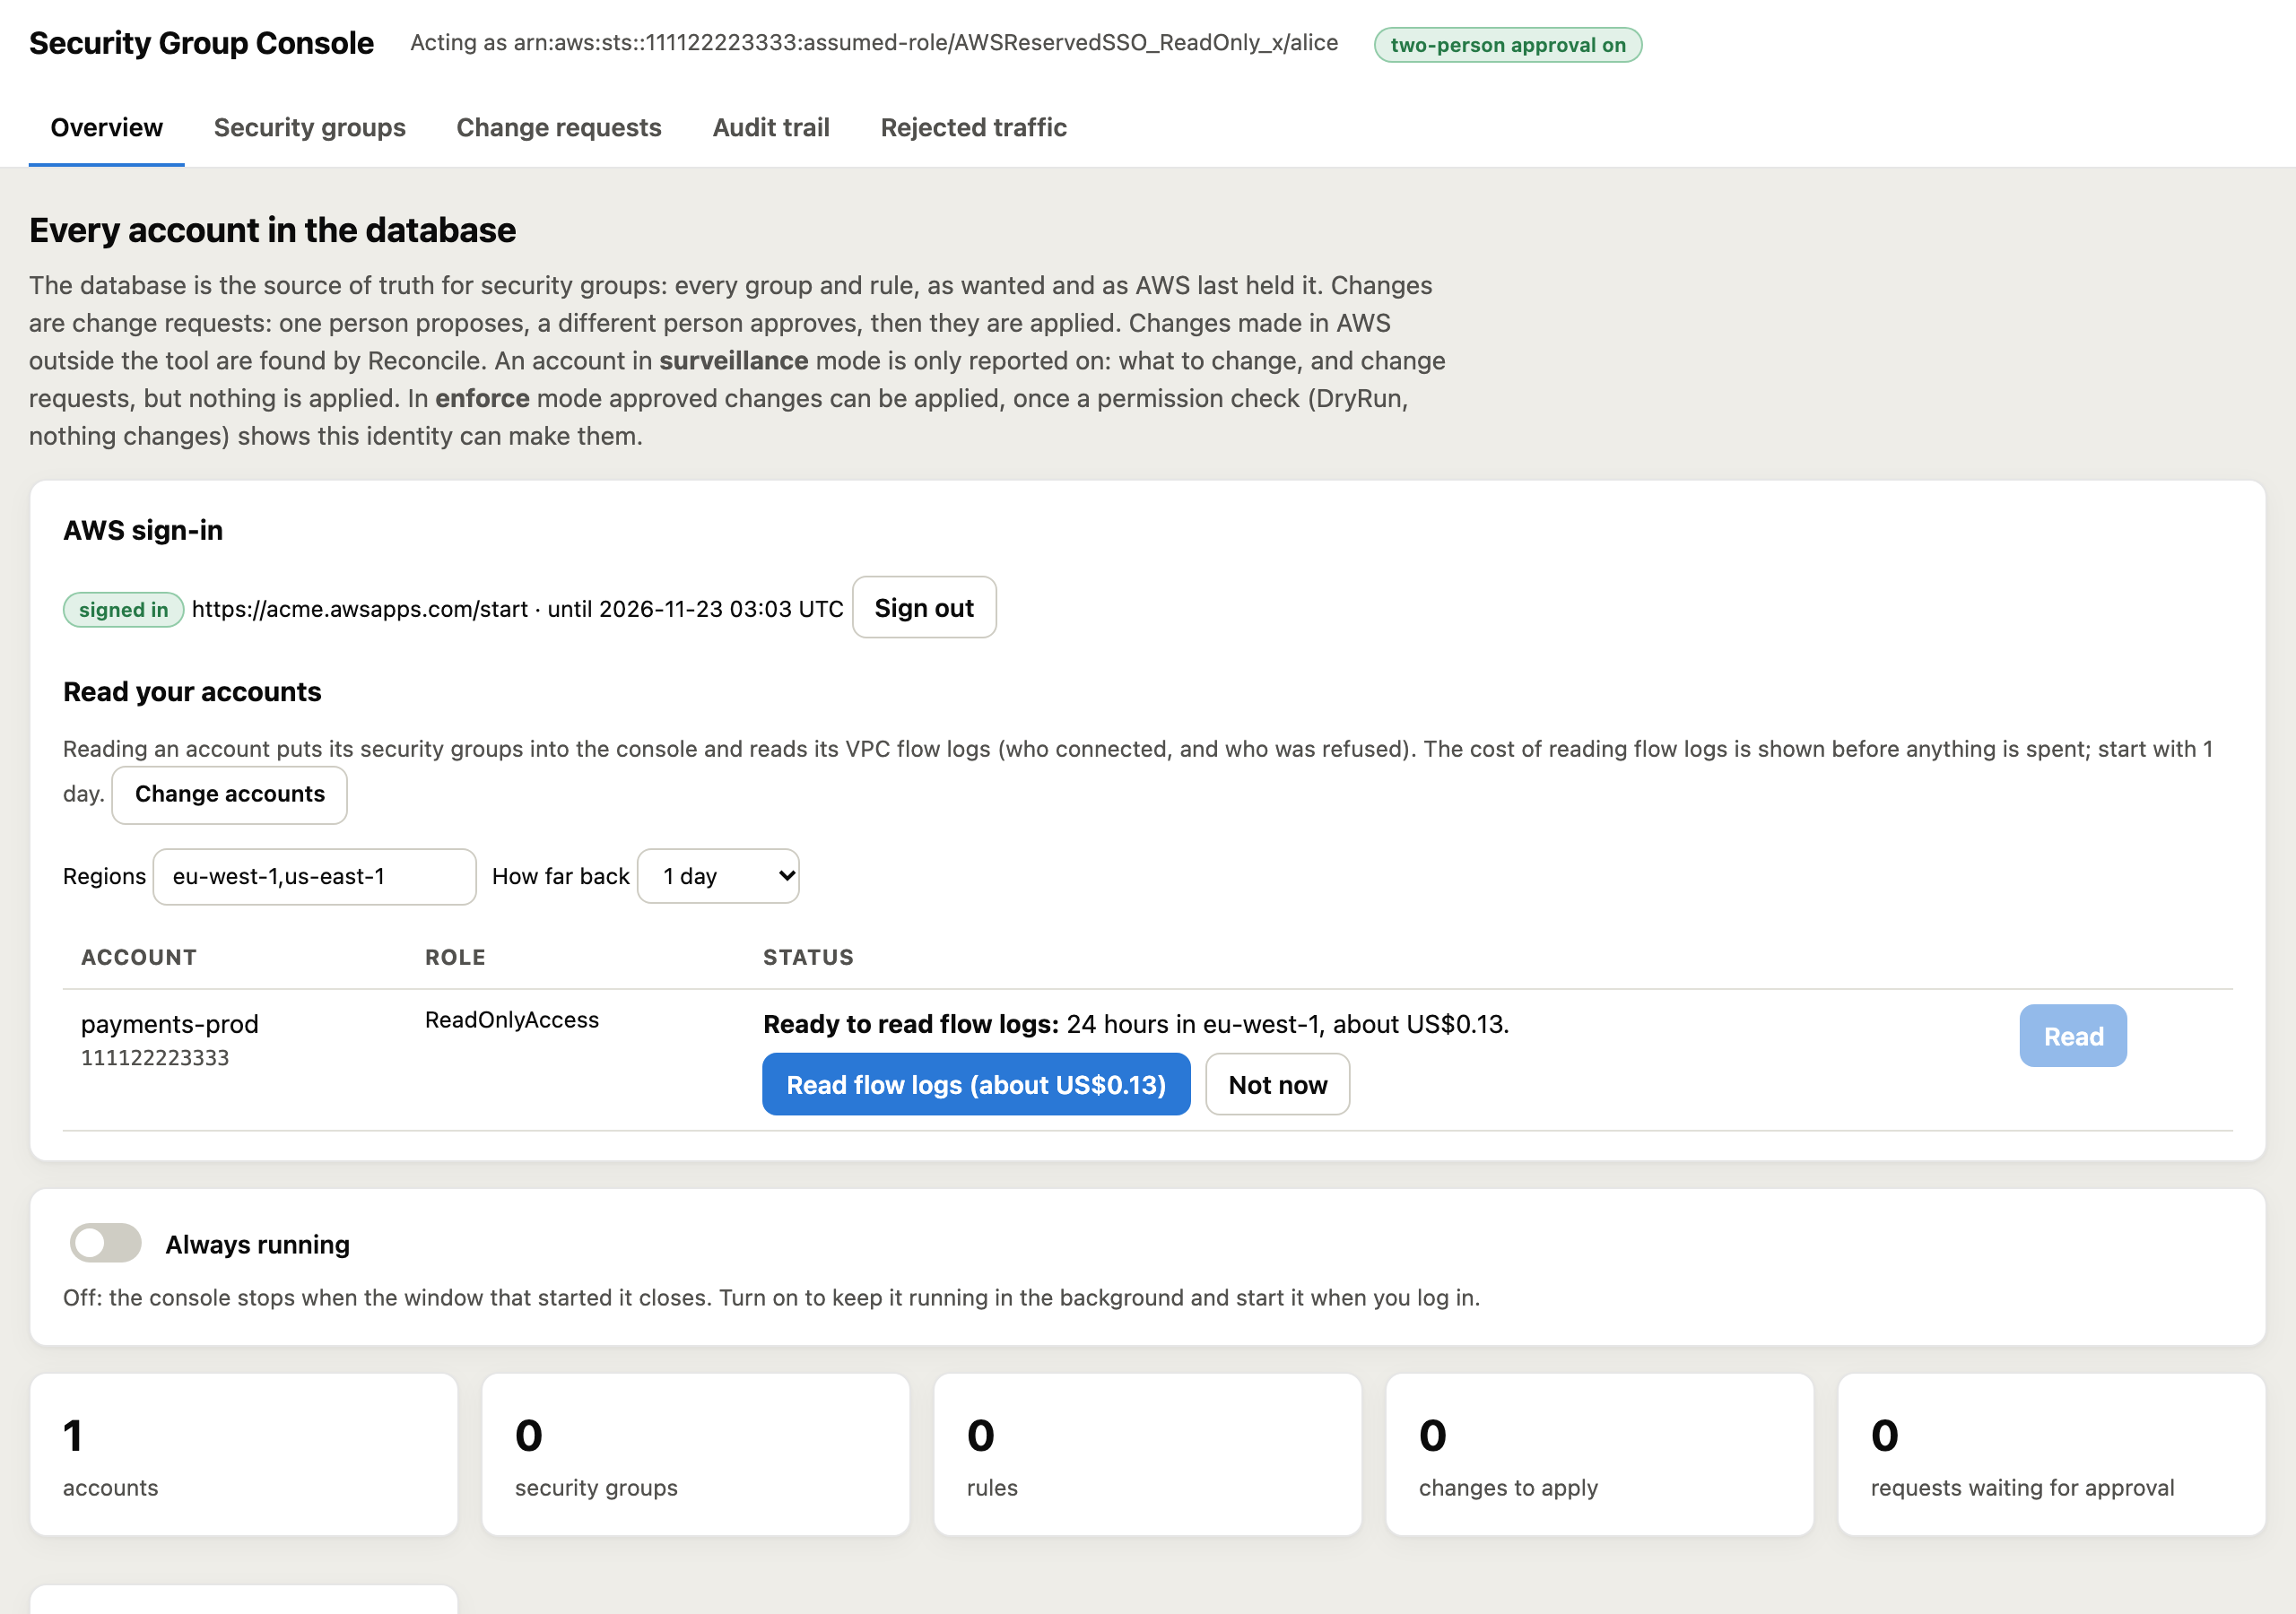
Read, with the cost shown first. The security groups go in at once, for free. The console then works out how much VPC flow log there is and shows what reading it will cost before anything is spent; a bar shows progress, and Stop stops it. Review and tighten then opens each account’s review.
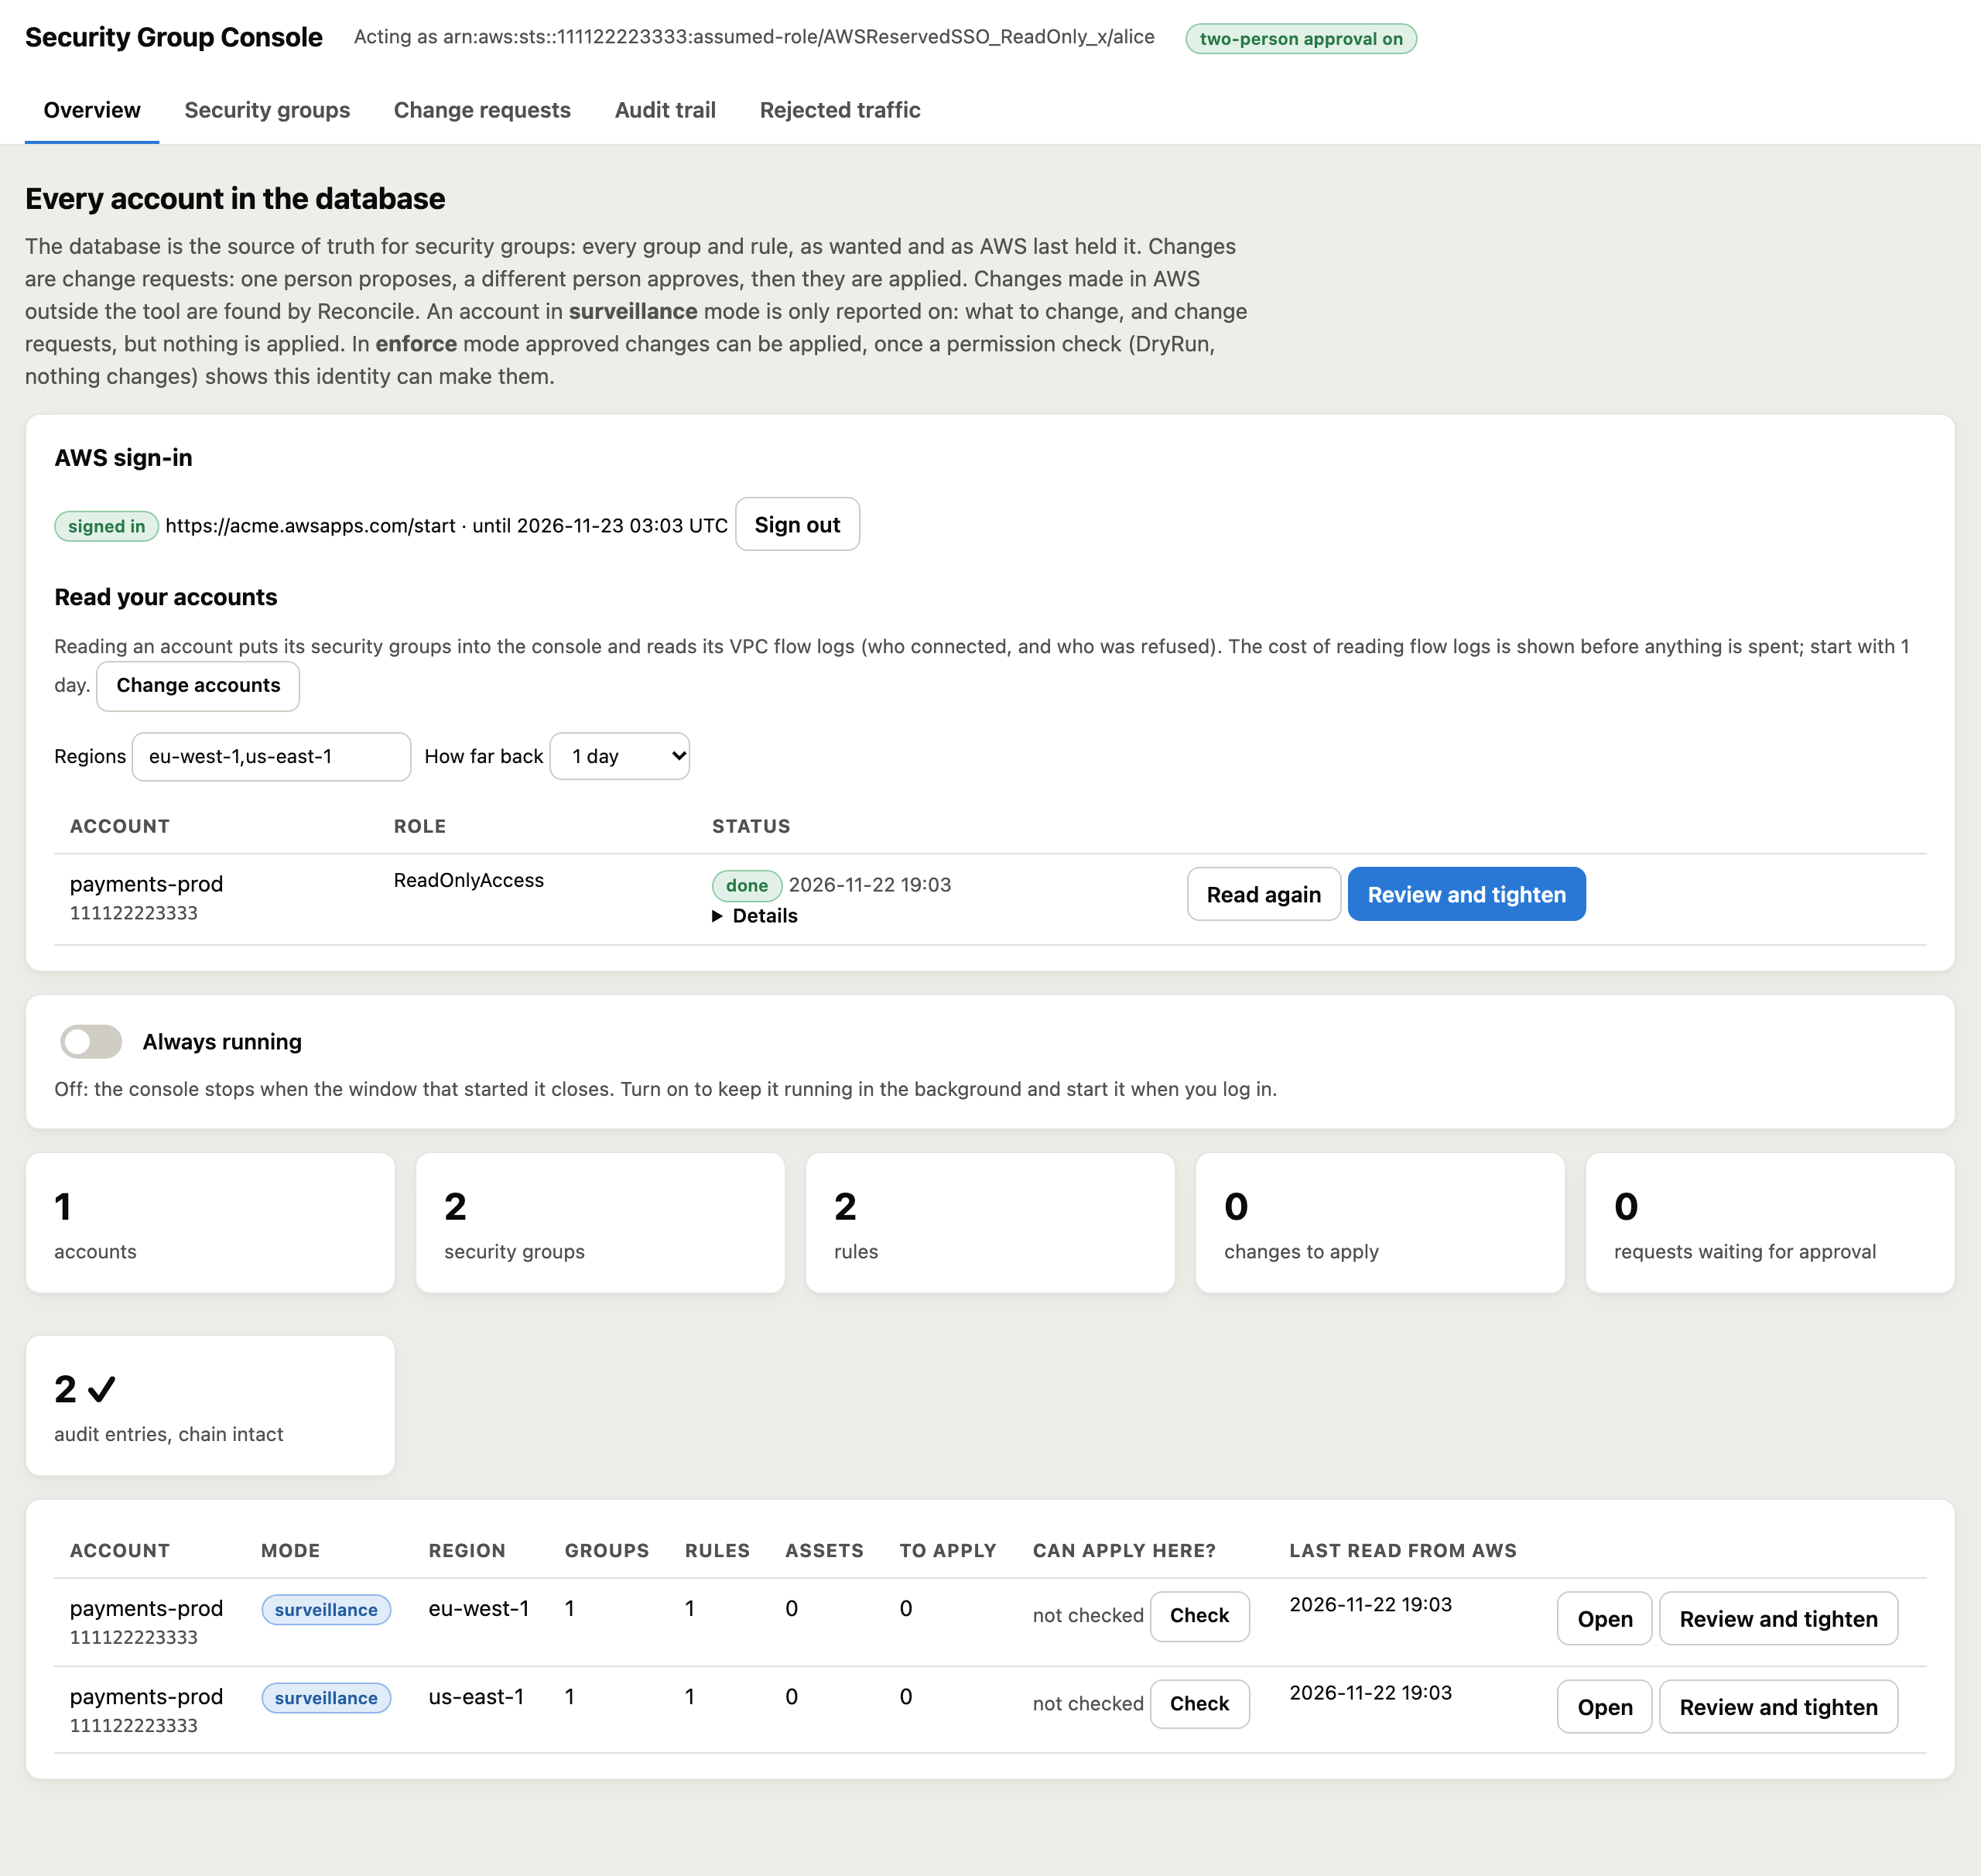
Signed in, the console shows every account’s mode, groups, rules, assets and whether this identity can apply there, and Review and tighten opens an account’s review with the Tighten panel wired straight into change requests. Nothing in AWS changes: every account starts in surveillance mode.
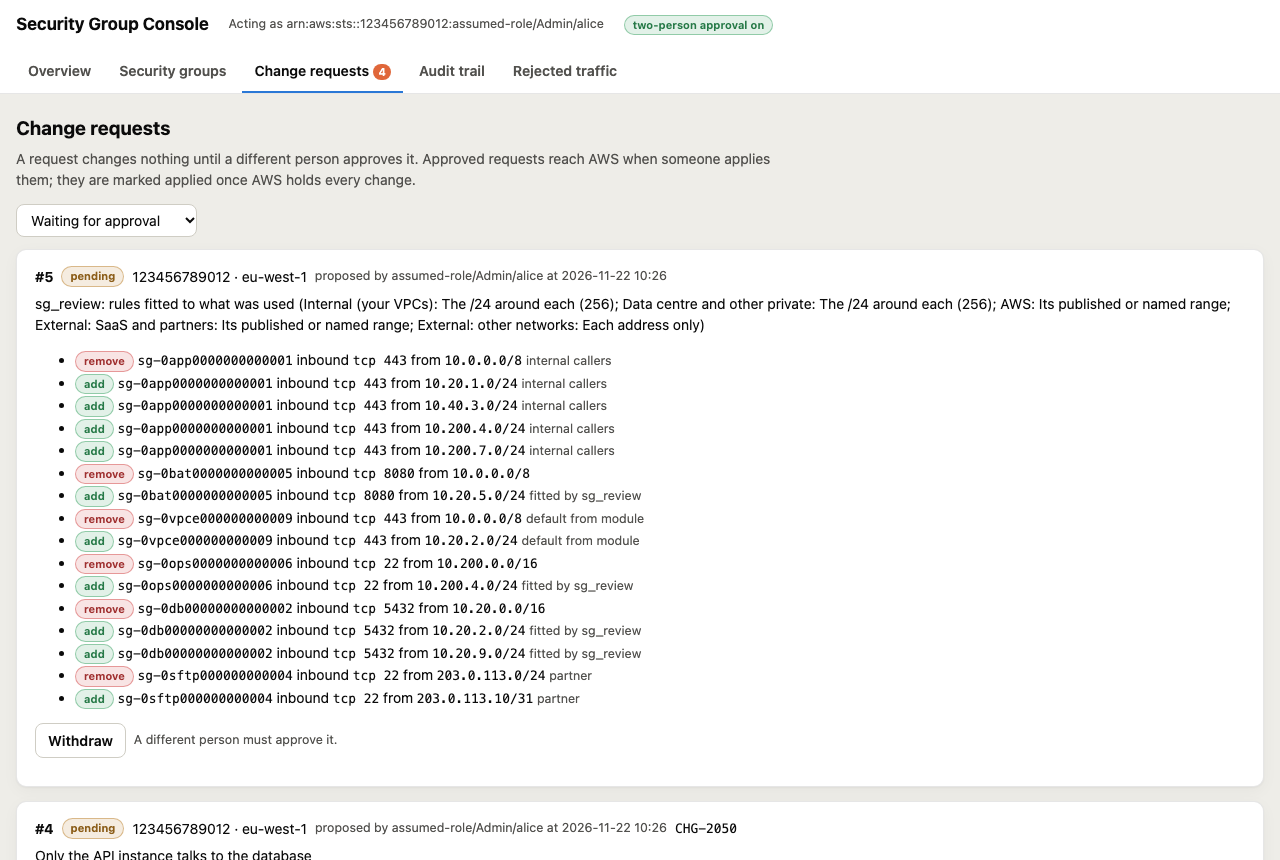
Every change is a request with a reason and a ticket, and a different person must approve it before it is applied. Proposal, approval and apply are each audited. Break glass (sg_extend) still goes straight through during an incident, flagged.
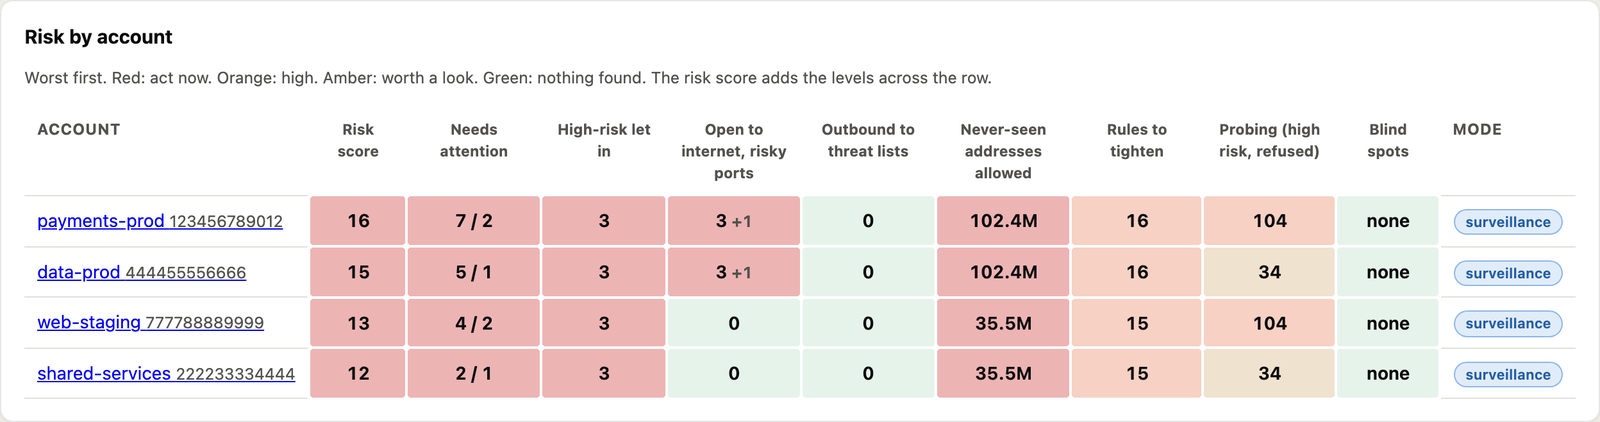
The risk across every account, on one page. The Risk overview tab puts every account read side by side for a chosen window. A heatmap scores each account on eight things: items needing attention, high risk sources a rule let in, rules open to the internet on risky ports, outbound calls to threat lists, never seen addresses allowed, rules to tighten, high risk probing and blind spots (gaps in the flow logs or evidence). Green is nothing found, red is act now, and the worst account is at the top.
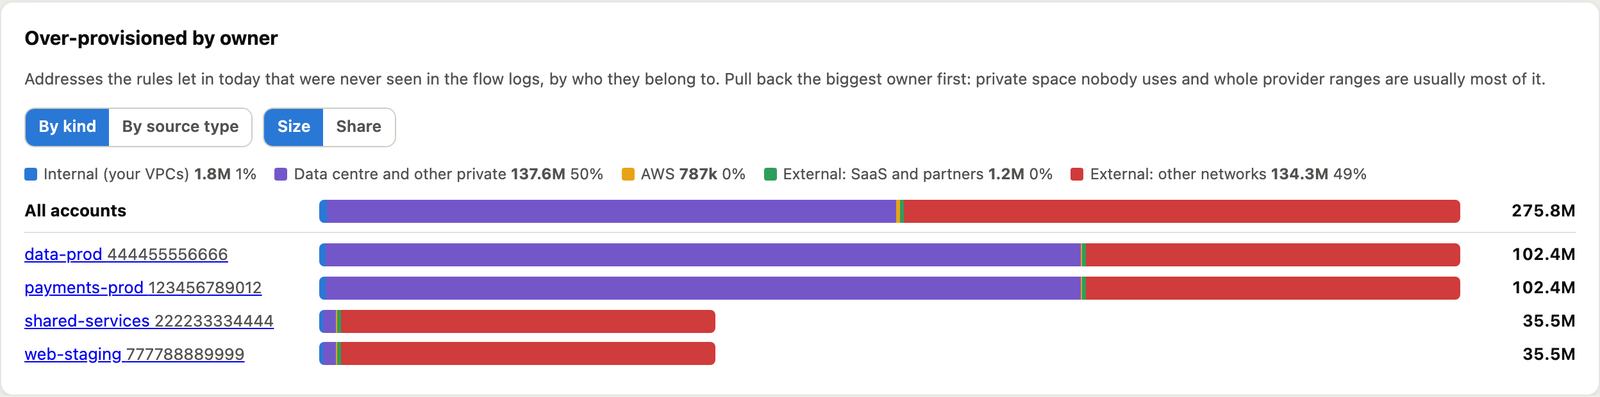
Over provisioned, by owner. The same tab splits the addresses the rules allow but nobody ever used by who owns them: your own VPCs, data centre and other private space, AWS, SaaS and partners, and the rest of the internet, for all accounts together and for each one, by size or as a share. It shows where to start: in most estates unused private space and whole provider ranges are most of it. Below that are over provisioning and high risk probing over time, internet exposure by port class, the biggest rules to tighten across every account, and the blind spots.
9. Rejected traffic: internal or external, IPv6, new, scanning
The operational question during the day is not “what is over provisioned” but “who is being turned away, and should I care?”. The console’s Rejected traffic tab shows every source the security groups and network ACLs refused, across every account read, worst verdict first.
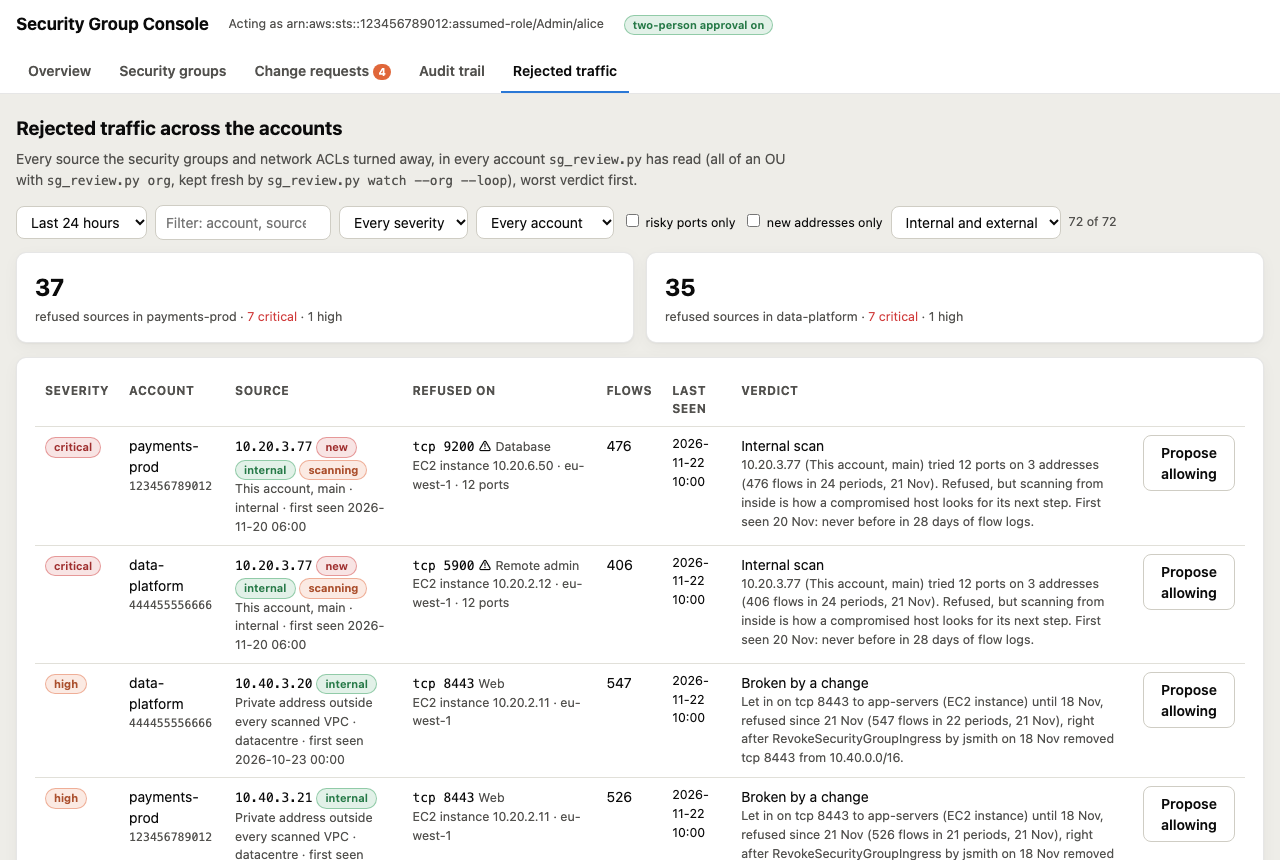
- Internal or external: your VPCs and internal ranges, AWS and which service, a SaaS provider, or the network by AS number. IPv6 sources are named and tightened too.
- Which port: every port is classed (remote admin, databases, web, containers and more), with risky classes marked.
- Is it scanning you? A source sweeping many ports or addresses is marked scanning, with the count.
- Known malicious? Every source, and every server’s outbound destination, is checked locally and daily against free threat lists: abuse.ch Feodo Tracker (botnet command servers), Spamhaus DROP (criminal or hijacked netblocks), Proofpoint Emerging Threats (compromised hosts) and blocklist.de (addresses attacking servers in the last 48 hours), as well as the Tor Project’s exit list. A known malicious address let in on admin or database ports, or a server calling one, is critical and always alerted, and Tighten turns such sources away by default.
- Seen before? Each address keeps its first sighting. New means first seen in the last 7 days, with at least 14 days of flow logs before that in which it never appeared.
Your own traffic being refused is usually a broken change. A new external address is usually a partner who moved, or someone looking for a way in. Scans the defences turned away stay out of the alerts.
10. Managing the risk: what to do first
The graphs tell you where the risk is. This is the order I would act in.
- Internet-reachable before open on paper. A
0.0.0.0/0rule on a group with no public interface is hygiene. The same rule on an interface with a public address, a route to an internet gateway and a network ACL that lets it in is exposure. The Exposure and hygiene box checks all three. Fix exposure first. - Read 90 days before removing anything. Monthly batch jobs, quarter end reports and DR tests are invisible in a week of flow logs. The Tighten panel’s recency setting shows what a shorter window would cut off.
- Tighten in risk order. Remote admin and database ports open to the internet first. Then wide internal ranges like
10.0.0.0/8onto databases and admin ports. Then everything else. Blast radius shows which hosts gain most from each change. - Know what flow logs cannot see. “Never seen” only means something if every VPC had flow logs for the whole window. Where they did not, keep the room or read longer.
- Watch the way out too. With
read --egress, connections out to Tor exits and scanners are flagged, and open outbound rules are fitted to the destinations actually used. - Clean up hygiene. Rules in the default group, trust in another account’s group, references to deleted groups and one group shared across tiers all widen reach without ever showing up as traffic.
- Record changes made outside the tool. Run
sg_db.py reconcilehourly from cron so a console edit appears on the timeline, not as an unexplained spike. - Report two numbers. Never seen addresses allowed (how much you could be attacked from) and time to restore when a tightening refused something it should not have (how safe it is to keep going). Both should trend down.
- Surveillance mode is evidence, not delay. Weeks of watching before enforcing is the record that each removed rule was unused, which is exactly what an auditor or change board will ask for.
- Source and documentation: github.com/andrewbakercloudscale/sg-tightener
- User guide: cloudscale.consulting/sg-tightener
Attackers now move in minutes. Most organisations cannot make their decision making move that fast, but they can make sure a compromised host reaches only what it was already talking to, and that every tightening is backed by evidence, approved by a second person, and visible on a timeline the moment it goes wrong.