AI Coding Costs Are Guesswork Without This: Instrumenting OpenCode And Claude Code

Your coding agent bill is driven by context resend costs, not model price. Focus on ending sessions after one task to avoid the N squared cost scaling, instrument usage before making changes, and disable automatic compaction which destroys cache savings. These steps can reduce costs by over half without changing models.
My inference bill last month was large enough to require an explanation, and my first instinct was the same one most people reach for: I had run one expensive model for everything, so the fix was to route the cheap work to a cheap model and keep the frontier model for the hard parts. That instinct turned out to be wrong, and the companion piece to this one, Cut AI Coding Agent Costs: Fix Context Before You Change Models, walks through why in detail. What it does not walk through is how I actually found that out, because I could not have. Model pricing is a fact you can look up. Whether your bill is a pricing problem is a question you can only answer by looking at your own sessions, and I could not do that from a session total either, since a total tells you what a session cost and says nothing about why.
That is the gap this piece is about closing. Two sessions can spend the same amount for completely different reasons, one because the work genuinely needed it, one because a single turn quietly pulled nine hundred thousand tokens of context into every subsequent turn for a week. From the total alone, they look identical, and so does the honest answer to “is this a model pricing problem,” right up until you can see turn by turn what is actually happening inside a session.
This piece is about getting that view: instrument Claude Code or OpenCode at the turn level, so you can see context growth, cache behaviour, subagent cost and the handful of sessions actually driving your bill, before you touch a single cost lever, and before you trust an instinct about what kind of problem you have. Read this one first; the companion piece is what to actually do once you can see it.
Note: The source code for the solution can be found here: https://github.com/andrewbakercloudscale/claude-code-cost-sidebar
1. The Session That Looked Healthy
Here is a real stretch of my own Claude Code usage, about a hundred sessions, with the dollar figures left out since the shape is what matters.
| Diagnostic | This article’s threshold | What actually showed up | Verdict |
|---|---|---|---|
| Cache hit rate | Under 50 percent is the concern | 98.5 percent | Fine, caching was never the problem |
| Input to output ratio | Over 20 to 1 is the concern | 440.8 to 1 | Miles past the line, this was the problem |
| Top 10 percent of sessions | Often a third to half of spend | 63.2 percent of spend | Worse than typical, heavily concentrated |
| Top 5 percent of sessions | No stated threshold | 45.6 percent of spend, five sessions | A textbook power law tail |
| Median session against the worst one | No stated threshold | Roughly an 80 times spread | The tail is doing almost all of the damage |
Read the first row on its own and the account looks healthy. Ninety eight and a half percent of input tokens hit the cache. By the single metric most people check first, nothing here should have been expensive.
The worst session in that stretch ran for close to six thousand turns over roughly a week, not one sitting. Context climbed from under 40,000 tokens on the first turn to somewhere north of 900,000 tokens by the end. It dipped once, around a third of the way through, almost certainly an automatic compaction, then climbed straight back to the same plateau and stayed there for the rest of the session. Cache hit rate stayed above 98 percent the entire time.
2. Why 98.5 Percent Cache Hit Was Misleading
A perfect cache hit rate tells you the rate was low. It tells you nothing about the volume, and the volume was the entire story in that session.
Caching makes carried context cheaper. It does not make it smaller. Roughly 900,000 tokens were being resent on nearly every one of those six thousand turns, and caching discounted each resend heavily against the standard input rate, but a heavy discount multiplied by six thousand turns is still a large number. This is the mechanism the companion piece argues from first principles, showing up here at a scale that makes it impossible to miss: caching stops you paying full price for a repeated token. Isolation would have stopped you carrying it at all. Those are different things, and the first one is not a substitute for the second.
The more interesting question is not the plateau, it is the reflation right after the dip. Something got pulled back into context immediately after that compaction and never left again, and the honest next step is not to shrug at the climb as one undifferentiated mass but to pull the turn by turn delta around that specific dip and look at exactly what re-entered. A single file or a single tool result re-read on a routine basis is a far more common cause than anything exotic, and it is usually visible within a few turns of looking.
Mapped to the levers covered in the companion piece on cost optimisation, three things would have stopped this outright, in the order they would have mattered:
- Session hygiene. A single session should not span a week and thousands of turns. Whatever task boundary existed on day two or three should have ended that session with a handoff instead of continuing.
- Isolation. Whatever kept getting re-read at that volume belongs in an explorer subagent, not the main thread. That change alone would have capped the damage regardless of how long the session went on.
- Enforcement. This is the clearest possible case for alarm thresholds. A fifteen thousand token delta alarm would have fired on the very first turn of that climb, thousands of turns before the session ended. A hard per session cost ceiling that refuses rather than warns would have forced a restart long before the number got anywhere near what it did.
None of that required guessing. Reading the actual per turn numbers found it in about the time it takes to read a table, which is the entire argument for instrumenting in the first place, and the reason the next three sections exist.
3. The Five Measurements That Exposed It
The table in section 1 was not luck. It came from five numbers that any per turn view will give you, in the order worth checking them:
- Cache hit rate. Well under 50 percent and the prompt caching lever in the companion piece is probably worth more to you than everything here combined. Well above it, as in this case, and caching is not where your problem lives.
- Input to output ratio. Well above twenty to one and your problem is likely context volume rather than generation. In this dataset it was 440.8 to 1, decisively past the line.
- Tokens per session, and the distribution. In my dataset this was a clean power law; check whether yours is too, since the tail is where the fix pays off if it is.
- Your ten most expensive sessions, read rather than summarised. In my dataset the top ten percent accounted for 63.2 percent of spend, well above what I expected; read the actual transcripts rather than trusting a total.
- Reasoning tokens as a share of output. These are generally billed as output, and output usually costs several times more than input, so check your rate card rather than assume a fixed ratio.
Reading that table in order is exactly how the diagnostics are meant to be used. Diagnostic one says caching is not the issue, so do not go looking there. Diagnostic two says the issue is volume, decisively. Diagnostics three and four say the volume is not spread evenly, it is concentrated in a handful of sessions, so read the worst one rather than trusting its summary. That sequence, not any one number alone, is what finds the actual cause rather than a plausible looking one.
The view you need to compute these looks like this, a per turn breakdown with deltas rather than a session total:
Turn  Model    Input   Δ Context   Cache   Cost
12    Sonnet    42k       +2k        91%    $0.18
13    Sonnet    91k      +49k        88%    $0.39
14    Sonnet    93k       +2k        89%    $0.40
Turn 13 is the decision you investigate. The delta column is the point: absolute numbers tell you the session is big, deltas tell you which turn made it big. Sections 4 and 5 cover how to get exactly that view out of each tool, one you can skip whichever does not match your setup.
4. How To Instrument Claude Code
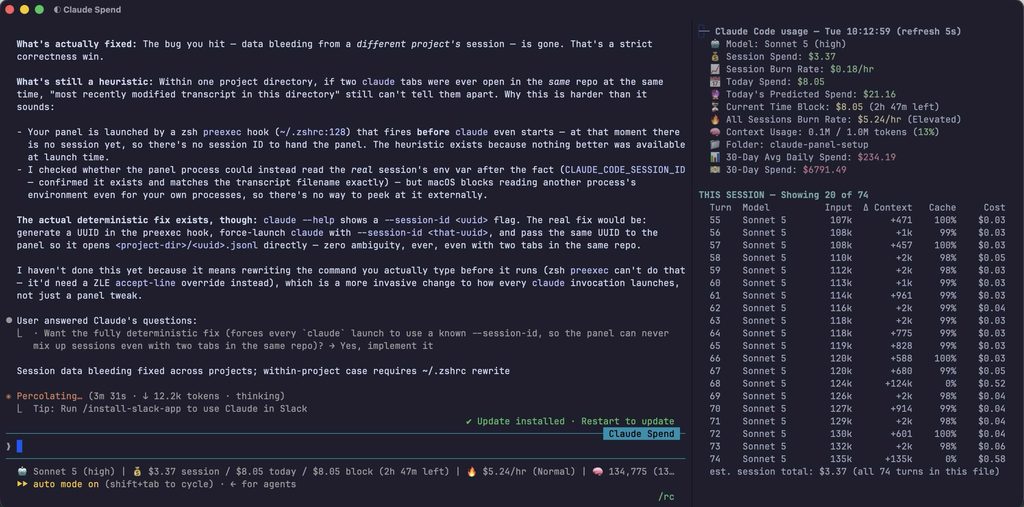
If you are driving this through Claude Code rather than OpenCode, the equivalent is ccusage, which reads Claude Code’s local session logs directly rather than anything you have to enable. The version below is an installer rather than a single script: it writes two files under ~/.local/bin, a live panel and a launcher, adds a small hook to ~/.zshrc so the panel appears on its own the first time you type a claude command in a new terminal window, and, if you already launch Claude Code through a Finder Service or Automator workflow rather than a shell, patches that script too, since a workflow like that execs claude directly with no interactive shell involved, and the .zshrc hook never fires for it. On macOS with Ghostty the split opens automatically either way; anywhere else, or in any other terminal, the panel itself still runs fine, you just start it by hand with the path it prints at the end.
The launcher also stopped failing silently, which is worth calling out on its own merits. Earlier versions either opened the split or did nothing, with no way to tell which from the terminal. This one logs the reason to ~/.cache/claude-panel-launch.log every time, and it polls for up to two seconds for Ghostty to register as the frontmost window before giving up, because a brand new window does not always report itself as frontmost the instant it opens, and checking once and quitting was quietly losing the race on exactly the windows this is meant to help with. Same principle as the enforcement alarms covered in the companion piece on cost optimisation: a failure you can see is a different thing from a failure that just does not happen. There is a second, subtler version of the same lesson in the latest revision. The split now resizes itself to roughly a third of the window rather than staying at a default fifty fifty, which needed reading the window’s width and doing the keystrokes in a single AppleScript call rather than two separate ones. Splitting it into a measurement call and an action call looked harmless and was not: the frontmost window could change in the gap between them, and when it did, both calls still exited cleanly with nothing in stderr, so the log said ok while nothing had actually happened. That is a worse failure than an honest error, because it looks identical to success. The fix was mechanical once found, do the check and the action in one call so there is no gap to lose the race in, but the failure mode itself is worth remembering next time something automated reports success and you are not sure you believe it.
There is a third version of that same lesson, and it is the most important one: even a single call reporting success is still just a report. The current script no longer trusts the AppleScript’s own return value at all. It snapshots which panel processes exist before the attempt, does the split, waits a second, then snapshots again and checks for an actual new process. Only that counts as success. If nothing new appears, it retries, up to three times, with a permission probe run once up front so a genuinely missing Accessibility grant produces one clear message instead of three confusing failures that all look the same. Every attempt writes to the log under a shared run id, so several terminal windows opening in quick succession do not interleave into an unreadable mess. This is the general shape worth keeping: a system that reports its own success is describing its intention, not confirming an outcome, and the two are only the same thing if you go and check.
Two smaller changes and one genuinely different one round out the current version. The panel now has a purple tier above red, past three times the seven day average rather than two, since a session that is merely twice as expensive as usual and one that is five times as expensive were getting the same colour before. And the per turn table is now guaranteed to print in full regardless of how short your terminal pane is; earlier versions piped the whole panel through a uniform height limit, so on a short split the one section that actually matters could get cut off along with everything else. The table now renders completely first, and only the less essential sections below it, active block, today, the trend, compete for whatever height is left over.
The genuinely different addition is a UserPromptSubmit hook, claude-cost-alert-check.sh, wired into ~/.claude/settings.json. Everything above this point assumes you are looking at a terminal, which is exactly the thing that is not true if you are driving a session over Remote Control from a phone. A hook fires regardless of interface, and its systemMessage shows up inside the chat transcript itself rather than as a local desktop notification, so it is the one part of this whole setup that actually follows you off the laptop. It checks the same red and purple thresholds as the panel, using the same shared multiples so the colours mean the same thing in both places, and separately checks whether the panel launcher’s last attempt for this window failed. It only speaks when something crosses a threshold for the first time or a launch failure is a new one, tracked in a small state file per session, so it will not repeat itself on every prompt once it has already told you.
One correction to the thresholds themselves, and it is the kind of bug that only shows up once you actually use the thing for a while: a multiple of the average is not sufficient on its own. A session that normally costs five cents a turn throwing up a thirteen cent turn is technically more than twice the average, and technically correct, and also not something anyone would ever look at twice. Both scripts now carry an absolute floor alongside the multiple, fifty cents per turn and five dollars per session, below which nothing gets coloured or alerted on regardless of how many multiples of the average it happens to be. The multiple still decides severity once you clear the floor; the floor decides whether the multiple was ever worth asking about. I applied the same floor to the OpenCode panel’s own per turn colouring, including the purple tier it did not have before, so the two tools agree on what red and purple mean rather than one of them using a rule the other does not.
The status line’s own wrapping needed a second pass too. Splitting on every pipe character got the three top level fields onto their own lines, but the cost field itself, session against today against the active block, was still one long string and could still wrap mid word on a narrow pane. The obvious fix is splitting that field again on its internal slashes, and the obvious fix is wrong: the trailing burn rate reads as something like two dollars ten cents per hour, which has its own slash that has nothing to do with the three fields you actually want separated. Splitting on a bare slash cuts the burn rate in half along with everything else. The fix is to split on a slash with a space on either side, which is how the three real fields are separated and never how the burn rate is written, so the rate survives intact while the three fields still land on their own lines. I did not have this exact string to test against, so I built one matching the shape described in the script’s own comment and ran the logic against it directly before trusting it.
One thing worth knowing about before you rely on it: Claude Code has had a documented bug, filed as anthropics/claude-code#17550, where a UserPromptSubmit hook returning hookSpecificOutput JSON shows a generic hook error on the first message of a brand new session specifically, and works normally on every message after that. If you see that on your very first prompt and the alert itself looks otherwise fine, that is almost certainly what happened rather than a broken install. The documented workaround is plain text on stdout instead of JSON, which the same hook event still turns into context Claude can see, just without the same visible banner. Check whether your installed version still does this before deciding it is worth switching.
What it actually shows, beyond the totals from before: a live per turn breakdown of the session you are currently in, turn number, model, input size, the context delta, cache percentage and estimated cost per turn, which is the exact table format from section 3 made real rather than illustrative. It also keeps a seven day rolling average session cost as a baseline, and colours a row yellow past one and a half times that average and red past two times it, so the session from section 1 would have shown red well before turn one hundred rather than only becoming visible at the very end. It is safe to re-run: it overwrites the two scripts with whatever version you paste in and skips the .zshrc block if it is already there.
The per turn cost estimate prices each model itself, since ccusage does not expose per message cost and this reads the raw transcript. Sonnet 5’s launch rate of two dollars per million input and ten per million output was originally introductory through the end of August 2026, with a scheduled increase to three and fifteen; Anthropic cancelled that increase on 10 August 2026 and made the launch rate permanent, so the rate table below reflects that and needs no date based update. Rate cards still move, just not on the schedule this one was originally written against, so check the current table if you are reading this well after publication.
cat /dev/null 2>&1; then
echo "ccusage: $(command -v ccusage)"
elif command -v npm >/dev/null 2>&1; then
echo "ccusage not found, installing it (npm install -g ccusage) ..."
if ! npm install -g ccusage; then
echo "ERROR: 'npm install -g ccusage' failed; install it yourself and re-run." >&2
exit 1
fi
hash -r
if ! command -v ccusage >/dev/null 2>&1; then
echo "ERROR: ccusage installed, but npm's global bin ($(npm prefix -g 2>/dev/null)/bin) is not on PATH." >&2
exit 1
fi
echo "ccusage: installed at $(command -v ccusage)"
else
echo "ERROR: ccusage is required and npm is not available to install it." >&2
echo " Install Node.js (brew install node), then re-run this setup." >&2
exit 1
fi
echo "Installing ccusage-panel.sh ..."
# Written to a temp name and renamed into place, never redirected straight
# onto the live path. Two reasons, both now that the panel watches this file:
# a plain `cat >` truncates first, so any running panel can stat a changed
# mtime and read a half-written script; and rename(2) within one directory is
# atomic, so every panel sees either the old file or the new one.
cat > "$BIN_DIR/.ccusage-panel.sh.new" <<'PANEL_EOF'
#!/usr/bin/env bash
# Live Claude Code usage panel, everything ccusage knows: context %, live
# block burn rate + projection, today's breakdown, 3-day trend, week/month
# totals, top sessions today, PLUS a per-turn breakdown of the current
# session (turn/model/context size/context growth/cache hit %/est. cost).
# Run this in a Ghostty split (super+d) to keep it visible while you work.
# Auto-launched by the ccusage split-panel autolaunch hook in ~/.zshrc, see
# ~/.local/bin/claude-panel-launch.sh.
set -uo pipefail
export LC_ALL=C LC_NUMERIC=C
# ---- two refresh tiers ----
# $REFRESH is the FAST tick: the "This Session" per-turn table only. That
# table is the one thing that has to track the conversation as it happens,
# and it is also the cheapest thing here, it reads one transcript file and
# is cached on that file's own mtime+size (turn_table_cached), so an idle
# pane re-renders it for free and a pane mid-turn pays exactly one parse per
# turn that lands.
#
# $SLOW_REFRESH is everything else: the summary block, Recent, and Top
# Sessions Today. Each of those is built from `ccusage` reports, and EVERY
# ccusage invocation reparses the whole (hundreds-of-MB) transcript corpus,
# ~3 CPU-seconds a scan. At the old single 10s tier that was ~4 full corpus
# scans every 10 seconds on a pane being actively typed into, because the
# corpus-change gate below (correctly) sees the corpus changing on every
# turn and refetches. That is the CPU heat; none of those figures, a 7/30
# day baseline, today's total, a 5h block average, the day's session
# ranking, moves meaningfully inside two minutes.
#
# Both rates are printed on the section headers they govern, so what the
# panel claims about itself stays true. (The label lying about the rate is
# a bug this panel has had before: it used to say "refresh 5s" while the
# numbers only moved every 10, since they shared one 10s cache.)
REFRESH="${1:-10}"
TURN_ROWS="${2:-12}"
SLOW_REFRESH="${SLOW_REFRESH:-120}"
# "10s", "2m", "1m30s", used to label each section with its own rate.
fmt_interval() {
local s="${1:-0}"
if (( s > "$PIN_LOG" 2>/dev/null; }
# ---- the handoff file: how this panel learns its session id now ----
# One file per project directory, holding "\t".
# Two writers, both out-of-band, neither passes through a keyboard:
# * claude-panel-session-hook.sh, wired as a Claude Code SessionStart hook,
# writes the session id Claude Code ACTUALLY chose. Fires on every launch
# path there is, including `--resume`/`--continue`, a GUI window and an
# IDE-embedded terminal, none of which the ~/.zshrc preexec hook can pin.
# * claude-panel-launch.sh writes the id it is about to launch `claude`
# with, so the pin still works when ~/.claude/settings.json has no hooks.
#
# The id used to ride in on argv, which meant the launcher TYPED it, as
# synthetic keystrokes, into a brand-new pane. A keystroke dropped or
# interleaved with the user's own typing silently rewrote it: an observed
# pane ran with
# 9e435181h-888e-4f0c-811-3befb80226t3d
# against a real session id of
# 9e435181-888e-4f0c-81f1-3befb802263d
# An 'h' and a 't' were woven in from the real keyboard, an 'f' lost. That
# names a transcript that will never exist. The pane showed "Model: Unknown"
# and "no active session found" for five hours, with every other figure on
# screen correct, because nothing downstream could recover: the unpinned
# fallback only accepts a transcript BORN AFTER the panel started, and that
# session's transcript was already 50 minutes old when the panel restarted.
# A file the launcher writes and the panel reads cannot be corrupted that
# way, and, because it persists, a panel restarted mid-conversation reads
# the same answer it would have had at launch.
PIN_HANDOFF_DIR="${PANEL_PIN_DIR:-$HOME/.cache/claude-panel-pin}"
PIN_HANDOFF_FILE="$PIN_HANDOFF_DIR/$(printf '%s' "$PWD" | tr '/' '-')"
# ---- the pane-scoped pin: one file per CLAUDE PANE, not per directory ----
# The file above is keyed on the project directory, and that key is wrong
# whenever the same repo has more than one Claude Code session open, which
# is the normal way this machine is used. Every new launch in a directory
# overwrites the one pin all of that directory's panels read, so all of them
# follow the newest session. Two observed consequences, both from the same
# key:
# * 2026-09-08 21:55, a panel whose pane was running fcdc479e adopted
# 5f46b180 the moment a second session opened in the same repo, and spent
# the night showing another pane's turns and cost as its own. Silent, and
# exactly the "confidently wrong" outcome resolve_session refuses to risk
# with its own guessing.
# * 2026-09-09 09:03, a third window opened in that repo and was never
# typed into, so Claude Code wrote no transcript for it. All three panels
# adopted its id and showed "no active session found" against a session
# that was live in front of them. A handoff pin is not timed out (see
# adopt_handoff_pin), so that state was permanent.
# Keying on the pane fixes both, because a pane hosts exactly one session at
# a time. The pane's identity is its controlling terminal: this panel is in
# its own split (ttys004) and its claude is in another (ttys003), so the
# launcher, which runs in the claude pane's own shell, and later learns this
# panel's pid, is the one process that sees both and writes the pairing.
# pane/ = "\t\t" (launcher)
# tty/ = "\t" (hook, launcher)
PIN_PANE_DIR="$PIN_HANDOFF_DIR/pane"
PIN_TTY_DIR="$PIN_HANDOFF_DIR/tty"
# `ps -o tty=`, not `tty`: this panel's stdin is not reliably the terminal,
# but its CONTROLLING terminal is the pane either way. "??" is what a process
# without one prints, and is not a key.
# Overridable so the test suite can name a pane without owning a terminal --
# a checkout running under CI has no tty at all, and a check that silently
# stops exercising this path is the failure mode this repo's build gates
# exist to catch.
PANEL_TTY="${PANEL_PANE_TTY:-$(ps -o tty= -p $$ 2>/dev/null | tr -d '[:space:]')}"
case "$PANEL_TTY" in ''|'??') PANEL_TTY="" ;; esac
PIN_PANE_FILE=""
[ -n "$PANEL_TTY" ] && PIN_PANE_FILE="$PIN_PANE_DIR/$PANEL_TTY"
# Learned lazily by learn_pane_pairing(), from the launcher's pairing file if
# there is one and otherwise from this panel's own window (see
# window_claude_pane).
#
# "Otherwise" used to mean "never", and that is how the 2026-09-15 blank
# panels happened: the launcher can only write the pairing after it has
# spotted the panel in a `pgrep`, and when that misses -- which it does, and
# silently -- the panel spends its whole life on the directory-keyed pin,
# which names a REPO and follows whichever session in that repo typed last.
# Two of the three panels open in this repo that morning had no pairing file
# at all.
PANE_CLAUDE_TTY=""
PIN_PANE_PIN_FILE=""
# The session id off that claude's own command line, where the window walk
# found one. Used ONLY when the pane is known and its tty pin is not there
# yet -- a panel whose SessionStart hook has not run, or is not installed,
# would otherwise be paired and permanently blind. Not authoritative: argv is
# fixed at exec, so /clear and --resume hand the same process a new session id
# while the command line keeps the old one. The tty pin, which the hook
# rewrites on every one of those, always wins.
PANE_CLAUDE_SID=""
# A handoff written within this many seconds of the panel starting was
# written FOR this launch, and is adopted unconditionally. An older one is
# adopted only on positive evidence that the session it names is still live
# (see adopt_handoff_pin), a panel restarted mid-conversation is the case
# that needs it.
PIN_HANDOFF_FRESH_SECS="${PANEL_PIN_FRESH:-180}"
# How recently the transcript a STALE handoff names must have been written
# for the panel to believe that session is the one in this pane.
PIN_HANDOFF_LIVE_SECS="${PANEL_PIN_LIVE:-1800}"
# ...and how long an ALREADY ADOPTED pin may go without its transcript being
# written to before the panel stops believing it. Same figure, deliberately:
# the adoption test and the retention test are the same question asked at two
# different moments, and a pin that would not be adopted now has no business
# still being held.
#
# Nothing used to ask the second question. A pin was tested for liveness once,
# at adoption, and then kept for the life of the pane whatever happened to the
# session it named, so a pin adopted from a session that ran for ninety
# seconds and stopped was still being reported as this pane's forty minutes
# later, model line, cost, burn rate, context percentage and turn table
# included. Releasing it is not a guess about which session is right; it is
# the panel declining to keep asserting one that is demonstrably over.
PIN_DEAD_SECS="${PANEL_PIN_DEAD:-$PIN_HANDOFF_LIVE_SECS}"
# The id of the pin released that way, so adopt_handoff_pin does not simply
# read it back out of the same unchanged file on the next tick and flap.
# Cleared when anything else is adopted; a released session that starts
# writing again is admitted through the ordinary liveness test below.
PIN_RELEASED_SID=""
# The last "directory pin stood aside for a pane pin" decision logged, as
# ">", so that steady state is recorded once
# rather than on every refresh for the life of the pane.
PIN_DECLINE_MEMO=""
# ...and the same for "this pin's transcript is cold but its session is still
# running", which is the steady state of an idle pane and would otherwise be
# logged every ten seconds for as long as nobody types.
PIN_LIVE_MEMO=""
is_uuid() {
case "$1" in
[0-9a-f][0-9a-f][0-9a-f][0-9a-f][0-9a-f][0-9a-f][0-9a-f][0-9a-f]-[0-9a-f][0-9a-f][0-9a-f][0-9a-f]-[0-9a-f][0-9a-f][0-9a-f][0-9a-f]-[0-9a-f][0-9a-f][0-9a-f][0-9a-f]-[0-9a-f][0-9a-f][0-9a-f][0-9a-f][0-9a-f][0-9a-f][0-9a-f][0-9a-f][0-9a-f][0-9a-f][0-9a-f][0-9a-f]) return 0 ;;
*) return 1 ;;
esac
}
# A pin that is not a UUID is corrupt on its face, it cannot name a
# transcript Claude Code would ever write, so there is nothing to wait for.
# Drop it here rather than spend the grace period above discovering it.
if [ -n "$PIN_SESSION_ID" ] && ! is_uuid "$PIN_SESSION_ID"; then
pin_log "ignoring malformed argv pin '$PIN_SESSION_ID' (not a UUID), falling back to the handoff file"
PIN_SESSION_ID=""
PIN_SOURCE=""
fi
# Recorded once so the unpinned session-detection fallback below can tell
# "a session that started after I did" from "a session that was already
# running when I started", see that fallback for why this matters.
# ---- clock seam ----
# Every wall-clock read in this file goes through these two, so a test can
# pin "now" with PANEL_FAKE_NOW (an epoch) and reach the boundaries that are
# otherwise only reachable by waiting: midnight rollover, and a 5h block
# ageing out. Both are places where the panel's answer depends on the CLOCK
# and not on the transcript corpus -- which is precisely what
# corpus_changed_since() cannot see, so they are the two boundaries most
# likely to break silently.
#
# BSD date takes a base time with -r. GNU date cannot be pinned the same
# way, so under a pinned clock the GNU branch REFUSES rather than quietly
# answering from the real clock: a test that believes it moved the clock and
# did not is worse than a test that cannot run at all.
panel_now() {
if [ -n "${PANEL_FAKE_NOW:-}" ]; then printf '%s' "$PANEL_FAKE_NOW"; else date +%s; fi
}
panel_date() {
if [ -z "${PANEL_FAKE_NOW:-}" ]; then date "$@"; return; fi
case " $* " in
*" -d "*)
printf 'panel_date: PANEL_FAKE_NOW cannot pin GNU date -d\n' >&2
return 64 ;;
esac
date -r "$PANEL_FAKE_NOW" "$@"
}
PANEL_START_EPOCH=$(panel_now)
# ---- the process table, in one shape, from one place --------------------
# Two of the pin decisions below are really questions about processes: which
# pane is this panel's (learn_pane_pairing), and whether the session a pin
# names is still running (session_is_live). Both used to be answered
# indirectly -- by a file the launcher raced to write, and by a transcript's
# mtime -- and both indirect answers were wrong within the same week.
#
# One shape, " ", and one seam a check can
# answer from a fixture, exactly as PANEL_FAKE_NOW does for the clock. The
# test sandbox sets PANEL_FAKE_PS to an empty file, so a check reaches the
# developer's real windows only if it says so.
#
# Cached for PANEL_PS_TTL seconds because one tick asks up to three times and
# nothing can change between them; never cached from a fixture, because a
# check that rewrites the fixture between ticks is describing a process that
# started or stopped and has to be allowed to.
PANEL_PS_TTL="${PANEL_PS_TTL:-5}"
PANEL_PS_SNAPSHOT=""
PANEL_PS_SNAPSHOT_AT=0
panel_ps() {
local now
if [ -n "${PANEL_FAKE_PS:-}" ]; then
[ -r "$PANEL_FAKE_PS" ] && cat "$PANEL_FAKE_PS"
return 0
fi
now=$(panel_now)
if [ -z "$PANEL_PS_SNAPSHOT" ] || (( now - PANEL_PS_SNAPSHOT_AT >= PANEL_PS_TTL )); then
PANEL_PS_SNAPSHOT=$(ps -ax -o pid=,ppid=,tty=,command= 2>/dev/null)
PANEL_PS_SNAPSHOT_AT="$now"
fi
printf '%s\n' "$PANEL_PS_SNAPSHOT"
}
C_RESET=$'\033[0m'; C_BOLD=$'\033[1m'
# No dim/faint attribute anywhere in this panel: \033[2m renders as a
# low-contrast grey, which is unreadable at a glance on a dark pane and is
# not a colour this panel uses. Everything it used to mark is now either a
# state (C_YELLOW, for unknown/degraded) or a note about the panel rather
# than a reading from it (C_ELECTRIC, the same rule as the refresh tags).
C_CYAN=$'\033[36m'; C_YELLOW=$'\033[33m'; C_GREEN=$'\033[32m'; C_RED=$'\033[31m'
C_BLUE=$'\033[34m'; C_MAGENTA=$'\033[35m'
# Electric blue (#7DF9FF), for the per-section "(refresh Ns)" tags and the
# session id on the Model line. 24-bit rather than one of the 8 basic codes
# because every one of those is already carrying meaning in this panel,
# cyan is section headings, blue/green/yellow/red/magenta are all
# traffic-light states, and neither of these is a reading from the panel,
# so neither should collide with them. The two basic-code blues were both
# tried on the id first and both failed on legibility: \033[34m renders dark
# on this near-black background, \033[94m renders as a grey barely different
# from the dim attribute it replaced. clear_eol()'s ANSI stripper matches
# \033[m, which covers this form too, so width
# accounting is unaffected.
C_ELECTRIC=$'\033[38;2;125;249;255m'
# A true red for the one state that means the panel's numbers are not being
# acted on (Proxy State: NOT IN USE): the theme's basic red is a muted pink.
C_ALARM=$'\033[1;38;2;255;60;60m'
# The clickable buttons are filled chips, so they read as buttons rather
# than text: [View] black on the electric blue, [X] white on bright red.
# Both 24-bit: the theme's basic red (41) renders as a muted pink, and its
# white (97) on that was barely readable.
C_BTN_VIEW=$'\033[1;38;2;0;0;0;48;2;125;249;255m'
C_BTN_CLOSE=$'\033[1;38;2;255;255;255;48;2;230;0;0m'
fmt_num() {
awk -v n="$1" 'BEGIN{
n=n+0; neg=(n<0); if(neg) n=-n;
n=int(n+0.5); s=sprintf("%d",n); out=""; l=length(s);
for(i=1;i 1st, 22 -> 22nd, 13 -> 13th.
ordinal_day() {
local n=$((10#${1:-0})) suf=th
if (( n % 100 13 )); then
case $(( n % 10 )) in 1) suf=st ;; 2) suf=nd ;; 3) suf=rd ;; esac
fi
printf '%d%s' "$n" "$suf"
}
fmt_money() {
awk -v n="${1:-0}" 'BEGIN{ a = (n0 && a<1) ? "$%.2f" : "$%.0f", n }'
}
fmt_m() { awk -v n="${1:-0}" 'BEGIN{ printf "%.2fM", n/1000000 }'; }
# Token totals to the nearest million. Same carve-out and same reason as
# fmt_money: under a million, "0M" reads as no data, so those keep one
# decimal. Distinct from fmt_m(), which stays at two decimals for the context
# gauge -- that one is a fraction of a single window ("0.45M / 1.00M"), where
# rounding to whole millions would print "0M / 1M" and gauge nothing.
fmt_mt() {
awk -v n="${1:-0}" 'BEGIN{ m = n/1000000; a = (m0 && a/dev/null)
if [ "$mode" = "transparent" ]; then
host=$(jq -r '.intercept.host // "api.anthropic.com"' "$cfg" 2>/dev/null)
bundle=$(jq -r '.intercept.ca_bundle // ""' "$cfg" 2>/dev/null)
[ -n "$bundle" ] || bundle="$HOME/.claude/certs/node-extra-ca-certs.pem"
# A live redirect line, not merely claude-burst's marker block: `remove`
# deletes the whole block, so an empty-but-present block only happens by
# hand -- but a commented-out entry is common, and reports installed
# while the hostname resolves straight to the real Anthropic IP.
awk -v h="$host" '
{ sub(/#.*/, "") }
($1 == "127.0.0.1" || $1 == "::1") {
for (i = 2; i /dev/null \
|| { printf 'no /etc/hosts redirect'; return 1; }
grep -q '# BEGIN claude-burst CA' "$bundle" 2>/dev/null \
|| { printf 'CA untrusted, TLS will fail'; return 1; }
return 0
fi
listen=$(jq -r '.listen // "127.0.0.1:7777"' "$cfg" 2>/dev/null)
settings="$HOME/.claude/settings.json"
base_url=$(jq -r '.env.ANTHROPIC_BASE_URL // ""' "$settings" 2>/dev/null)
case "$base_url" in
"") printf 'ANTHROPIC_BASE_URL unset'; return 1 ;;
*"$listen"*) return 0 ;;
*) printf 'points at %s' "$base_url"; return 1 ;;
esac
}
proxy_state_line() {
command -v claude-burst >/dev/null 2>&1 || return
local cfg="$HOME/.config/claude-burst/config.json"
[ -f "$cfg" ] || return
local state="$HOME/.config/claude-burst/state.json"
local primary secondary overflow_until now route_label route_color why
primary=$(jq -r '.primary.provider // "?"' "$cfg" 2>/dev/null)
secondary=$(jq -r '.secondary.provider // "?"' "$cfg" 2>/dev/null)
primary="${primary%-passthrough}"
secondary="${secondary%-passthrough}"
# Which slot the proxy would choose only matters if it is in the path at
# all, so this outranks PRIMARY/SECONDARY rather than sitting beside it.
if ! why=$(proxy_in_path "$cfg"); then
# The whole line in a true red: Burst is out of the path, so nothing it
# promises (failover, compaction, masking) is happening. 24-bit because
# the theme's basic red renders as a muted pink, and the reason was in
# yellow inside brackets, which read as a footnote rather than the alarm.
printf ' 🔀 %sProxy State: NOT IN USE, %s%s%s\n' \
"$C_ALARM" "$why" "$C_RESET" "$(panel_view_tag)"
return
fi
overflow_until=0
[ -f "$state" ] && overflow_until=$(jq -r '.overflow_until // 0' "$state" 2>/dev/null)
now=$(panel_now)
if [ "${overflow_until:-0}" -gt "$now" ] 2>/dev/null; then
route_label="SECONDARY ($secondary)"; route_color="$C_YELLOW"
else
route_label="PRIMARY ($primary)"; route_color="$C_GREEN"
fi
printf ' 🔀 Proxy State: %s%s%s%s\n' "$route_color" "$route_label" "$C_RESET" "$(panel_view_tag)"
}
# There's no Anthropic API call for "what plan is this account on", the
# closest thing is ~/.claude.json's oauthAccount block, which Claude Code
# itself populates from the account API at login and refreshes periodically
# (organizationType e.g. "claude_max", organizationRateLimitTier e.g.
# "default_claude_max_20x"). Absent entirely for API-key auth (no
# subscription to report), so silently print nothing rather than "Unknown".
# Cached on its own long TTL, not tied to CCUSAGE_CACHE_TTL, a plan
# practically never changes mid-session, so there's no reason to re-parse
# a multi-hundred-KB json file every 5-10s just to re-read the same string.
LICENSE_CACHE_TTL=300
license_line() {
local acct_file="$HOME/.claude.json" label now mtime
# $CCUSAGE_CACHE_DIR is defined later in the file (with the rest of the
# ccusage cache machinery) -- computed here, not as a top-level global,
# so this function is safe to define before that point under `set -u`.
local LICENSE_CACHE="$CCUSAGE_CACHE_DIR/license.txt"
now=$(panel_now)
# Route-aware: claude-burst's secondary path hits a totally different
# vendor (config's secondary.provider, e.g. "openai-compatible" against
# Together/GLM) billed by its own API key, nothing to do with the
# Anthropic Max/Pro seat below. Showing "Max (20x)" while traffic is
# actually on secondary would be wrong, not just stale, so check the same
# overflow state proxy_state_line() checks and short-circuit first.
if command -v claude-burst >/dev/null 2>&1; then
local cfg="$HOME/.config/claude-burst/config.json"
if [ -f "$cfg" ]; then
local state="$HOME/.config/claude-burst/state.json" overflow_until active_provider
overflow_until=0
[ -f "$state" ] && overflow_until=$(jq -r '.overflow_until // 0' "$state" 2>/dev/null)
if [ "${overflow_until:-0}" -gt "$now" ] 2>/dev/null; then
active_provider=$(jq -r '.secondary.provider // "?"' "$cfg" 2>/dev/null)
else
active_provider=$(jq -r '.primary.provider // "?"' "$cfg" 2>/dev/null)
fi
if [[ "$active_provider" != *oauth* ]]; then
printf ' 📜 License: %s%s%s\n' "$C_YELLOW" "API key (${active_provider%-passthrough})" "$C_RESET"
return
fi
fi
fi
if [ -f "$LICENSE_CACHE" ]; then
mtime=$(stat -f %m "$LICENSE_CACHE" 2>/dev/null || stat -c %Y "$LICENSE_CACHE" 2>/dev/null || echo 0)
if (( now - mtime /dev/null)
if [ -z "$org_type" ]; then
printf 'none' > "$LICENSE_CACHE.$$.tmp" && mv "$LICENSE_CACHE.$$.tmp" "$LICENSE_CACHE"
return
fi
case "$org_type" in
claude_max) label="Max" ;;
claude_pro) label="Pro" ;;
claude_team) label="Team" ;;
claude_enterprise) label="Enterprise" ;;
claude_free) label="Free" ;;
*) label="${org_type#claude_}" ;;
esac
mult=$(jq -r '.oauthAccount.organizationRateLimitTier // empty' "$acct_file" 2>/dev/null | grep -oE '[0-9]+x$')
[ -n "$mult" ] && label="$label ($mult)"
printf '%s' "$label" > "$LICENSE_CACHE.$$.tmp" && mv "$LICENSE_CACHE.$$.tmp" "$LICENSE_CACHE"
fi
[ "$label" = "none" ] && return
printf ' 📜 License: %s%s%s\n' "$C_CYAN" "$label" "$C_RESET"
}
# ---- traffic-light thresholds, shared by every colored figure in the panel ----
TIER_YELLOW_MULT=1.5
TIER_RED_MULT=2.0
BURN_YELLOW=3
BURN_RED=6
# Lowered from 40/60/80 on 14Sep26. At the old bands a 1M-window session
# only turned red past 600k, by which point there is little left to do about
# it but compact; the point of the line is to be seen while the session can
# still be steered. Red is also where the turn table starts colouring WHOLE
# rows (see the table's rank rule), so it is the threshold that decides when
# the panel gets loud, not purple.
CTX_YELLOW=30
CTX_RED=50
CTX_PURPLE=70
# A value only gets colored once it clears an absolute floor, in a cheap
# session (avg $0.05) a $0.13 turn is >2x average and would false-positive
# red on money nobody would look twice at.
MIN_SESSION_ALERT=5.00
MIN_DAILY_ALERT=15.00
MIN_TREND_ALERT=2.00
MIN_DELTA_ALERT=1000
# value baseline yellow_mult red_mult floor -> green/yellow/red
tier_color() {
local v="$1" a="$2" ym="$3" rm="$4" floor="${5:-0}" color="$C_GREEN"
awk -v v="$v" -v a="$a" -v f="$floor" 'BEGIN{exit !(a+0>0 && v+0>=f)}' || { printf '%s' "$color"; return; }
awk -v v="$v" -v a="$a" -v m="$ym" 'BEGIN{exit !(v+0>a*m)}' && color="$C_YELLOW"
awk -v v="$v" -v a="$a" -v m="$rm" 'BEGIN{exit !(v+0>a*m)}' && color="$C_RED"
printf '%s' "$color"
}
# value yellow_threshold red_threshold -> green/yellow/red (no baseline needed)
threshold_color() {
local v="$1" yt="$2" rt="$3" color="$C_GREEN"
awk -v v="$v" -v t="$yt" 'BEGIN{exit !(v+0>t)}' && color="$C_YELLOW"
awk -v v="$v" -v t="$rt" 'BEGIN{exit !(v+0>t)}' && color="$C_RED"
printf '%s' "$color"
}
# value yellow_threshold red_threshold purple_threshold -> green/yellow/red/purple
# yt && rt && pt purple.
ctx_tier_color() {
local v="$1" yt="$2" rt="$3" pt="$4" color="$C_GREEN"
awk -v v="$v" -v t="$yt" 'BEGIN{exit !(v+0>t)}' && color="$C_YELLOW"
awk -v v="$v" -v t="$rt" 'BEGIN{exit !(v+0>t)}' && color="$C_RED"
awk -v v="$v" -v t="$pt" 'BEGIN{exit !(v+0>t)}' && color="$C_MAGENTA"
printf '%s' "$color"
}
# model id -> green (cheapest tier, e.g. Haiku) / yellow (mid, e.g. Sonnet) /
# cyan (most expensive, e.g. Opus/Fable/Mythos), mirrors the PRICES table in
# the per-turn-table python block below, but keyed on model-name substrings
# since this runs in bash, before that table's exact $/1M figures are in scope.
#
# The top tier is cyan and NOT red on purpose. Red everywhere else in this
# panel means "a threshold was crossed", an over-average session, a burn
# rate past BURN_RED, a turn that spiked. The model is a deliberate choice
# that holds for the whole session, so colouring it red made the panel open
# on a standing alarm that never cleared and could not be acted on, which
# dulls the red that does mean something. Spend on an expensive model still
# shows up in red, on the Session/Today/Burn lines that actually measure it.
model_tier_color() {
case "${1,,}" in
*haiku*) printf '%s' "$C_GREEN" ;;
*opus*|*fable*|*mythos*) printf '%s' "$C_CYAN" ;;
*) printf '%s' "$C_YELLOW" ;;
esac
}
# A short colored title, not a full-width divider bar, a bar that's drawn
# at $cols but rendered later in a narrower/resized pane just wraps into a
# confusing second row of "=" or "-", which is worse than no rule at all.
header() { local title="$1"; printf '%s%s%s\n' "$C_BOLD$C_CYAN" "$title" "$C_RESET"; }
# Erases to end of line after every printed row before the newline, so a
# frame whose lines are shorter than the previous frame's (e.g. right after
# a pane resize, or just because the numbers got shorter) never leaves
# trailing characters from the old frame ghosting through the new one.
# Also truncates to $COLS first: \033[K only erases stray characters
# trailing on the SAME physical row, it can't stop an over-long line from
# wrapping onto an extra physical row. In a narrow pane that wrapping let a
# frame's physical row count silently exceed $rows, so the next frame's
# cursor-home (below) landed mid old-content instead of at the true top,
# gluing fragments of consecutive frames together.
#
# Width must be measured on the VISIBLE text only. Raw $0 inflates past the
# line's actual on-screen width two ways: ANSI color codes are invisible
# bytes, and LC_ALL=C (set at the top, needed for numeric formatting
# elsewhere) makes awk's length() count bytes rather than characters, so
# every line's leading multi-byte UTF-8 emoji counts as 3-4 "characters"
# instead of 1. Both inflations made ordinary lines that would never have
# wrapped get hard-truncated anyway, chopping real content off the end
# (e.g. losing the trailing ")" on a 44-char line in a 44-col pane). Strip
# ANSI codes, then subtract UTF-8 continuation bytes (10xxxxxx, i.e.
# \200-\277), each is one extra byte contributed by a multi-byte
# character, not a visible column, to get the true visible length before
# comparing to width. Only fall back to plain (uncolored) truncated text in
# the genuine-overflow case, and correct the cut point by the same
# continuation-byte count rather than slicing the raw ANSI-laden string.
clear_eol() { awk -v w="${COLS:-999}" '{ line = $0; plain = line; gsub(/\033\[[0-9;]*m/, "", plain); cont = plain; n_cont = gsub(/[\200-\277]/, "", cont); vis_len = length(plain) - n_cont; if (vis_len > w) plain = substr(plain, 1, w + n_cont); printf "%s\033[K\n", (vis_len > w ? plain : line) }'; }
# ---- persisted hourly-cost buckets, used by "Today's Predicted Value" ----
# Forecasts the rest of today from this machine's own historical hour-of-day
# spend pattern, instead of extrapolating ccusage's live burnRate.costPerHour
# (a seconds-scale figure that spikes hugely right after any single pricey
# turn, then decays as cheaper turns dilute it, e.g. $35/hr -> $4.64/hr ->
# $2.21/hr across three refreshes with nothing unusual happening). A full
# 30-day JSONL scan is too slow to redo every 5s refresh, so this only
# rebuilds when the cache is stale; every other refresh just reads the file.
# Shared with claude-cost-alert-check.sh -- see that file's header. Sourced,
# not reimplemented, and a hard failure when absent: a panel that silently
# lost its projection would draw "Today's Predicted Value" as today's actual
# spend, which is a plausible-looking number and therefore the worst kind of
# wrong. Every other gate in this repo learned the same lesson the same way.
DAY_PROJECTION_LIB="$HOME/.local/bin/claude-day-projection.sh"
if [ -r "$DAY_PROJECTION_LIB" ]; then
. "$DAY_PROJECTION_LIB"
else
printf 'ccusage-panel: missing %s -- reinstall with claude-panel-setup.sh\n' \
"$DAY_PROJECTION_LIB" >&2
exit 3
fi
HOURLY_BUCKET_CACHE="$HOME/.cache/claude-hourly-buckets.json"
HOURLY_BUCKET_TTL=900
HOURLY_BUCKET_WINDOW_DAYS=30
refresh_hourly_buckets() {
local cache_mtime now_epoch lock_dir lock_age
now_epoch=$(panel_now)
if [ -f "$HOURLY_BUCKET_CACHE" ]; then
cache_mtime=$(stat -f %m "$HOURLY_BUCKET_CACHE" 2>/dev/null || stat -c %Y "$HOURLY_BUCKET_CACHE" 2>/dev/null || echo 0)
if (( now_epoch - cache_mtime /dev/null; then
# Held by another panel's rebuild, unless it died mid-rebuild and
# left the lock behind, which a real rebuild never takes this long.
lock_age=$(( now_epoch - $(stat -f %m "$lock_dir" 2>/dev/null || stat -c %Y "$lock_dir" 2>/dev/null || echo "$now_epoch") ))
if (( lock_age > 60 )); then
rmdir "$lock_dir" 2>/dev/null
mkdir "$lock_dir" 2>/dev/null || return
else
return
fi
fi
mkdir -p "$(dirname "$HOURLY_BUCKET_CACHE")"
# Same per-model pricing table as the per-turn breakdown below (JSONL
# entries carry token usage but no precomputed cost), kept as a separate
# copy since each heredoc here is a standalone python3 invocation.
python3 - "$HOURLY_BUCKET_CACHE" "$HOURLY_BUCKET_WINDOW_DAYS" <= its last entry's timestamp (append-only),
# if that's still before the window, nothing inside can be in range.
if os.path.getmtime(path) < cutoff:
continue
with open(path) as f:
lines = f.readlines()
except OSError:
continue
for line in lines:
try:
d = json.loads(line)
except json.JSONDecodeError:
continue
if d.get("type") != "assistant":
continue
msg = d.get("message", {})
usage = msg.get("usage")
mid = msg.get("id")
ts_str = d.get("timestamp")
if not usage or not mid or not ts_str or mid in seen:
continue
try:
ts_utc = dt.datetime.fromisoformat(ts_str.replace("Z", "+00:00"))
except ValueError:
continue
if ts_utc.timestamp() /dev/null
}
# ---- shared ccusage cache/lock, used by every `ccusage` call below ----
# Every open panel forked its OWN `ccusage` process for every one of ~13
# sequential calls per refresh, PLUS one more forked in parallel per session
# file on disk for "Top Sessions" -- with a few terminals open and a few
# dozen sessions, that's 100+ node processes spawned every 5s, several
# caught mid-fork pegged at 100%+ CPU. That's the battery drain. This wraps
# every call in a cache keyed by its exact arguments, shared across every
# panel via the filesystem, so at most one panel actually runs a given query
# per $CCUSAGE_CACHE_TTL -- everyone else (including this same panel on its
# next refresh) just reads the file. Same mkdir-lock pattern as
# refresh_hourly_buckets() above (atomic on POSIX, no flock dependency),
# generalized from one fixed python rebuild to arbitrary ccusage subcommands.
CCUSAGE_CACHE_DIR="$HOME/.cache/ccusage-panel-cache"
# Every ccusage-backed figure now lives on the slow tier, so the shared TTL
# tracks it -- but deliberately SHORTER than the tier, not equal to it.
#
# Equal was measured to be wrong. A slow tick at t=$SLOW_REFRESH finds an
# entry written at t=0 aged exactly $SLOW_REFRESH, and `age < TTL` is then a
# coin flip decided by a second's rounding: land on the TTL side and the tick
# serves the old entry WITHOUT consulting the corpus gate, so the section
# skips to the tick after -- an observed 240s effective refresh on a header
# advertising 120s. Which is the panel's oldest bug wearing a new hat.
#
# Three quarters of the tier means a slow tick always finds the TTL lapsed
# and always defers to corpus_changed_since(), which is the right arbiter:
# refetch iff the answer can actually have changed. The TTL's remaining job
# is only to stop N panels stampeding the same query at once.
TTL_LIVE=$(( SLOW_REFRESH * 3 / 4 ))
(( TTL_LIVE < 5 )) && TTL_LIVE=5
# The history bucket serves a stale answer even when the corpus HAS changed
# and the answer is known to be different. That is a real departure from the
# rule above -- "refetch iff the answer can have changed" -- and it is taken
# deliberately, for the one report where nothing anybody watches lives: the
# day's session RANKING and the 7-day session baselines. A ranking does not
# reorder inside a quarter of an hour, and an average over seven days moves
# by less than its own rounding. Measured on a 653MB corpus, `session` costs
# 0.71 CPU-s per fetch against 0.036 for an entire fast tick.
#
# 900 is 7.5 slow ticks, deliberately not a whole multiple: the same
# rounding coin-flip the comment above describes applies to every bucket,
# not just the one it was first found in.
TTL_HISTORY=$(( SLOW_REFRESH * 15 / 2 ))
(( TTL_HISTORY < TTL_LIVE )) && TTL_HISTORY=$TTL_LIVE
mkdir -p "$CCUSAGE_CACHE_DIR"
# ---- prune the per-session caches --------------------------------------
# Three of the caches below are keyed by SESSION, not by query, so they do
# not converge on a fixed set of files the way the `.json` query cache
# does -- `turns-.out`, `sessid-.tsv` and `todaytok-.tsv`
# gain one entry per session and never lose one. There are already 200+
# transcripts in ~/.claude/projects on this machine, and nothing ever
# removed the entries for the ones last touched months ago. Same shape as
# opencode-panel.sh's `export-*.json`, which is pruned; this side was
# flagged as a known gap when that one was written and is fixed here.
#
# `errors-.log` is the same problem with a faster clock: one per panel
# PROCESS. restore_tty removes it on a clean exit, but that trap is only
# installed when stdin is a tty, so a panel killed with SIGKILL, or run
# without a terminal, leaves its file behind for good.
#
# A cache entry is only rewritten on a MISS, so an entry being served from
# cache does not keep its own mtime fresh -- 7 days here means "no session
# whose transcript last moved a week ago", and deleting one costs exactly
# one refetch the next time that session is shown. A live panel's error log
# is truncated every slow tick (120s), so it can never approach the cutoff.
#
# Once per panel launch, not per tick: a `find` over a few hundred small
# files is cheap, but it is not free, and nothing here changes fast enough
# to need it more often.
find "$CCUSAGE_CACHE_DIR" -maxdepth 1 \
\( -name 'turns-*.out' -o -name 'sessid-*.tsv' -o -name 'todaytok-*.tsv' \
-o -name 'errors-*.log' -o -name '*.tmp' \) -mtime +7 -delete 2>/dev/null
# ---- why every temp file carries a pid -----------------------------------
# The write pattern throughout this file is `> "$f.tmp" && mv "$f.tmp" "$f"`,
# so the rename is atomic and a reader never sees half a file. The TEMP name
# was not per-process though, and three of these caches are keyed by session
# with no lock around them -- so two panels open on the same session both
# wrote `.tmp`, one renamed it, and the other's `mv` failed on a path
# that no longer existed.
#
# That is not a silent loss: the builders' stderr is routed into
# PANEL_ERR_FILE, so it rendered as `! mv: ...tmp: No such file or
# directory` on the panel itself. Found by running the panel and reading it
# while a second one was open -- which is the only way it could have been
# found, since with one panel running there is nothing to race.
#
# `$$` makes the temp name unique per process; the rename stays atomic
# because it is still a rename within one directory. A panel killed between
# the write and the rename leaves its temp behind, which is what the `.tmp`
# glob in the prune above is for.
# ---- errors are rendered, never swallowed ------------------------------
# Everything in this panel is a number, and a number that failed to compute
# looks exactly like a number that computed to zero. Almost every call here
# ends in `2>/dev/null` -- correctly, because a chatty stderr would shred a
# 1/3-width pane -- so without somewhere for failures to go, a broken query,
# a jq that could not parse, or a builder that died on an unbound variable
# all render as $0.00 and nothing else.
#
# A FILE rather than a variable, because the section builders run inside
# $(...) subshells and a global set in there cannot be read back out. The
# loop truncates it once per slow tick, so what shows is what just failed
# rather than everything that ever has.
PANEL_ERR_FILE="$CCUSAGE_CACHE_DIR/errors-$$.log"
: > "$PANEL_ERR_FILE" 2>/dev/null
panel_error() { printf '%s\n' "$1" >> "$PANEL_ERR_FILE" 2>/dev/null; }
# The history bucket's own rate. Sections fed by it must advertise THIS, not
# the tick rate: the tick is how often they are redrawn, which is not how
# often the numbers in them can change. A header that names the redraw rate
# while the data underneath is a quarter of an hour old is the panel's
# oldest recurring bug, and it has always looked exactly this reasonable.
RATE_HISTORY="$(fmt_interval "$TTL_HISTORY")"
# Which bucket a query belongs in is decided by the QUERY, never by the call
# site, so two callers of the same report cannot disagree about how fresh it
# is. An unclassified query lands in the live bucket on purpose: a new query
# nobody has thought about must be wrongly EXPENSIVE, never wrongly stale.
#
# `daily` is deliberately NOT in the history bucket, despite being the
# obvious candidate: the same payload that carries the 7/30-day baselines
# also carries TODAY'S total, and today's total is one of the numbers this
# panel exists to watch climb. Deferring it 15 minutes would make it step
# rather than move, and only while turns are landing -- which is precisely
# when someone is looking at it. The baselines would happily be deferred;
# they just do not arrive on their own.
#
# So the freshness of Today is what actually costs here, and no arrangement
# of TTLs can change that: it is one corpus scan per tick or a stale number.
# Phase 2 (drop the statusline fetch) and Phase 3 (incremental rollup) are
# the levers on it; this one is not.
ccusage_ttl_for() {
# Every query is `claude ...` now, so the subcommand is the
# SECOND word. Keyed on the first, everything would read as "claude" and
# land in the live bucket -- which is the safe direction, but silently,
# and the history bucket would quietly stop existing.
local q="$1"
[ "$q" = "claude" ] && q="${2:-}"
case "$q" in
session|weekly|monthly) printf '%s' "$TTL_HISTORY" ;;
*) printf '%s' "$TTL_LIVE" ;;
esac
}
# Spread the expiries. Without this every entry is seeded when the panel
# starts and they all lapse on the same tick, for the life of the pane --
# one lurching frame and one CPU spike instead of several small ones, and
# synchronised across every open panel rather than merely within one.
#
# Derived from the cache key, NOT from $RANDOM or the pid: every panel on
# this machine must compute the SAME expiry for the same query, or N panels
# stagger into N separate fetches of one shared entry and the cross-panel
# cache stops being a cache. Deterministic per key is what makes it shared.
#
# Subtracted, never added, so the effective TTL is at most the advertised
# one. A label may under-promise freshness; it may never over-promise it.
ccusage_ttl_jittered() { # $1 = subcommand, $2 = cache key, $3 = 2nd word
local ttl j
ttl=$(ccusage_ttl_for "$1" "${3:-}")
j=$(( 0x$(printf '%s' "$2" | cut -c1-2) % 15 ))
printf '%s' $(( ttl - ttl * j / 100 ))
}
# ---- corpus-change gate ----
# The TTL above exists so that N panels (and the cost-alert hook) share ONE
# fetch per window instead of N -- that part is doing its job and stays at
# 10s. What it does NOT do is notice that the answer cannot have changed:
# with TTL == refresh, every redraw finds the entry just expired and pays a
# full re-scan, even on a pane nobody has typed into for an hour.
#
# But a ccusage report is a pure function of the transcript corpus. If no
# transcript has been written since a cache entry was produced, re-running
# the query cannot produce a different answer -- so the entry stays valid
# past its TTL. This checks that directly, and it is ~300x cheaper than the
# scan it avoids (0.01 CPU-seconds against 2.99 for a full refresh's
# queries), because `-print -quit` stops at the first newer path rather than
# walking the whole tree.
#
# Deliberately NOT restricted to *.jsonl: a file being added or removed
# updates its parent directory's mtime but not any file's, so filtering to
# transcripts alone would miss new sessions and archived ones. Matching
# every path under the tree is conservative -- it can only cause an
# unnecessary refetch, never a missed change.
#
# The cache file is never touched on a gate hit. Its mtime must keep meaning
# "the corpus state this content was computed from"; bumping it to now would
# move the comparison point forward past writes this check has not actually
# examined.
corpus_changed_since() {
[ -n "$(find "$HOME/.claude/projects" -newer "$1" -print -quit 2>/dev/null)" ]
}
# `blocks --active` used to be exempted from this gate, because its
# projection counts down (remainingMinutes) and a gated entry would freeze
# the "Nh Nm left" readout on an idle pane -- so it paid a full corpus scan
# every tick forever, on the busiest and the idlest pane alike, purely to
# re-read a clock.
#
# It is gated now. The two fields that actually move with the wall clock are
# both derived from the block's OWN start/end timestamps, which do not
# change for the life of the block: the panel keeps startTime/endTime as
# epochs and recomputes "time left" and "elapsed hours" itself on every fast
# tick (see the loop). Everything genuinely fetched here -- the block's cost
# and token totals -- can only change when a turn is written, which is
# exactly what this gate tests. So nothing is exempt: every query is a pure
# function of the transcript corpus.
ccusage_query_is_gated() { :; }
# $1... = ccusage subcommand + args, e.g. `blocks --active --json --offline`.
# Prints the (possibly cached) JSON to stdout.
ccusage_cached() {
local key cache_file lock_dir now_epoch cache_mtime lock_age waited out have_lock
local ttl
key=$(printf '%s' "$*" | shasum -a 256 | cut -c1-16)
cache_file="$CCUSAGE_CACHE_DIR/$key.json"
lock_dir="$cache_file.lock"
now_epoch=$(panel_now)
ttl=$(ccusage_ttl_jittered "$1" "$key" "${2:-}")
if [ -f "$cache_file" ]; then
cache_mtime=$(stat -f %m "$cache_file" 2>/dev/null || stat -c %Y "$cache_file" 2>/dev/null || echo 0)
if (( now_epoch - cache_mtime /dev/null; then
have_lock=0
# A real ccusage call finishes in well under this -- a lock this old was
# left behind by a panel that died mid-fetch. Reclaim it rather than
# leaving every panel serving a permanently stale cache forever.
lock_age=$(( now_epoch - $(stat -f %m "$lock_dir" 2>/dev/null || stat -c %Y "$lock_dir" 2>/dev/null || echo "$now_epoch") ))
if (( lock_age > 30 )); then
rmdir "$lock_dir" 2>/dev/null
mkdir "$lock_dir" 2>/dev/null && have_lock=1
fi
fi
if [ "$have_lock" = 0 ]; then
# Another panel is already refetching this exact query -- serve the
# stale-but-recent copy rather than block this panel's whole refresh on
# someone else's in-flight fetch.
if [ -f "$cache_file" ]; then
cat "$cache_file"
return
fi
# No cache at all yet for this key (its very first fetch, e.g. two
# panels launched together) -- briefly wait for the winner instead of
# rendering this row blank for a whole refresh cycle.
waited=0
while [ -d "$lock_dir" ] && [ ! -f "$cache_file" ] && (( waited "$err_tmp"); rc=$?
# Empty counts as failure as much as a non-zero exit: every query here
# returns a JSON object, and "" parses to nothing while looking like a
# quiet day.
if [ "$rc" -ne 0 ] || [ -z "$out" ]; then
panel_error "ccusage $1 ${2:-} failed (exit $rc): $(tr -d '\n' /dev/null
return 0
fi
rm -f "$err_tmp"
printf '%s' "$out" > "$cache_file.$$.tmp" && mv "$cache_file.$$.tmp" "$cache_file"
[ "$have_lock" = 1 ] && rmdir "$lock_dir" 2>/dev/null
printf '%s' "$out"
}
# ---- one daily+weekly+monthly load instead of four separate ones ----
# `daily --last 1`, `weekly --last 1`, `monthly --last 1` and `daily --since
# ` were four independent ccusage invocations per refresh, and since
# EVERY invocation reparses the whole transcript corpus (which reaches hundreds of MB) to
# answer, that was four full scans for four numbers. ccusage's own
# `--sections` flag emits all three reports from a single load, so ask for
# that once and pick the wanted period out of each: ~4x less CPU, and no
# reimplementation of ccusage's week/month boundary rules -- deriving these
# from a daily window by hand would have meant hardcoding "weeks start
# Monday", which is ccusage's business to define, not ours.
#
# Deliberately NO `--since` here. `--since` truncates the weekly and monthly
# ROWS as well as the daily ones -- with a mid-month `--since`,
# ccusage's own monthly row for that month reads only the tail of it, not
# the month's true total -- so
# passing the 30-day bound to save payload would have silently understated
# month-to-date on the 31st of any 31-day month, when the 29-day window no
# longer reaches the 1st. Full range costs the same scan (the scan is the
# cost, not the serialization) and cannot be wrong. spend30 is recovered by
# filtering the daily rows below, which matches `daily --since `
# exactly.
# `ccusage daily` means EVERY detected agent CLI -- Codex, OpenCode, Gemini,
# Copilot and the rest -- so a panel titled "Claude Code Usage" was reporting
# other agents' spend as its own. Measured simultaneously (generic run either
# side of the scoped one, both giving the identical figure): $6823.37
# all-agent against $6809.21 Claude-only, a real $14.16.
#
# The `claude` subcommand does not accept --sections, so the one combined
# load becomes three. That is affordable only because of where each lands:
# `daily` carries TODAY and stays in the live bucket at the same 1.01 CPU-s
# the combined call cost, while `weekly` and `monthly` move to the history
# bucket (0.73 + 0.72, 96 fetches a day instead of 720) for about +2.3
# CPU-min/day. Merged back into the shape every caller already reads, so
# nothing downstream knows the difference.
recent_sections_fetch() {
local d w m
d=$(ccusage_cached claude daily --json --offline)
w=$(ccusage_cached claude weekly --json --offline)
m=$(ccusage_cached claude monthly --json --offline)
# The scoped reports do NOT use the unified report's key names -- the
# period each row covers is `date`, `week` and `month` respectively, where
# `--sections` called all three `period`. Nothing errors on the
# difference: `select(.period == $t)` simply matches no row, and Today,
# Folder and 30-Day Value all render a confident $0.00. Caught by running
# the panel, not by the suite, which is why the smoke test is in the
# rollout and not optional.
#
# Renamed here, in the one adapter, so every consumer downstream keeps
# reading `.period` and none of them has to know which report it came from.
local merged
merged=$(jq -c -n --argjson d "${d:-null}" --argjson w "${w:-null}" --argjson m "${m:-null}" \
'{ daily: [ ($d.daily // [])[] | .period = .date ],
weekly: [ ($w.weekly // [])[] | .period = .week ],
monthly: [ ($m.monthly // [])[] | .period = .month ] }' 2>/dev/null)
backfill_unpriced "$merged"
}
# Fills in what ccusage priced at $0 (see unpriced_models) from the panel's
# own price table, when the panel has a rate for that model.
#
# ccusage ships its prices with the release, and on 2026-09-23 neither the
# installed nor the latest ccusage knew Claude Opus 5.5 -- a day of Opus 5.5
# rendered as `opus-5-5: $0`, then as `?`. Pricing it from ccusage's own
# token totals is not an option: its breakdown does not split 5m from 1h
# cache writes (2x vs 1.25x input), and that day's Opus 5.5 writes were 97%
# 1h, so the aggregate would have come out low. This re-reads the
# transcripts for just those models, prices each message exactly as the turn
# table does, and writes the result into the daily, weekly and monthly rows.
#
# Only a breakdown ccusage left at $0 is touched; a model ccusage does price
# keeps ccusage's figure. A model neither of us can price stays at $0 and
# unpriced_models still flags it.
backfill_unpriced() {
local json="$1" want since extra
want=$(unpriced_models "$json" | tr '\n' ' ')
since=$(jq -r '[.daily[]? | select(any(.modelBreakdowns[]?;
(.cost // 0) == 0 and ((.inputTokens // 0) + (.outputTokens // 0)
+ (.cacheCreationTokens // 0) + (.cacheReadTokens // 0)) > 0))
| .period] | min // empty' <</dev/null)
if [ -z "${want// /}" ] || [ -z "$since" ]; then
printf '%s' "$json"
return
fi
extra=$(python3 - "$since" $want <<'BACKFILL_PYEOF'
import glob, json, os, sys, datetime as dt
PRICES = {
"claude-sonnet-5-5": (2.00, 10.00),
"claude-sonnet-5": (2.00, 10.00),
"claude-opus-5-5": (4.00, 20.00),
"claude-opus-5": (5.00, 25.00),
"claude-haiku-4-5": (1.00, 5.00),
# Claude Code logs Haiku by its dated id, not the alias above.
"claude-haiku-4-5-20251001": (1.00, 5.00),
"claude-sonnet-4-6": (3.00, 15.00),
"claude-opus-4-8": (5.00, 25.00),
"claude-opus-4-7": (5.00, 25.00),
"claude-opus-4-6": (5.00, 25.00),
"claude-fable-5": (10.00, 50.00),
"claude-fable-5-1": (10.00, 50.00),
"claude-mythos-5": (10.00, 50.00),
"claude-mythos-5-1": (10.00, 50.00),
}
CACHE_READ_PRICE = {
"claude-opus-5-5": 0.20,
"claude-fable-5-1": 0.25,
}
CACHE_READ_MULT, CACHE_WRITE_5M_MULT, CACHE_WRITE_1H_MULT = 0.1, 1.25, 2.0
since = dt.date.fromisoformat(sys.argv[1])
want = {m for m in sys.argv[2:] if m in PRICES}
# The same priced messages, summed three ways: by local day (the daily,
# weekly and monthly rows), by session (the session report behind Top
# Sessions, Folder and the per-session baselines) and by UTC hour (the
# active block, whose start and end are both on the hour).
out = {"day": {}, "session": {}, "hour": {}}
if want:
# Append-only files: an mtime before `since` cannot hold a later entry.
cutoff = dt.datetime.combine(since, dt.time()).timestamp() - 86400
seen = set()
# Recursive: subagent transcripts live under //subagents/,
# and ccusage counts them. A top-level-only glob missed ~1% of a day.
for path in glob.glob(os.path.expanduser("~/.claude/projects/**/*.jsonl"),
recursive=True):
try:
if os.path.getmtime(path) < cutoff:
continue
with open(path) as f:
lines = f.readlines()
except OSError:
continue
for line in lines:
if '"assistant"' not in line:
continue
try:
d = json.loads(line)
except json.JSONDecodeError:
continue
msg = d.get("message") or {}
model = msg.get("model")
usage = msg.get("usage")
if model not in want or not usage or d.get("type") != "assistant":
continue
# Same dedup key as ccusage: a message is logged once per content
# block, each carrying the same usage.
key = (msg.get("id"), d.get("requestId"))
if key in seen:
continue
seen.add(key)
try:
when = dt.datetime.fromisoformat(d["timestamp"].replace("Z", "+00:00"))
except (KeyError, ValueError):
continue
day = when.astimezone().date()
sid = d.get("sessionId") or os.path.basename(path).removesuffix(".jsonl")
hour = str(int(when.timestamp()) // 3600 * 3600)
if day < since:
continue
cc = usage.get("cache_creation") or {}
if cc:
cw_1h = cc.get("ephemeral_1h_input_tokens", 0)
cw_5m = cc.get("ephemeral_5m_input_tokens", 0)
else:
cw_1h, cw_5m = 0, usage.get("cache_creation_input_tokens", 0)
price_in, price_out = PRICES[model]
price_cr = CACHE_READ_PRICE.get(model, price_in * CACHE_READ_MULT)
cost = (
usage.get("input_tokens", 0) * price_in
+ usage.get("output_tokens", 0) * price_out
+ usage.get("cache_read_input_tokens", 0) * price_cr
+ cw_1h * price_in * CACHE_WRITE_1H_MULT
+ cw_5m * price_in * CACHE_WRITE_5M_MULT
) / 1_000_000
for kind, k in (("day", day.isoformat()), ("session", sid), ("hour", hour)):
per = out[kind].setdefault(k, {})
per[model] = per.get(model, 0.0) + cost
print(json.dumps(out))
BACKFILL_PYEOF
)
if [ -z "$extra" ] || [ "$(jq -r '.day | length' <</dev/null)" = "0" ]; then
printf '%s' "$json"
return
fi
# A row's span: a day is its own date, a week the seven days from its
# start (whichever weekday ccusage starts on -- see check Z), a month
# every date with its YYYY-MM prefix.
jq -c --argjson x "$extra" '
def day_add($n): (. + "T00:00:00Z" | fromdate) + $n * 86400 | todate[0:10];
def in_span($kind; $p):
if $kind == "day" then . == $p
elif $kind == "week" then . >= $p and . <= ($p | day_add(6))
else startswith($p) end;
def fill($kind):
.period as $p
| [ $x.day | to_entries[] | select(.key | in_span($kind; $p)) | .value ] as $days
| ((.modelBreakdowns // []) | map(.cost // 0) | add // 0) as $before
| .modelBreakdowns = [ (.modelBreakdowns // [])[]
| if (.cost // 0) == 0
then .modelName as $m | .cost = ([ $days[] | .[$m] // 0 ] | add // 0)
else . end ]
| .totalCost = (.totalCost // 0)
+ (([ .modelBreakdowns[].cost ] | add // 0) - $before);
.daily |= map(fill("day"))
| .weekly |= map(fill("week"))
| .monthly |= map(fill("month"))
| .backfill = { session: $x.session, hour: $x.hour }
' <</dev/null || printf '%s' "$json"
}
# The session and block reports price the same models at the same $0, and
# without these Top Sessions dropped every Opus 5.5 session off the list (a
# $20 session ranked below a $1 one) and Current Block read $6 for a block
# that had spent over $25. Both read the per-session and per-hour sums the
# backfill above left in RECENT_JSON, so neither costs a second scan.
#
# $1 = {session:[...]} (all_sessions' shape). Same rule as the daily rows:
# only a breakdown ccusage left at $0 is filled.
backfill_sessions() {
local bf
bf=$(jq -c '.backfill.session // {}' <</dev/null)
if [ -z "$bf" ] || [ "$bf" = "{}" ]; then
printf '%s' "$1"
return
fi
jq -c --argjson x "$bf" '
.session |= map(
(.period // "") as $sid
| ((.modelBreakdowns // []) | map(.cost // 0) | add // 0) as $before
| .modelBreakdowns = [ (.modelBreakdowns // [])[]
| if (.cost // 0) == 0
then .modelName as $m | .cost = ($x[$sid][$m] // 0)
else . end ]
| .totalCost = (.totalCost // 0)
+ (([ .modelBreakdowns[].cost ] | add // 0) - $before))
' <</dev/null || printf '%s' "$1"
}
# $1 = block start epoch, $2 = block end epoch. Prints the backfilled cost
# of the hours in [start, end). ccusage's block has no per-model breakdown,
# but every model in the backfill is one it priced at $0, so this adds
# nothing it already counted.
backfill_block_cost() {
jq -r --argjson a "$1" --argjson b "$2" '
[ (.backfill.hour // {}) | to_entries[]
| select((.key | tonumber) >= $a and (.key | tonumber) < $b)
| .value[] ] | add // 0
' <</dev/null || printf '0'
}
# Fetched once per slow tick by the loop and read from here, so the three
# cache reads and the merge above happen once rather than once per caller.
RECENT_JSON=""
recent_sections() { printf '%s' "$RECENT_JSON"; }
# Models ccusage could not price, one id per line. `--offline` prices from
# the table bundled with the installed ccusage release, and a model released
# after it is costed at exactly $0 with its tokens still counted -- no error,
# no warning. On 2026-09-23 that dropped ~$32 of Claude Opus 5.5 from Today
# while Today rendered a plausible $14.62. Tokens with no cost is the
# signature; nothing that really ran is free.
unpriced_models() {
jq -r '[.daily[]?.modelBreakdowns[]?
| select((.cost // 0) == 0
and ((.inputTokens // 0) + (.outputTokens // 0)
+ (.cacheCreationTokens // 0) + (.cacheReadTokens // 0)) > 0)
| .modelName] | unique | .[]' <</dev/null
}
# The unpriced models' share of a daily report's usage, in percent, weighted
# by the ratios every Claude model's price list shares (output 5x input, cache
# writes 1.25x, cache reads 0.1x), so no price for the model itself is needed.
# A model that is only a sliver of the day (a one-line test of a new alias)
# must not blank the whole Today figure the way a day's main model would.
unpriced_share_pct() {
jq -r 'def w: (.inputTokens // 0) + 5 * (.outputTokens // 0)
+ 1.25 * (.cacheCreationTokens // 0) + 0.1 * (.cacheReadTokens // 0);
[.daily[]?.modelBreakdowns[]?] as $all
| ([$all[] | w] | add // 0) as $tot
| ([$all[] | select((.cost // 0) == 0) | w] | add // 0) as $un
| if $tot > 0 then ($un * 100 / $tot) else 0 end' <</dev/null || echo 100
}
# This week's spend out of the weekly report, without knowing which day the
# tool calls the start of a week.
#
# The previous version computed the Monday and asked for that key exactly,
# on the strength of a comment claiming Mondays were "verified against five
# consecutive `ccusage weekly` periods". They are Sundays. On a Tuesday the
# panel therefore asked for a key no row carried, the `// 0` fallback caught
# the miss, and the line rendered a confident `week: $0` on a week that had
# several days of usage in it -- next to a `3 days:` line listing that usage.
# The same silent shape as the `.period` rename in check Q, and it survived
# for the same reason: the only weekly fixture in the suite was keyed to a
# Monday, so the test agreed with the bug.
#
# Selecting by the tool's own convention instead of ours: a 7-day window
# ending today contains exactly ONE week-start under any convention, so the
# latest row inside it is the current week whether the tool starts on Sunday,
# Monday, or anything else -- and a week with no usage still has no row in
# that window, so it still reads $0 rather than silently reporting the
# previous week the way `[-1]` would.
current_week_cost() { # $1 = recent_sections payload
local floor today cost
today=$(panel_date +%Y-%m-%d)
floor=$(panel_date -v-6d +%Y-%m-%d 2>/dev/null || panel_date -d '6 days ago' +%Y-%m-%d)
# ISO dates sort correctly as strings, so no date parsing is needed in jq.
cost=$(jq -r --arg f "$floor" --arg t "$today" '
[ .weekly[]? | select(.period >= $f and .period <= $t) ]
| sort_by(.period) | last | .totalCost // 0
' <</dev/null)
# `A || B && C` would return 1 on the happy path here, which is a landmine
# for any caller that ever runs under `set -e`. Spelled out instead.
if [ -z "$cost" ] || [ "$cost" = "null" ]; then cost=0; fi
printf '%s' "$cost"
}
# The full session report, fetched once and sliced locally. Every windowed
# `session --since/--until` variant the panel used to ask for (7-day
# baseline, previous 7-day baseline, today's sessions) is the SAME report
# with a date filter applied -- and since each ccusage invocation reparses
# the whole corpus, asking four times cost four full scans for four views of
# one dataset. Verified equivalent: a windowed `session --since` returns the same
# session set as filtering this payload does, and the computed averages
# match exactly.
# `claude session` returns its array under `.sessions`; the all-agent report
# used `.session`. Normalised here to the singular every caller already
# reads, rather than renaming it in each of them.
all_sessions() {
# Same shape drift as the daily report above: the scoped session report
# nests under `.sessions`, names the id `sessionId` rather than `period`,
# and puts `lastActivity` at the top level instead of under `metadata`.
ccusage_cached claude session --json --offline \
| jq -c '{session: [ (.sessions // .session // [])[]
| .period = (.sessionId // .period)
| .metadata = ((.metadata // {}) + {lastActivity: (.lastActivity // .metadata.lastActivity)}) ]}' 2>/dev/null \
| { read -r s; backfill_sessions "$s"; }
}
# $1 = all_sessions payload, $2 = since (YYYY-MM-DD, day-inclusive),
# $3 = until (YYYY-MM-DD, day-EXCLUSIVE) or "" for no upper bound.
# Emits {session:[...]} so callers keep reading `.session[]` unchanged.
#
# The until bound is day-EXCLUSIVE because that is what ccusage does, which
# is NOT what it does for `daily --until` (inclusive there -- see
# daily_window below). Established by testing four windows whose end date
# actually had sessions on it: ccusage's own count matched day-exclusive
# filtering in every one, and never the day-inclusive count. Guessing
# symmetry here would have quietly shifted the previous-7-day baseline and
# with it the trend colours.
#
# lastActivity is a full ISO timestamp ("YYYY-MM-DDTHH:MM:SS.sssZ"), so the
# comparison is on its [0:10] date prefix -- a bare string compare against a
# plain "YYYY-MM-DD" bound would exclude every session ON that date by accident.
sessions_window() {
jq -c --arg a "$2" --arg b "$3" '
{ session: [ .session[]?
| select($a == "" or (.metadata.lastActivity[0:10]) >= $a)
| select($b == "" or (.metadata.lastActivity[0:10]) < $b) ] }
' <</dev/null
}
# $1 = recent_sections payload, $2 = since (YYYY-MM-DD),
# $3 = until (YYYY-MM-DD, day-INCLUSIVE) or "" for no upper bound.
# Emits {daily:[...], totals:{totalCost}} -- the two shapes the daily-window
# callers read. Inclusive upper bound verified against a fixed
# historical window, which totals identically derived and direct.
daily_window() {
jq -c --arg a "$2" --arg b "$3" '
[ .daily[]? | select(.period >= $a) | select($b == "" or .period <= $b) ] as $rows |
{ daily: $rows, totals: { totalCost: ([ $rows[].totalCost ] | add // 0) } }
' <</dev/null
}
# $1 = a recent_sections payload. Rebuilds the exact shape that
# `daily --json --last 1` returned -- {daily:[row], totals:{...}} -- so both
# downstream call sites keep working untouched (one reads .totals.totalCost,
# the other also reads .daily[0].modelBreakdowns).
#
# Selects TODAY's row BY DATE rather than taking the most recent row that
# exists. ccusage omits zero-usage days from the report entirely (real
# multi-day gaps do occur in practice), so `--last 1` on a
# morning before the first turn returned YESTERDAY's figures under a line
# labelled "today:". No row means no usage today, which is exactly what the
# callers' empty-`.daily` branch already prints.
today_daily_shape() {
jq -c --arg t "$(panel_date +%Y-%m-%d)" '
[ .daily[]? | select(.period == $t) ] as $rows |
{ daily: $rows,
totals: ( ($rows[0] // {}) |
{ totalCost: (.totalCost // 0),
totalTokens: (.totalTokens // 0),
inputTokens: (.inputTokens // 0),
outputTokens: (.outputTokens // 0),
cacheCreationTokens: (.cacheCreationTokens // 0),
cacheReadTokens: (.cacheReadTokens // 0) } ) }
' <</dev/null
}
# ---- transcript-scan cache, keyed by mtime+size not TTL ----
# Both python parses below read the WHOLE transcript file every refresh,
# fine for a small session, but for a multi-million-token one (see the
# 4.66M-token session that motivated this) that's a full multi-MB re-parse
# every 5-10s, per open panel, for as long as the pane stays open, most of
# it spent re-deriving a result that hasn't changed because nothing new was
# written since the last refresh (the common case: reading/typing between
# turns, not mid-generation). Unlike ccusage_cached()'s TTL, staleness here
# has an exact signal, the file's own mtime+size, so cache on THAT: a
# turn landing invalidates it immediately, and an idle pane pays for the
# parse exactly once until the next one lands, not every 5-10s regardless.
transcript_stamp() {
local path="$1" m s
m=$(stat -f %m "$path" 2>/dev/null || stat -c %Y "$path" 2>/dev/null || echo 0)
s=$(stat -f %z "$path" 2>/dev/null || stat -c %s "$path" 2>/dev/null || echo 0)
printf '%s:%s' "$m" "$s"
}
# $1 = session id, $2 = today's date (YYYY-MM-DD). Prints that session's
# token count for today.
#
# The underlying `ccusage session --json -i ` parses EVERY transcript
# under ~/.claude/projects to answer -- the `-i` only filters the OUTPUT, it
# does not narrow the scan. So the unconditional fan-out that used to live at
# the "Top Sessions Today" block re-scanned the entire corpus once per
# active session, concurrently, every refresh: 8 sessions today meant 8 full
# scans every 10s, each pegging a core. That was the single largest CPU cost
# in this panel by a wide margin, and ccusage_cached() could not help --
# every sid is a DIFFERENT cache key, so the TTL and the mkdir-lock only
# dedupe a query against itself, never the eight against each other.
#
# A session's today-slice can only change when that session's own transcript
# is written to, which is an exact signal rather than a guess -- so key on
# mtime+size like session_identity_cached() above instead of a TTL. An idle
# session then pays nothing at all, and an ordinary tick rescans only the one
# session actually being typed into. $today is folded into the stamp so the
# slice invalidates by itself at midnight rather than serving yesterday's.
session_today_tokens_cached() {
local sid="$1" today="$2" path key cache_file stamp cached out
path=""
for c in "$HOME"/.claude/projects/*/"$sid".jsonl; do
[ -f "$c" ] && { path="$c"; break; }
done
[ -n "$path" ] || return
key=$(printf '%s' "$sid" | shasum -a 256 | cut -c1-16)
cache_file="$CCUSAGE_CACHE_DIR/todaytok-$key.tsv"
stamp=$(transcript_stamp "$path")
if [ -f "$cache_file" ]; then
IFS=$'\t' read -r cached _ /dev/null | jq -r --arg d "$today" '
[.entries[]? | select(.timestamp | startswith($d)) |
.inputTokens+.outputTokens+.cacheCreationTokens+.cacheReadTokens] | add // 0
' 2>/dev/null)
# Only a real answer gets cached -- caching "" on a failed/interrupted
# fetch would pin the empty result until the next turn landed.
[ -n "$out" ] || return
printf '%s\t%s\n' "$stamp:$today" "$out" > "$cache_file.$$.tmp" && mv "$cache_file.$$.tmp" "$cache_file"
printf '%s' "$out"
}
# $1 = transcript path. Prints the cached "sid\tmodel\tlabel\tfolder\tepoch"
# tsv line, calling the identity-scan python only when path+mtime+size
# changed since the last call (by any panel).
session_identity_cached() {
local path="$1" key cache_file stamp cached
key=$(printf '%s' "$path" | shasum -a 256 | cut -c1-16)
cache_file="$CCUSAGE_CACHE_DIR/sessid-$key.tsv"
stamp=$(transcript_stamp "$path")
if [ -f "$cache_file" ]; then
IFS=$'\t' read -r cached _ < "$cache_file"
if [ "$cached" = "$stamp" ]; then
cut -f2- "$cache_file"
return
fi
fi
local out
out=$(python3 - "$path" <<'PYEOF'
import datetime, json, os, sys
path = sys.argv[1]
sid = os.path.basename(path).removesuffix(".jsonl")
model = "unknown"
folder = ""
first_ts = None
try:
with open(path) as f:
for line in f:
try:
d = json.loads(line)
except json.JSONDecodeError:
continue
if not folder and d.get("cwd"):
folder = os.path.basename(d["cwd"])
if not first_ts and d.get("timestamp"):
first_ts = d["timestamp"]
if d.get("type") == "assistant":
m = d.get("message", {}).get("model")
# "" is Claude Code's own placeholder for an API
# error it logged as a reply, not a model that served.
if m and m != "":
model = m
except OSError:
pass
rest = model.removeprefix("claude-")
parts = rest.split("-")
name = parts[0].capitalize()
nums = parts[1:]
if len(nums) >= 2:
label = f"{name} {nums[0]}.{nums[1]}"
elif len(nums) == 1:
label = f"{name} {nums[0]}"
else:
label = name
epoch = 0
if first_ts:
epoch = int(datetime.datetime.fromisoformat(first_ts.replace("Z", "+00:00")).timestamp())
print(f"{sid}\t{model}\t{label}\t{folder}\t{epoch}")
PYEOF
)
printf '%s\t%s\n' "$stamp" "$out" > "$cache_file.$$.tmp" && mv "$cache_file.$$.tmp" "$cache_file"
printf '%s' "$out"
}
# $1 = transcript path, $2... = the same color/threshold args the table
# always took MINUS burn_color/burn_str -- those are a live every-refresh
# figure independent of this file's contents, so the caller prints that
# header line itself and only asks for the (cacheable) table body here.
# Same mtime+size cache as session_identity_cached() above, and for the
# same reason: this used to re-read and re-price the ENTIRE transcript on
# every single refresh, which for a multi-million-token session is real,
# repeated CPU for a result that's usually unchanged since the last frame.
turn_table_cached() {
local path="$1"; shift
local key cache_file stamp cached
# The script's own mtime is in the key: a new price table (or any parser
# change) re-prices turns already cached, rather than waiting for the
# session's next reply.
key=$(printf '%s' "$path $* $(stat -f %m "${BASH_SOURCE[0]}" 2>/dev/null)" | shasum -a 256 | cut -c1-16)
cache_file="$CCUSAGE_CACHE_DIR/turns-$key.out"
stamp=$(transcript_stamp "$path")
if [ -f "$cache_file" ]; then
IFS=$'\t' read -r cached < "$cache_file"
if [ "$cached" = "$stamp" ]; then
tail -n +2 "$cache_file"
return
fi
fi
{
printf '%s\n' "$stamp"
python3 - "$path" "$@" < (input $/1M, output $/1M)
"claude-sonnet-5-5": (2.00, 10.00),
"claude-sonnet-5": (2.00, 10.00),
"claude-opus-5-5": (4.00, 20.00),
"claude-opus-5": (5.00, 25.00),
"claude-haiku-4-5": (1.00, 5.00),
# Claude Code logs Haiku by its dated id, not the alias above.
"claude-haiku-4-5-20251001": (1.00, 5.00),
"claude-sonnet-4-6": (3.00, 15.00),
"claude-opus-4-8": (5.00, 25.00),
"claude-opus-4-7": (5.00, 25.00),
"claude-opus-4-6": (5.00, 25.00),
"claude-fable-5": (10.00, 50.00),
"claude-fable-5-1": (10.00, 50.00),
"claude-mythos-5": (10.00, 50.00),
"claude-mythos-5-1": (10.00, 50.00),
}
# Cache reads are 0.1x input on most models but not all: Opus 5.5 reads at
# $0.20 (0.05x) and Fable 5.1 at $0.25 (0.025x). Pricing those at 0.1x
# overstated a cache-heavy Opus 5.5 session by ~50%. $/1M, overrides only.
CACHE_READ_PRICE = {
"claude-opus-5-5": 0.20,
"claude-fable-5-1": 0.25,
}
CACHE_READ_MULT, CACHE_WRITE_5M_MULT, CACHE_WRITE_1H_MULT = 0.1, 1.25, 2.0
def model_label(model_id):
# A secondary-served id is not an Anthropic one and must not be forced
# through the "claude---" shape below, which turns
# "zai-org/GLM-5.3" into the nonsense "Zai org/GLM.5.3". Show the bare
# model, dropping the vendor path segment: "zai-org/GLM-5.3" -> "GLM-5.3".
if not model_id.startswith("claude-"):
return model_id.rsplit("/", 1)[-1]
rest = model_id.removeprefix("claude-")
parts = rest.split("-")
name = parts[0].capitalize()
nums = parts[1:]
if len(nums) >= 2:
return f"{name} {nums[0]}.{nums[1]}"
if len(nums) == 1:
return f"{name} {nums[0]}"
return name
def fmt_k(n):
if abs(n) >= 1000:
return f"{n/1000:.0f}k"
return str(n)
# The ONLY copy of this rule. It used to be mirrored in the bash panel and
# "kept in sync manually", with both computing a denominator for the same
# displayed percentage; the window now travels out of here in the metadata
# line instead, so the row colours below and the Context Usage line above
# cannot be divided by different numbers.
# Every current-generation model is 1M except Haiku 4.5 (200k), see the
# bash version's comment for why this used to be a Sonnet-5/Fable-5-only
# allowlist and why that went stale.
def context_window_size(model_id):
if model_id not in PRICES:
return 0
size = 200_000 if model_id.startswith("claude-haiku-4-5") else 1_000_000
if size == 1_000_000 and os.environ.get("CLAUDE_CODE_DISABLE_1M_CONTEXT", "0") == "1":
size = 200_000
return size
# Same green/yellow/red/purple bands as the "Context Usage" line above the
# table (CTX_YELLOW/RED/PURPLE), so a turn whose running total is already
# eating most of the window reads the same way here as it does up there.
def ctx_pct_color(pct):
if pct > ctx_purple_t:
return col_purple
if pct > ctx_red_t:
return col_cost
if pct > ctx_yellow_t:
return col_mid_tier
return col_input
# RAG against this session's own average turn-over-turn growth (same
# baseline-ratio shape as tier_color() in bash: 1.5x avg -> yellow, 2x avg ->
# red) so a turn that blew up context relative to this session's own pattern
# stands out, rather than against an absolute token count that means
# something different in a 200k vs 1M window.
def delta_color(d, avg):
if avg <= 0 or d avg * delta_red_mult:
return col_cost
if d > avg * delta_yellow_mult:
return col_mid_tier
return col_input
# Ranks the two independent per-cell colors above (context %, delta vs
# session average) onto one scale so a row can be colored as a whole by
# whichever signal is worse, instead of only the one cell that tripped it,
# a row that's fine on context but has an outsized delta (or vice versa)
# should still read as elevated at a glance, not just in one column.
def severity_rank(color):
if color == col_purple:
return 3
if color == col_cost:
return 2
if color == col_mid_tier:
return 1
return 0
# --- which turns did claude-burst actually send to the secondary? ----------
#
# The transcript cannot answer this. When an overflow window is active the
# gateway translates the reply from an openai-compatible secondary back into
# Anthropic's wire shape and, deliberately (see ServeModeler's doc comment in
# claude-burst's internal/router/provider.go), echoes back the model Claude
# Code ASKED for rather than the one that served -- Claude Code must see the
# id it requested. So ~/.claude/projects/*.jsonl records "claude-opus-5" for
# a turn GLM actually answered, and this table priced it at Opus rates: a
# confident dollar figure for a request Anthropic never billed.
#
# The gateway's own metrics.jsonl has the truth (slot, real model, tokens),
# and its timestamps match the transcript's to within milliseconds because
# both are written at the end of the same response. Match on time, and
# require the output-token count to agree as well so a coincidental
# same-second primary turn can never be mislabelled.
BURST_METRICS = os.path.expanduser("~/.config/claude-burst/metrics.jsonl")
MATCH_WINDOW_S = 3.0
def parse_iso(t):
if not t:
return None
try:
# Python's fromisoformat rejects the trailing "Z" the transcript uses.
return datetime.fromisoformat(t.replace("Z", "+00:00")).timestamp()
except ValueError:
return None
def load_secondary_events():
"""[(epoch, model, output_tokens, input_tokens, usd, route)] for
secondary-served requests."""
out = []
try:
with open(BURST_METRICS) as f:
for line in f:
try:
e = json.loads(line)
except json.JSONDecodeError:
continue
if e.get("slot") != "secondary":
continue
# Only a hop that answered served a turn. A failed or
# cancelled one (499, no tokens) used to match whatever
# primary turn ended within 3s and relabel it "GLM ... ?"
# (2026-10-04 17:16, an Opus turn shown as GLM-5.3).
st = e.get("http_status") or 0
if st >= 400 or e.get("output_tokens") is None:
continue
ts = parse_iso(e.get("time"))
if ts is None or not e.get("model"):
continue
# api_equivalent_usd is the gateway's own price for the hop,
# from its config's per-model rates (GLM-5.3 on Together:
# $1.40/$4.40). Absent on events older than that field.
out.append((ts, e["model"], e.get("output_tokens"), e.get("input_tokens"),
e.get("api_equivalent_usd"), e.get("route")))
except OSError:
return []
return out
SECONDARY_EVENTS = load_secondary_events()
# --- claude-burst proxy-side compaction markers ----------------------------
#
# When the gateway compacts a session it summarises the history in a
# background call the transcript never sees, then swaps the summary in at the
# next prompt. From the transcript alone that reads as context falling off a
# cliff for no reason. metrics.jsonl records both halves under the session id
# (the transcript's own file name): the summary call (note "compaction
# summary") and every request that carried the swap (compacted_messages).
# Both are stamped at the END of their request, so the start is time minus
# duration: that places "Started" at the prompt it ran beside, "Pending" at
# the moment the summary was ready (it waits for the next plain prompt, so a
# long turn can run for minutes above the threshold with nothing else to
# show), and "Finished" just before the first turn that was actually sent
# compacted.
SESSION_ID = os.path.basename(path).removesuffix(".jsonl")
def load_compaction_markers():
"""[(epoch, kind, summary_usd)] in time order; kind is started/pending/finished."""
out, last_summary, last_compacted = [], None, 0
try:
with open(BURST_METRICS) as f:
for line in f:
if SESSION_ID not in line:
continue
try:
e = json.loads(line)
except json.JSONDecodeError:
continue
if e.get("session_id") != SESSION_ID:
continue
ts = parse_iso(e.get("time"))
if ts is None:
continue
began = ts - (e.get("duration_ms") or 0) / 1000
if e.get("note") == "compaction summary":
out.append((began, "started", None))
# A failed summary never swaps in: nothing is pending.
if (e.get("http_status") or 200) last_turn_ts)
def secondary_event_for(turn_ts, out_tok):
"""(model, input_tokens, usd, route) for the secondary hop that served
this turn, or None if it went to primary."""
if turn_ts is None:
return None
best, best_gap = None, MATCH_WINDOW_S
for ts, model, ev_out, ev_in, usd, route in SECONDARY_EVENTS:
gap = abs(ts - turn_ts)
if gap > best_gap:
continue
# Token agreement is what makes this safe rather than merely likely.
if ev_out is not None and out_tok is not None and ev_out != out_tok:
continue
best, best_gap = (model, ev_in, usd, route), gap
return best
turns, seen = [], set()
try:
with open(path) as f:
lines = f.readlines()
except OSError:
lines = []
for line in lines:
try:
d = json.loads(line)
except json.JSONDecodeError:
continue
if d.get("type") != "assistant":
continue
msg = d.get("message", {})
usage = msg.get("usage")
mid = msg.get("id")
if not usage or not mid or mid in seen:
continue
seen.add(mid)
model = msg.get("model", "unknown")
# Claude Code logs an API error ("Can't reach the API server") as an
# assistant message from model "" with all-zero usage. It is
# not a turn, and counting it as one flagged it unpriced, which blanked
# Session and Burn for the rest of the session over a network blip.
if model == "":
continue
turn_ts = parse_iso(d.get("timestamp"))
in_tok = usage.get("input_tokens", 0)
out_tok = usage.get("output_tokens", 0)
cr_tok = usage.get("cache_read_input_tokens", 0)
cc_tok = usage.get("cache_creation_input_tokens", 0)
cc = usage.get("cache_creation") or {}
# See the same fix in the hourly-bucket PYEOF block above: no nested
# breakdown means the default 5-minute TTL was used, not the 1h beta.
if cc:
cw_1h = cc.get("ephemeral_1h_input_tokens", 0)
cw_5m = cc.get("ephemeral_5m_input_tokens", 0)
else:
cw_1h = 0
cw_5m = cc_tok
total_ctx = in_tok + cr_tok + cc_tok
cache_pct = (cr_tok / total_ctx * 100) if total_ctx else 0.0
# Substitute the model that really served before pricing, not after: a
# secondary model has no entry in PRICES, and a price for it would be
# invented. Cost is reported as unknown for these instead.
ev = secondary_event_for(turn_ts, out_tok)
is_secondary = ev is not None
sec_usd, sec_route = None, None
if is_secondary:
model, ev_in, sec_usd, sec_route = ev
# Turns served before claude-burst's 2026-09-03 message_delta fix were
# recorded with "input_tokens": 0 -- the translator sent only
# output_tokens, so message_start's placeholder 0 stood. The gateway
# logged the real count either way, so prefer its figure over a zero
# the transcript never actually measured. Post-fix turns agree, and
# this line is then a no-op.
if not total_ctx and ev_in:
in_tok, total_ctx = ev_in, ev_in
# An id with no published rate gets no cost at all (None), not a guess.
# It used to be priced at a $3/$15 stand-in under a footnote, and a
# footnoted wrong number still reads as a number: Opus 5.5 ($4/$20,
# cache reads $0.20) sat in this table at the stand-in for its launch.
is_unpriced = model not in PRICES and not is_secondary
if model in PRICES:
price_in, price_out = PRICES[model]
price_cr = CACHE_READ_PRICE.get(model, price_in * CACHE_READ_MULT)
cost = (
in_tok * price_in
+ out_tok * price_out
+ cr_tok * price_cr
+ cw_1h * price_in * CACHE_WRITE_1H_MULT
+ cw_5m * price_in * CACHE_WRITE_5M_MULT
) / 1_000_000
elif is_secondary and sec_usd is not None:
# The secondary vendor's bill, as the gateway priced it. Shown on the
# row but kept out of the session total below, which is Anthropic
# spend only.
cost = float(sec_usd)
else:
cost = None
turns.append((model_label(model), total_ctx, cc_tok, cache_pct, cost, model, is_secondary, is_unpriced, sec_route, turn_ts))
total_n = len(turns)
shown = turns[-max_rows:]
# Averaged over primary turns only. A secondary turn reports no cache at all,
# so its whole prompt lands in the delta column; mixing those in inflates the
# baseline and suppresses the very spikes delta_color exists to flag.
primary_turns = [t for t in turns if not t[6]]
avg_delta = (sum(t[2] for t in primary_turns) / len(primary_turns)) if primary_turns else 0.0
# Machine-readable first line, stripped by the shell before the table
# reaches the screen. Both figures were computed above as a by-product of
# pricing the turns, and both were previously bought a SECOND time from
# `ccusage statusline` -- 2.11 CPU-s, the most expensive query this panel
# made, and the only one whose cache key carries a session id, so it could
# not be shared between panels and cost that much again for every extra
# Claude Code session running.
# The session total is left EMPTY when any primary turn is unpriced: a sum
# that silently drops those turns is a wrong number, and the panel renders
# an empty figure as "--". Secondary turns were never Anthropic spend, so
# they do not blank it.
# The gateway's compaction summary calls are Anthropic spend too, billed to
# this session, and appear nowhere in the transcript; add them.
summary_usd = sum(m[2] or 0 for m in COMPACTION_MARKERS if m[1] == "finished")
sess_total = ("" if any(t[7] for t in turns)
else f"{sum(t[4] for t in turns if t[4] is not None and not t[6]) + summary_usd:.6f}")
print(f"#META\t{sess_total}\t{turns[-1][1] if turns else 0}"
f"\t{context_window_size(turns[-1][5]) if turns else 0}"
f"\t{int(compaction_supersedes(COMPACTION_MARKERS, turns[-1][9] if turns else None))}")
# The same turns as numbers, for the Claude Code mod's graphs: the newest 300,
# each [turn number, context, context written (the delta), cache hit %, cost
# or null, epoch or null, served by a secondary], and the compaction markers
# as [epoch, kind, usd or null]. One line, stripped by the shell like #META.
series_from = max(0, total_n - 300)
print("#SERIES\t" + json.dumps({
"turns": [[series_from + k + 1, t[1], t[2], round(t[3], 1),
None if t[4] is None else round(t[4], 6),
None if t[9] is None else int(t[9]), bool(t[6])]
for k, t in enumerate(turns[series_from:])],
"markers": [[int(m[0]), m[1], m[2]] for m in COMPACTION_MARKERS],
"avg_delta": round(avg_delta),
}, separators=(",", ":")))
turn_h =f"{col_turn}{'Turn':<5}{c_reset}"
model_h = f"{col_model}{'Model':12}{c_reset}"
cache_h = f"{col_cache}{'Cache':>6}{c_reset}"
cost_h = f"{col_cost}{'Cost':>8}{c_reset}"
print(f" {turn_h}{model_h}{input_h}{cache_h}{cost_h}")
if shown:
start_idx = total_n - len(shown) + 1
# Newest turn first, this table sits at a fixed position above the
# sections below it, so the most recent activity would otherwise be the
# one row that scrolls out of view first as the session grows.
saw_secondary, secondary_routes = False, set()
# Each compaction marker is drawn above the first turn that began after
# it, i.e. between the two turns it happened between. Markers older than
# the oldest shown turn are off the table and dropped; ones newer than
# the newest turn (a summary running right now) go on top.
first_shown_ts = shown[0][9]
markers_before = {}
for m in COMPACTION_MARKERS:
if first_shown_ts is not None and m[0] m[0]), len(shown))
markers_before.setdefault(j, []).append(m)
# A Pending with its Finished in the same gap is spent: no turn ran while
# the summary waited, so it says nothing the Finished does not, and drawn
# newest-first it sat BELOW the Finished still saying "(next prompt)",
# which reads as the two events in the wrong order.
for j, ms in markers_before.items():
markers_before[j] = [m for k, m in enumerate(ms)
if not (m[1] == "pending" and any(n[1] == "finished" for n in ms[k + 1:]))]
def print_markers(j):
for _, kind, usd in reversed(markers_before.get(j, [])):
if kind == "started":
print(f" {col_mid_tier}*** Async Compaction Started ***{c_reset}")
elif kind == "pending":
print(f" {col_cache}*** Async Compaction Pending (next prompt) ***{c_reset}")
else:
cost_note = "" if usd is None else f" (${usd:.2f})"
print(f" {col_input}*** Async Compaction Finished{cost_note} ***{c_reset}")
print_markers(len(shown))
for i in reversed(range(len(shown))):
label, total_ctx, delta, cache_pct, cost, model, is_secondary, is_unpriced, route, _ = shown[i]
turn_no = start_idx + i
# The Δ is normally what this turn added (its cache write). When the
# context SHRANK, a compaction happened (Claude Code's or the
# gateway's) and the useful number is how much went: shown negative,
# in green, and never allowed to colour the row as a spike, since the
# cache write that follows a compaction is the expected cost of it.
idx = start_idx - 1 + i
prev_ctx = turns[idx - 1][1] if idx > 0 else 0
shrank = prev_ctx and total_ctx 9 else label + "*"
# Everything downstream of here is an Anthropic-shaped inference
# that does not survive the trip to a third-party model:
# - cost: the gateway's own figure for the hop when it logged
# one, else "?" -- never an Anthropic rate
# - cache: the secondary reports no prompt caching at all, so a
# 0% here means "not applicable", not "cache missed" -- and
# the cache bands would paint it purple, an alarm for a
# condition that cannot occur
# - context %: the window size is unknown, so ctx_pct is noise
sec_cost = "?" if cost is None else "$" + format(cost, ".2f")
print(f" {col_purple}{turn_no:<5}{label:6}{sec_cost:>8}{c_reset}")
print_markers(i)
continue
win = context_window_size(model)
# 0 means the model is not in PRICES, so its window is unknown --
# see context_window_size. No denominator, no percentage; the row
# still prices and still renders, under the footnote below.
ctx_pct = (total_ctx / win * 100) if win else 0.0
# Cache hit % is the odd one out: low is bad (unlike ctx_pct/delta,
# where high is bad), so its bands run the opposite direction,
# below 95% red, below 90% purple, 95%+ reads as normal.
cache_c = col_purple if cache_pct < 90 else (col_cost if cache_pct = 2 else 0)
cost_cell = "?" if cost is None else "$" + format(cost, ".2f")
if rank > 0:
row_c = (col_input, col_mid_tier, col_cost, col_purple)[rank]
print(f" {row_c}{turn_no:<5}{label:5.0f}%{cost_cell:>8}{c_reset}")
else:
total_colored = f"{ctx_c}{total_str}{c_reset}"
delta_colored = f"{delta_c}{sign}{delta_str}{c_reset}" if shrank else f"{delta_c}{delta_str}{c_reset}"
input_cell = f"{pad}{total_colored} (+{delta_colored})" if not shrank else f"{pad}{total_colored} ({delta_colored})"
cache_cell = f"{cache_c}{cache_pct:>5.0f}%{c_reset}"
print(f" {turn_no:<5}{label:8}")
print_markers(i)
if any(t[7] for t in turns):
# Named, not hidden: a model absent from PRICES shows "?" and the
# session total is withheld. Add the id above and this line goes away.
unpriced = sorted({t[5] for t in turns if t[7]})
print(f" {c_na}? no known price for {', '.join(unpriced)}; "
f"cost not shown{c_reset}")
if saw_secondary:
# Short on purpose: the pane is ~55 columns and the old wording was
# truncated mid-word. Naming the vendor says "not Anthropic" by itself.
biller = ", ".join(sorted(secondary_routes)) or "secondary vendor"
print(f" {c_na}* via claude-burst secondary; billed by {biller}{c_reset}")
PYEOF
} > "$cache_file.$$.tmp"
if [ $? -eq 0 ] && [ -s "$cache_file.$$.tmp" ]; then
mv "$cache_file.$$.tmp" "$cache_file"
tail -n +2 "$cache_file"
else
rm -f "$cache_file.$$.tmp"
printf ' %sturn table unavailable: transcript parse failed%s\n' "$C_RED" "$C_RESET"
fi
}
# ---- this session's own figures, from the parse that already happened ---
# The turn table, this session's total cost and its current context size all
# fall out of one cached transcript parse. Read three times, computed once.
#
# This is what replaces `ccusage statusline`. That query supplied exactly two
# numbers the panel could not otherwise reach -- session cost and context
# tokens -- and a third, the model name, that it had already resolved and was
# passing INTO the query to get back out again. Today and the block figures
# were already computed independently and its versions of them ignored.
#
# Set on every FAST tick, before either builder runs, so the slow-tier
# summary and the fast-tier table read the same session from the same parse
# rather than two snapshots that can disagree on screen.
SESS_TABLE=""; SESS_COST=""; SESS_CTX=""; SESS_WIN=""; SESS_COMPACTING=""; SESS_SERIES=""
session_stats_refresh() {
SESS_TABLE=""; SESS_COST=""; SESS_CTX=""; SESS_WIN=""; SESS_COMPACTING=""; SESS_SERIES=""
[ -n "${latest:-}" ] || return 0
local out meta
out=$(turn_table_cached "$latest" "$TURN_ROWS" "$C_BOLD$C_CYAN" "$C_RESET" \
"$C_CYAN" "$C_CYAN" "$C_GREEN" "$C_BLUE" "$C_RED" "$C_YELLOW" \
"$C_MAGENTA" "$CTX_YELLOW" "$CTX_RED" "$CTX_PURPLE" \
"$TIER_YELLOW_MULT" "$TIER_RED_MULT" "$MIN_DELTA_ALERT" "$C_ELECTRIC" series)
meta=$(printf '%s\n' "$out" | head -1)
case "$meta" in
'#META'*)
SESS_COST=$(printf '%s' "$meta" | cut -f2)
SESS_CTX=$(printf '%s' "$meta" | cut -f3)
SESS_WIN=$(printf '%s' "$meta" | cut -f4)
SESS_COMPACTING=$(printf '%s' "$meta" | cut -f5)
SESS_TABLE=$(printf '%s\n' "$out" | tail -n +2)
# The turns as numbers for the mod's graphs (turn_table_cached's
# #SERIES line), when the cache entry is new enough to carry them.
case "$SESS_TABLE" in
'#SERIES'*)
SESS_SERIES=$(printf '%s\n' "$SESS_TABLE" | head -1 | cut -f2-)
SESS_TABLE=$(printf '%s\n' "$SESS_TABLE" | tail -n +2)
;;
esac
;;
*)
# A cache entry written before this line existed -- the file is keyed
# on the transcript's mtime+size, so it stays valid and stays served
# until the next turn lands. Render the table, leave the figures
# empty: an absent number shows as "--", where a wrong one would show
# as money.
SESS_TABLE="$out"
;;
esac
}
# Save the real terminal fd BEFORE the loop ever redirects fd1 through a
# command-substitution pipe, fd3 keeps pointing at the actual pane device
# no matter what fd1 becomes inside a $(...), and unlike /dev/tty it still
# works for a process with no controlling terminal at all (e.g. one
# relaunched via `nohup ... &` with stdout pointed straight at a pty device
# file) as long as that fd itself is a real tty.
exec 3>&1
# ---- swallow stray keystrokes ----
# This pane is read-only, it never reads from stdin, but the tty
# underneath it still echoes and buffers whatever gets typed into it (focus
# briefly landing here mid-launch, or a keystroke sent while Ghostty is
# still splitting the window). Left alone, that typed text sits in the
# pty's input queue and lands straight on the shell prompt the moment this
# script exits, the stray characters/garbled prompt seen whenever the
# panel dies while someone was mid-keystroke in this pane. Turn off echo
# and canonical line-buffering, drain the queue on every tick, and restore
# the tty's original settings on exit no matter how the script ends, or the
# pane's shell is left echo-less afterward, a new bug in place of the old.
#
# The drain runs INLINE, in the main shell. It used to be a background loop,
#
# ( while :; do read -r -t 0.2 -n 4096 _ 2>/dev/null; done ) &
#
# which did not work and was not cheap. POSIX says an asynchronous command
# in a shell without job control gets its stdin redirected to /dev/null, and
# a panel is `bash ccusage-panel.sh`: non-interactive, job control off. So
# that subshell was not reading the tty at all: it read instant EOF from
# /dev/null, `read` returned immediately, and the `-t 0.2` never once
# engaged. It spun a full core for the entire life of every panel, measured
# at 101 minutes of CPU across 103 minutes of wall clock, against 4 seconds
# for the panel process that owned it, while draining exactly nothing.
#
# `min 0 time 0` above makes tty reads non-blocking, so one call returns
# whatever is queued and the next returns failure on an empty queue: the
# loop drains and stops on its own. The iteration cap is only a guard
# against someone leaning on a key; the queue is drained again on exit,
# which is the moment that actually matters.
drain_stdin() {
[ -n "${ORIG_STTY:-}" ] || return 0
local i=0
while (( i /dev/null; do
i=$(( i + 1 ))
done
return 0
}
if [ -t 0 ]; then
ORIG_STTY=$(stty -g 2>/dev/null || true)
if [ -n "$ORIG_STTY" ]; then
stty -echo -icanon min 0 time 0 2>/dev/null
# Draw on the alternate screen, as less and top do, so the pane goes back
# to its shell history when the panel stops. On the main screen the last
# frame stayed in the scrollback above the prompt, and a pane reused for
# `claude` after its panel ended showed a dead panel that looked live.
# Not again on a re-exec: entering the alternate screen clears it, and
# the pane then sat blank until the new version's first frame, which
# waits on ccusage (seconds). Already there, the old frame stays up
# until the new one overwrites it.
if [ -n "${CLAUDE_PANEL_REEXEC:-}" ]; then
unset CLAUDE_PANEL_REEXEC
else
[ -t 1 ] && printf '\033[?1049h'
fi
restore_tty() {
rm -f "$PANEL_ERR_FILE"
drain_stdin
# Mouse reporting off (the close button turns it on) before leaving the
# alternate screen, or the shell left in this pane receives every click
# as escape codes. Harmless when it was never on.
[ -t 1 ] && printf '\033[?1000l\033[?1006l\033[?1004l\033[?1049l'
stty "$ORIG_STTY" 2>/dev/null
}
# INT/TERM need a handler that EXITS, not just one that tidies up. A
# trap body that returns hands control straight back to the refresh
# loop, so `kill ` was survivable: the panel caught the signal,
# restored the tty and carried on drawing -- now with echo back ON, so
# the pane both kept redrawing AND echoed anything typed into it. Two
# SIGTERMs to a pair of live panels left them running and confirmed it.
# 130 is the conventional "terminated by SIGINT" status.
on_signal() { restore_tty; exit 130; }
trap restore_tty EXIT
trap on_signal INT TERM
fi
fi
# ---- restart this panel when its own script changes ----
# A deploy rewrites ~/.local/bin/ccusage-panel.sh, but a running panel is
# already-parsed bash: it keeps drawing the old frame until someone notices
# and restarts it by hand. Since the panel is a foreground child of its
# pane's interactive shell, "by hand" means finding the pane and pressing
# up-enter -- and until that happens the panel is quietly lying about what
# the code does.
#
# So it re-execs itself. exec keeps the same pid and the same fds, so the
# pane, the tty, fd3 and PANEL_ERR_FILE (named after $$) all carry over --
# the panel does not blink, it just comes back as the new version.
#
# The two guards are both about the file being read while it is written:
#
# - stty is restored FIRST. exec does not run EXIT traps, so without this
# the terminal stays in -echo -icanon and the new process saves THAT as
# its ORIG_STTY -- after which quitting the panel restores the pane to a
# no-echo terminal. The bug outlives the panel, which is why it is worth
# more care than the restart itself.
# - `bash -n` before exec'ing. The installer writes this file with a plain
# redirect, so between truncate and last byte there is a window where the
# script on disk is a syntactically incomplete prefix of itself. Reading
# it then would exec a script that dies immediately and takes the pane's
# panel with it. On a parse failure we simply return and try again next
# tick, by which time the write has finished. (The installer now renames
# the file into place instead, which closes that window properly -- this
# stays for hand-edits and for panels installed before that change.)
#
# Deliberately NOT compared by content hash: mtime is one stat() per tick,
# and the only cost of a false positive here is one re-exec.
PANEL_SELF="${BASH_SOURCE[0]}"
case "$PANEL_SELF" in /*) ;; *) PANEL_SELF="$PWD/$PANEL_SELF" ;; esac
panel_self_mtime() {
stat -f %m "$PANEL_SELF" 2>/dev/null || stat -c %Y "$PANEL_SELF" 2>/dev/null
}
PANEL_SELF_MTIME=$(panel_self_mtime)
restart_if_changed() {
local now_mtime
now_mtime=$(panel_self_mtime)
# Empty means the file is gone or unreadable -- mid-rename, or uninstalled.
# Either way there is nothing to exec into; keep drawing.
[ -z "$now_mtime" ] && return 0
[ "$now_mtime" = "$PANEL_SELF_MTIME" ] && return 0
bash -n "$PANEL_SELF" 2>/dev/null || return 0
[ -n "${ORIG_STTY:-}" ] && stty "$ORIG_STTY" 2>/dev/null
# The new version turns mouse reporting back on if it still wants it.
[ -t 1 ] && printf '\033[?1000l\033[?1006l\033[?1004l'
export CLAUDE_PANEL_REEXEC=1
exec bash "$PANEL_SELF" "$@"
}
# ---- slow-tier fetch: the active 5h block ----
# One `ccusage blocks --active` call, on the slow tier. Everything about a
# block that moves with the clock rather than with the corpus is derived
# from its start/end epochs by block_clock_tick() below, so this only needs
# to run when the corpus itself can have changed.
refresh_active_block() {
refresh_hourly_buckets
# ---- active 5h block: fetched once here (not down in the ACTIVE BLOCK
# section) so the summary line above can show the same burn-rate-derived
# color as the detailed section, one source of truth, one API call.
block_json=$(ccusage_cached claude blocks --active --json --offline)
has_block=$(jq -r '.blocks | length // 0' <</dev/null)
if [ "${has_block:-0}" = "1" ]; then
# `localtime` before `strftime` is required, fromdateiso8601 hands back
# a UTC broken-down time and strftime formats whatever it's given with
# no zone conversion of its own, so without it these clock times render
# in UTC while everything else in the panel (the header, "This Session"
# times) is local, a 2h-off block window on any UTC+2 machine.
# startTime/endTime come out as EPOCHS as well as clock strings. The
# epochs are what let the fast tick recompute "elapsed" and "time left"
# locally every 10s without refetching the block -- see
# ccusage_query_is_gated() for why that matters (this query was the last
# one paying a full corpus scan per tick just to advance a countdown).
IFS=$'\t' read -r blk_start blk_end blk_start_epoch blk_end_epoch blk_cost blk_tokens blk_tpm blk_projCost blk_projTokens blk_models <<<"$(jq -r '
.blocks[0] |
[
(.startTime[0:19]+"Z" | fromdateiso8601 | localtime | strftime("%H:%M")),
(.endTime[0:19]+"Z" | fromdateiso8601 | localtime | strftime("%H:%M")),
(.startTime[0:19]+"Z" | fromdateiso8601),
(.endTime[0:19]+"Z" | fromdateiso8601),
.costUSD, .totalTokens,
.burnRate.tokensPerMinute,
.projection.totalCost, .projection.totalTokens,
(.models | join(", "))
] | @tsv
' <<= blk_end_epoch )); then
has_block=0
return
fi
IFS=$'\t' read -r blk_elapsed_h blk_cph blk_rem <<<"$(awk \
-v now="$now_s" -v st="$blk_start_epoch" -v en="$blk_end_epoch" -v c="$blk_cost" 'BEGIN{
h=(now-st)/3600; if(h<0.05) h=0.05
rem=int((en-now)/60); if(rem<0) rem=0
printf "%.6f\t%.2f\t%d", h, c/h, rem
}')"
burn_color=$(threshold_color "$blk_cph" "$BURN_YELLOW" "$BURN_RED")
burn_label="Normal"
[ "$burn_color" = "$C_YELLOW" ] && burn_label="Elevated"
[ "$burn_color" = "$C_RED" ] && burn_label="High"
}
# ---- adopt the session id from the handoff file ----
# Called at the top of every resolve_session tick. Sets PIN_SESSION_ID (and
# PIN_SOURCE) or leaves them alone; never prints.
#
# Two admission rules, because the same file answers two different
# questions. A handoff written around the time this panel started was
# written FOR this panel by the launcher or by this pane's SessionStart
# hook, and is simply the answer. An OLDER one is the previous session in
# this directory, which is the right answer exactly when the panel was
# restarted into a conversation already in progress (the case the
# birth-after-panel-start heuristic below structurally cannot see), and the
# wrong answer for a brand-new pane whose `claude` has not started yet. The
# transcript's own mtime separates them: a stale handoff is believed only
# while the session it names is still being written to.
#
# Note what this is NOT: the reverted "most recently modified transcript in
# this directory" heuristic, which had no identity behind it and would
# happily hand a blank pane a different pane's live conversation. This one
# starts from an id that some launcher or hook explicitly recorded for THIS
# directory and only asks whether it is still current.
# Which claude pane is this panel's? Read from the launcher's pairing file,
# lazily: the launcher can only write it AFTER it has spotted this process in
# `pgrep`, several seconds after this panel started drawing, so the first few
# ticks legitimately find nothing. Once learned it never changes.
learn_pane_pairing() {
local ctty pid rest sid
[ -n "$PANE_CLAUDE_TTY" ] && return 0
# The launcher's pairing file first, when there is one that was written for
# this process. The pid is what makes a tty safe to key on: terminal device
# names are recycled, so close this split and the next one opened in this
# window may be ttys004 again and inherit a pairing written for a different
# claude -- the same cross-pane misattribution this whole change exists to
# end, just displaced in time. `restart_if_changed` re-execs in place, which
# keeps the pid, so the one restart path this file has does not lose its
# pairing.
if [ -n "$PIN_PANE_FILE" ] && [ -r "$PIN_PANE_FILE" ]; then
IFS=$'\t' read -r ctty pid rest /dev/null || ctty=""
if [ -n "$ctty" ] && [ "$pid" = "$$" ]; then
PANE_CLAUDE_TTY="$ctty"
PIN_PANE_PIN_FILE="$PIN_TTY_DIR/$ctty"
pin_log "paired: panel tty ${PANEL_TTY:-none} -> claude tty $ctty (reading $PIN_PANE_PIN_FILE)"
return 0
fi
fi
# No pairing file, or one addressed to a process that is not this one.
# Either way it is not information, and the window can answer the same
# question without racing anything.
IFS=$'\t' read -r ctty sid < claude tty $ctty${sid:+ (argv session $sid)} (reading $PIN_PANE_PIN_FILE)"
}
# ---- which pane is this panel's, asked of the window it is in ----------
# Prints "\t" for the one claude
# pane in this panel's own terminal window, and nothing at all when there are
# none or more than one.
#
# The walk: every process in a Ghostty window descends from that window's own
# `ghostty ... -e ghostty-claude-launcher ` process -- this panel through
# login -> zsh -> ccusage-panel.sh, and its claude through
# login -> ghostty-claude-launcher -> claude. The window process is therefore
# the one thing the two panes demonstrably share, and unlike the launcher's
# pairing file it is a fact about the live process tree rather than a note
# somebody managed to write down in time. Observed on 2026-09-15: panel 55120
# and claude 54674 both walk up to ghostty 54665; panel 77229 and claude 77051
# both walk up to ghostty 77030. The first two are the pane whose panel had
# been blind since 10:29.
#
# A claude with no controlling terminal is in no pane -- `--print` review
# sections, hook one-shots, anything a build shells out to -- and is skipped
# here for the same reason the SessionStart hook writes it no pin at all.
#
# Two claude panes in one window is ambiguity, and this prints nothing rather
# than pick: the rule the rest of this file is built on is that an honest
# blank beats a confident wrong answer.
#
# Under tmux none of this holds. Every pane descends from the one tmux SERVER,
# shared by every window and every session on the machine, so the walk would
# answer "all of them"; it declines there and the launcher's pairing file (and
# `split-window`, which does not race) stays the channel.
window_claude_pane() {
[ -n "${TMUX:-}" ] && return 1
panel_ps | awk -v me="$$" '
# The outermost ancestor below pid 1 -- the terminal-emulator process for
# one window. Iteration-capped because a walk over a table read at two
# different instants can, in principle, close a cycle.
function windowof(p, n, up) {
n = 0
while ((p in P) && n++ < 64) {
up = P[p]
if (up + 0 <= 1) return p
p = up
}
return ""
}
{
cmd = ""
for (i = 4; i 4 ? " " : "") $i
P[$1] = $2; T[$1] = $3; C[$1] = cmd
}
END {
win = windowof(me)
if (win == "") exit 1
for (p in C) {
if (T[p] == "??" || T[p] == "") continue
# `claude` as its own argv word: a path ending in it, or the bare
# name. Not `ghostty-claude-launcher`, which is in every one of these
# windows and is not a session.
if (C[p] !~ /(^|\/| )claude( |$)/) continue
if (windowof(p) != win) continue
sid = ""
if (match(C[p], /--session-id[ =][0-9a-f-]+/))
sid = substr(C[p], RSTART + 13, RLENGTH - 13)
# `caffeinate -i claude --session-id X` is the same pane as the claude
# it wraps, so key on the tty and keep whichever copy names the id.
if (!(T[p] in seen) || sid != "") seen[T[p]] = sid
}
n = 0
for (t in seen) { n++; one_t = t; one_s = seen[t] }
if (n != 1) exit 1
printf "%s\t%s\n", one_t, one_s
}'
}
# ---- is the session a pin names still running? -------------------------
# Not "is its transcript being written to", which is the question
# PIN_DEAD_SECS asks and a different question with a different answer. An
# interactive session nobody has typed into for half an hour has a cold
# transcript and a perfectly live `claude`; a review section that finished
# has a cold transcript and no process at all. Only the second one is over.
#
# Two ways to be alive, either sufficient:
#
# * the id is on a live process's own command line. The launcher always
# passes `--session-id`, so this is the usual answer, and it is exact.
# * a tty pin names it and that pane still has a claude in it. This is what
# covers the session ids argv cannot know: a /clear or a --resume gives
# the same process a new id, and only the hook and the pin see it.
#
# Absence of both is the evidence for release. It is not proof -- a claude
# started by hand, with no --session-id and no hook, is alive and invisible
# here -- which is why this only ever GUARDS a release that the transcript
# has already been cold for half an hour to earn.
session_is_live() { # $1 = session id
local sid="$1" f pinned
[ -n "$sid" ] || return 1
is_uuid "$sid" || return 1
if panel_ps | awk -v sid="$sid" '
index($0, "--session-id " sid) || index($0, "--session-id=" sid) { found = 1 }
END { exit !found }'; then
return 0
fi
for f in "$PIN_TTY_DIR"/*; do
[ -f "$f" ] || continue
IFS=$'\t' read -r pinned _ /dev/null || continue
[ "$pinned" = "$sid" ] || continue
tty_has_claude "${f##*/}" && return 0
done
return 1
}
# Is there a live claude in this terminal? The tty is the pane, so this is
# "is that pane still running a session", and the tty pin is what says which.
tty_has_claude() { # $1 = tty name, as `ps -o tty=` prints it
local t="$1"
[ -n "$t" ] || return 1
case "$t" in ''|'??') return 1 ;; esac
panel_ps | awk -v want="$t" '
{
cmd = ""
for (i = 4; i 4 ? " " : "") $i
if ($3 == want && cmd ~ /(^|\/| )claude( |$)/) found = 1
}
END { exit !found }'
}
# ---- stop believing a pin whose session is over ----
# Called once per tick, immediately before adoption, so a released pin can be
# replaced on the same tick it is dropped.
#
# Pane pins are exempt: their key IS the pane, so a quiet transcript there
# means the person at that keyboard is reading rather than typing, and there
# is nothing better to replace it with. The two sources this does apply to
# are the ones that only ever inferred this pane's session, an argv pin
# predicted by the launcher before the session existed, and a directory-keyed
# handoff that any other session in the repo can overwrite.
release_dead_pin() {
local tsc age
[ -n "$PIN_SESSION_ID" ] || return 0
[ "$PIN_SOURCE" = "pane" ] && return 0
tsc="$project_dir/$PIN_SESSION_ID.jsonl"
# No transcript at all is a different condition with a different answer
# (the grace period in resolve_session); this is only about one that
# exists and has gone cold.
[ -f "$tsc" ] || return 0
age=$(( $(panel_now) - $(stat -f %m "$tsc" 2>/dev/null || stat -c %Y "$tsc" 2>/dev/null || echo 0) ))
(( age > PIN_DEAD_SECS )) || return 0
# Cold is not over. A transcript stops growing the moment its session stops
# being typed into, so this timer fires on an idle pane exactly as it fires
# on a finished one, and half an hour of reading is an ordinary way to spend
# a morning. On 2026-09-15 the two unpaired panels in this repo dropped a
# live session at 10:29:13 for having been quiet since 09:59, went blank
# through "no active Claude Code session found" for eighteen minutes, and
# then adopted a session from a DIFFERENT pane -- the misattribution this
# release was added to prevent, caused by the release itself. `claude` pid
# 54674 was running the whole time and is still running now.
#
# So ask the process table before dropping anything. A pin whose claude is
# alive is kept, and the release is left for the case it was written for: a
# session that has ended.
if session_is_live "$PIN_SESSION_ID"; then
if [ "$PIN_LIVE_MEMO" != "$PIN_SESSION_ID" ]; then
PIN_LIVE_MEMO="$PIN_SESSION_ID"
pin_log "keeping $PIN_SOURCE pin '$PIN_SESSION_ID': its transcript has been quiet for ${age}s (limit ${PIN_DEAD_SECS}s) but its session is still running"
fi
return 0
fi
PIN_LIVE_MEMO=""
pin_log "releasing $PIN_SOURCE pin '$PIN_SESSION_ID': its transcript has not been written to for ${age}s (limit ${PIN_DEAD_SECS}s) and no process is running it"
PIN_RELEASED_SID="$PIN_SESSION_ID"
PIN_SESSION_ID=""
PIN_SOURCE=""
}
adopt_handoff_pin() {
local sid written written_raw age tsc now lone
# An argv pin is the caller being explicit; do not second-guess it until
# resolve_session has given up on it and cleared PIN_SOURCE.
[ "$PIN_SOURCE" = "argv" ] && return 0
learn_pane_pairing
# A pane-scoped pin needs none of the freshness reasoning below. That
# reasoning exists only to guess whether a directory-keyed pin was written
# for THIS pane; here the key IS the pane, so whatever is in the file is
# this pane's session by construction, including a /clear or a --resume
# that hands the same pane a new id hours in, which the directory-keyed
# path can only accept by also accepting every other pane's new id.
if [ -n "$PIN_PANE_PIN_FILE" ] && [ -r "$PIN_PANE_PIN_FILE" ]; then
IFS=$'\t' read -r sid written /dev/null || return 0
is_uuid "${sid:-}" || return 0
[ "$sid" = "$PIN_SESSION_ID" ] && return 0
pin_log "adopting pane pin '$sid' for claude tty $PANE_CLAUDE_TTY"
PIN_SESSION_ID="$sid"
PIN_SOURCE="pane"
PIN_RELEASED_SID=""
return 0
fi
# Paired, but the pin file is not there yet (claude has not reached its
# SessionStart hook) or has gone. Hold what we have rather than fall back
# to the directory file: we know for a fact that file is not addressed to
# this pane.
#
# Unless the window walk read an id off that claude's command line, which
# is the one case where the pane is known and the hook is not involved at
# all. Without this a panel on a machine whose SessionStart hook is missing
# or not yet installed would be paired and permanently blind -- better
# addressed than the directory pin, and worse off than it.
if [ -n "$PANE_CLAUDE_TTY" ]; then
if [ -n "$PANE_CLAUDE_SID" ] && [ "$PANE_CLAUDE_SID" != "$PIN_SESSION_ID" ] \
&& is_uuid "$PANE_CLAUDE_SID"; then
pin_log "adopting argv session '$PANE_CLAUDE_SID' from the claude in tty $PANE_CLAUDE_TTY (no pin at $PIN_PANE_PIN_FILE)"
PIN_SESSION_ID="$PANE_CLAUDE_SID"
PIN_SOURCE="pane"
PIN_RELEASED_SID=""
fi
return 0
fi
[ -r "$PIN_HANDOFF_FILE" ] || return 0
IFS=$'\t' read -r sid written /dev/null || return 0
is_uuid "${sid:-}" || return 0
[ "$sid" = "$PIN_SESSION_ID" ] && return 0
case "${written:-}" in ''|*[!0-9]*) written=0 ;; esac
now=$(panel_now)
# A sid this panel has just released is not re-adopted on the strength of
# the file that named it in the first place, that file has not changed,
# and reading it again is not new evidence. It is sent down the stale path
# instead, where it has to prove its transcript is being written to again:
# the same test that released it, so a genuinely resumed session comes
# back and a finished one does not.
written_raw="$written"
if [ "$sid" = "$PIN_RELEASED_SID" ]; then
written=0
fi
# Two-sided, and the second side is the one that was missing. A handoff
# written LONG AFTER this panel started was not written for this launch,
# it is another pane opening in the same directory, so it belongs on the
# stale path, where it has to prove the session it names is live before
# anything believes it. The one-sided test read "written 18 hours after I
# started" as fresh and adopted it unconditionally; that is how a pane
# ended up pinned to a window that had never been typed into.
if (( written PANEL_START_EPOCH + PIN_HANDOFF_FRESH_SECS )); then
# Not written for this launch, either before it (a panel restarted
# mid-conversation) or well after it (another pane opening in this same
# directory). Believe it only while its transcript is still live, which
# the never-typed-into window that broke this had no way to satisfy.
tsc="$project_dir/$sid.jsonl"
[ -f "$tsc" ] || return 0
age=$(( now - $(stat -f %m "$tsc" 2>/dev/null || echo 0) ))
(( age >= 0 && age $lone" ]; then
PIN_DECLINE_MEMO="$sid>$lone"
pin_log "declining unaligned handoff pin '$sid' (transcript touched ${age}s ago): '$lone' is the only live pane session in $project_dir"
fi
return 0
fi
# written_raw, not written: the flap guard above zeroes `written` to force
# this path, and "written 1789455546s ago" -- fifty-six years, the whole
# epoch -- is what that printed instead. A log line that reads as
# corruption when nothing is corrupt costs an hour every time it is
# believed.
pin_log "adopting unaligned handoff pin '$sid' (written $(( now - written_raw ))s ago, panel started $(( now - PANEL_START_EPOCH ))s ago, transcript touched ${age}s ago)"
else
pin_log "adopting handoff pin '$sid' for $PWD"
fi
PIN_SESSION_ID="$sid"
PIN_SOURCE="handoff"
PIN_RELEASED_SID=""
}
# ---- last resort: the only live pane session in this project ----
# Reached when nothing has addressed this panel directly, no launcher
# pairing, and no directory handoff that survives the liveness test, and it
# is reached far more often than it should be, because the launcher writes
# its pairing from a `pgrep` that does not always find the panel in time.
# An unpaired panel restarted into a conversation already in progress is
# structurally blind: the birth-time heuristic below only ever accepts a
# transcript born AFTER the panel started, so the pane reports "no active
# Claude Code session found" for as long as it stays open, beside a session
# it can see perfectly well.
#
# The claim made here is narrow, and the evidence is pins that already exist.
# Every entry under tty/ was written by the SessionStart hook for a claude
# with a controlling terminal, a real pane, never a `--print` run. So a sid
# found there whose transcript is in THIS project directory and is still
# being written to is a live pane session in this repo. Exactly one of those
# and this panel is beside it. Two, and that is the ambiguity this file
# refuses to resolve by guessing: the pane stays honestly blind and says so
# in the log.
# Prints that sole live pane session's id, or nothing. Split out from the
# adopter below because adopt_handoff_pin consults it too: a directory-keyed
# pin only ever names a REPO, so when it names a session that is not the one
# live pane session in that repo, it is the weaker of the two claims and
# stands aside.
lone_live_pane_session() {
local f sid tsc age now found=""
# A paired panel already knows which pane is its own; if that pin is not
# there yet, the answer is to wait for it, not to go looking for someone
# else's.
[ -n "$PANE_CLAUDE_TTY" ] && return 0
now=$(panel_now)
for f in "$PIN_TTY_DIR"/*; do
[ -f "$f" ] || continue
IFS=$'\t' read -r sid _ /dev/null || continue
is_uuid "${sid:-}" || continue
tsc="$project_dir/$sid.jsonl"
[ -f "$tsc" ] || continue
age=$(( now - $(stat -f %m "$tsc" 2>/dev/null || stat -c %Y "$tsc" 2>/dev/null || echo 0) ))
# Written to recently, OR still running. The mtime half alone made this
# recovery useless in the case that needs it most: the panel that has
# just dropped a pin because nobody has typed for half an hour then finds
# no candidate either, for the same reason, and stays blank until the
# person it is reporting on comes back. A session with a live process is
# a live pane session whether or not it is mid-turn.
if (( age PIN_HANDOFF_LIVE_SECS )); then
session_is_live "$sid" || continue
fi
# A second candidate is ambiguity, not a better answer.
[ -n "$found" ] && return 0
found="$sid"
done
[ -n "$found" ] || return 1
printf '%s' "$found"
}
adopt_lone_live_pane_session() {
local found
found=$(lone_live_pane_session) || return 0
[ -n "$found" ] || return 0
pin_log "adopting '$found' as the only live pane session in $project_dir"
PIN_SESSION_ID="$found"
PIN_SOURCE="sole-live"
PIN_RELEASED_SID=""
}
# ---- a path, as Claude Code names its transcript directory ----
# Claude Code encodes a session's cwd into a directory name under
# ~/.claude/projects by replacing EVERY character outside [A-Za-z0-9] with a
# "-", one for one, with no collapsing of runs:
# /Users/me/Desktop/github/iphone Image Manager
# -> -Users-me-Desktop-github-iphone-Image-Manager
# /Users/me/websites/easyenglishlessons.com
# -> -Users-me-websites-easyenglishlessons-com
#
# This used to be `tr '/' '-'`, which is the same answer for a path made of
# nothing but letters, digits and slashes -- which most of them are, so it
# was right for every project on this machine but two. For the other two it
# named a directory that does not exist, and a directory that does not exist
# is indistinguishable here from a project with no sessions: $latest stayed
# empty forever, so "This Session" said "(no active Claude Code session
# found)" and the header said Model: Unknown / Context Usage: N/A / Session:
# -- for the entire life of the pane, while every account-wide figure beside
# them (Today, Block, Recent, Top Sessions -- all corpus-wide globs, which
# never needed this key) updated normally. That is the shape of the bug as
# reported: not a panel that stopped, a panel where SOME sections are frozen
# and the rest are live. `📁 Folder (…)` was the third casualty, printing $0
# against a session that had spent $26, because its per-project session list
# is `ls "$project_dir"/*.jsonl`.
#
# Verified against all 43 project directories on this machine by re-deriving
# each one from the `cwd` recorded inside its own transcripts: 22 carried a
# cwd, this rule reproduces 22 of 22, the old rule 20.
#
# NOT shared with the pin-file key (PIN_HANDOFF_FILE, and the SessionStart
# hook and launcher that write it). That key names a file in OUR OWN cache
# directory; the three sites that build it agree with each other, nothing
# outside reads it, and a space in a filename is not a bug. Do not "fix" it
# to match this one without changing all three at once.
project_key() { printf '%s' "$1" | tr -c 'a-zA-Z0-9' '-'; }
# ---- which transcript is this pane's session? ----
# Runs on every FAST tick: a session started in this pane after the panel
# has to appear in the turn table now, not on the next slow tier. It sets
# globals rather than printing, so it is deliberately NOT called in a
# subshell -- TOP SESSIONS TODAY needs $sess_id to mark which row is this
# one, and a command-substitution subshell can read variables from outside
# itself but never write them back out.
resolve_session() {
# The scan below is scratch work, and it must stay scratch work. Bash
# scoping is dynamic: an unlocalised assignment here does not create a
# global, it overwrites whatever `f` (or `birth`, or `newest_birth`)
# belongs to the nearest caller that declared one. The fallback loop had
# barely ever run -- a pin resolved first almost every time -- so its `f`
# had never collided with anything; the moment an unresolvable pin started
# falling through to it, it silently emptied a caller's `f` and the
# redirect built from it wrote to "". Everything this function is meant to
# publish (latest, sess_id, model_id, model_label, folder_name,
# sess_start_epoch, sess_elapsed_h, project_dir) is deliberately NOT in
# this list.
local birth f newest_birth other_jsonls
# ---- current session identity: fetched once here (not inside the
# guaranteed subshell below) so TOP SESSIONS TODAY, further down, can
# mark which row is THIS session, a command-substitution subshell can
# read these variables outside itself but never write them back out.
#
# Scoped to THIS project's own transcript directory, not
# ~/.claude/projects/*/*.jsonl globally, with a second Claude Code
# session open in another repo, the global glob picks up whichever
# session most recently wrote a line, so "THIS SESSION" would flip
# between two unrelated conversations turn-count-and-all every few
# refreshes (e.g. jumping from turn 50 in this project back to turn 16
# in another one). The launcher (claude-panel-launch.sh) always opens
# this panel via a same-cwd Ghostty split, so $PWD reliably names the
# project this panel belongs to; project_key() above turns that into the
# directory name Claude Code actually used.
project_dir="$HOME/.claude/projects/$(project_key "$PWD")"
# Headless, for the Claude Code mod: the mod names its own session, so
# there is nothing to guess and none of the pin machinery below applies.
# The transcript is looked for under every project when it is not under
# this directory's, since a session can be started from a subdirectory.
if [ -n "${PANEL_HEADLESS:-}" ]; then
latest=""
if [ -n "$PIN_SESSION_ID" ]; then
latest="$project_dir/$PIN_SESSION_ID.jsonl"
if [ ! -f "$latest" ]; then
latest=$(ls "$HOME"/.claude/projects/*/"$PIN_SESSION_ID".jsonl 2>/dev/null | head -1)
[ -n "$latest" ] && project_dir=$(dirname "$latest")
fi
fi
resolve_identity
return 0
fi
# Every tick, not just at startup. The panel and `claude` start at the
# same moment (the ~/.zshrc preexec hook backgrounds the launcher and then
# lets the command run), so on the first few ticks the SessionStart hook
# may not have written the handoff yet. This also re-reads it while a pin
# is held but unresolved, so the authoritative id from the hook supersedes
# the launcher's guess if the two ever disagree.
release_dead_pin
adopt_handoff_pin
[ -z "$PIN_SESSION_ID" ] && adopt_lone_live_pane_session
if [ -n "$PIN_SESSION_ID" ]; then
latest="$project_dir/$PIN_SESSION_ID.jsonl"
# The pinned session may not have written its first line yet (the
# launcher is still typing into the new pane), treat "not there yet"
# as "no session", same as the unpinned case; the next fast refresh
# picks it up.
if [ ! -f "$latest" ]; then
latest=""
# ...but only for a WHILE, and only for an ARGV pin, the one path
# where the id may have been TYPED into the pane and silently rewritten
# by an interleaved keystroke (see PIN_HANDOFF_FILE for the observed
# corruption). A pin like that names a transcript that will never
# exist, so waiting on it costs the whole session; drop it and let the
# handoff file, then the birth-time heuristic, take over on this same
# tick.
#
# A handoff pin is deliberately NOT timed out. Nothing can corrupt it,
# so "the transcript is not there yet" only ever means the session has
# not written its first line, which happens whenever the user reads
# for a couple of minutes before typing, and is not the panel's cue to
# start guessing. The 90s timer used to fire on exactly that: an
# observed pane abandoned a perfectly good pin at 14:21:53 and the
# transcript appeared at 14:22:09, 16 seconds later.
if [ "$PIN_SOURCE" = "argv" ] && (( $(panel_now) - PANEL_START_EPOCH > PIN_GRACE_SECS )); then
pin_log "abandoning argv pin '$PIN_SESSION_ID' after ${PIN_GRACE_SECS}s: $project_dir/$PIN_SESSION_ID.jsonl never appeared"
PIN_SESSION_ID=""
PIN_SOURCE=""
fi
fi
fi
if [ -z "$PIN_SESSION_ID" ]; then
# "Most recently modified" picks whichever session is actively being
# chatted with, including one that's NOT this pane's, if another
# session in this same project dir is currently mid-conversation. That
# misattributes an unrelated, already-running session's cost/turns to a
# brand-new, still-empty session opened without going through the
# PIN_SESSION_ID launcher path (e.g. a GUI window, `claude --resume`,
# an IDE-embedded terminal).
#
# Prefer instead the newest transcript file CREATED after this panel
# process itself started (birth time, via macOS `stat -f %B`, not
# mtime), a file that didn't exist yet when this panel launched can
# only be a session that started alongside or after it, which is the
# best available guess for "the session in this pane" without an
# explicit pin.
latest=""
newest_birth=0
# ONE `stat` for the whole directory, not one fork per transcript. This
# runs on every fast tick (a session started in this pane has to show up
# now, not on the next slow tier), and a long-lived project directory
# routinely holds dozens of past transcripts -- that was dozens of forks
# every $REFRESH seconds to answer what a single fork answers.
#
# `%B %N` puts the birth epoch first and the path last, so `read -r birth
# f` gives f the rest of the line and paths containing spaces survive.
# On any platform without `stat -f` (i.e. not macOS) this prints nothing
# and $latest stays empty -- exactly what the per-file `|| continue`
# produced before, and the single-transcript fallback below still applies.
while read -r birth f; do
[ -n "$f" ] || continue
case "$birth" in ''|*[!0-9]*) continue;; esac
if (( birth > PANEL_START_EPOCH && birth > newest_birth )); then
newest_birth=$birth
latest="$f"
fi
done < /dev/null)
# No post-launch file yet, e.g. a brand-new session whose first line
# (or even --session-id pin) hasn't landed on disk. Only fall back to
# "most recently modified in this directory" when that guess is
# unambiguous (exactly one transcript here); with more than one it's a
# coin flip which session is actively being chatted with, and guessing
# wrong means showing someone else's live turns/cost as this pane's,
# worse than the honest "no session found" this pane would otherwise
# show for the few seconds until its own file exists. A long-lived
# project directory can easily hold a dozen-plus past transcripts, so
# "more than one file" is the common case here, not an edge case.
if [ -z "$latest" ]; then
other_jsonls=("$project_dir"/*.jsonl)
if [ "${#other_jsonls[@]}" -eq 1 ] && [ -f "${other_jsonls[0]}" ]; then
latest="${other_jsonls[0]}"
fi
fi
# A "restarted mid-conversation" fallback (most-recently-modified
# file within the last 30 minutes) used to sit here, on the theory
# that the panel itself was (re)started mid-conversation rather than
# launched fresh, so PANEL_START_EPOCH is newer than even the
# transcript this pane has been chatting in all along. Reverted:
# "only one transcript modified recently" is NOT the same claim as
# "only one transcript modified recently in this exact pane", a
# second, already-open pane in the same project directory that's
# mid-conversation makes that file the ONLY recent one project-wide
# while this pane is a completely different, still-blank session
# (nothing written yet, so it can't out-recency the other pane's
# file no matter how the window is sized). That showed a live,
# unrelated 47-turn/$3.99 session's data in a brand-new empty pane,
# confidently wrong, which the guessing rule this whole function
# exists to avoid explicitly calls worse than the honest "no active
# session found" this now falls back to instead.
fi
resolve_identity
}
# The identity of the transcript resolve_session settled on: sess_id,
# model_id, model_label, folder_name, sess_start_epoch and sess_elapsed_h.
resolve_identity() {
if [ -n "$latest" ]; then
IFS=$'\t' read -r sess_id model_id model_label folder_name sess_start_epoch < <(session_identity_cached "$latest")
# Floor elapsed time at 3 minutes, a session-so-far rate computed over
# the first few seconds swings wildly and would flash red/green noise.
sess_elapsed_h=$(awk -v s="$sess_start_epoch" -v n="$(panel_now)" 'BEGIN{ h=(n-s)/3600; if(h=3 real sessions to trust, otherwise a
# single earlier tiny/huge session would skew it.
since7=$(panel_date -v-7d +%Y%m%d 2>/dev/null || panel_date -d '7 days ago' +%Y%m%d)
since7_iso=$(panel_date -v-7d +%Y-%m-%d 2>/dev/null || panel_date -d '7 days ago' +%Y-%m-%d)
# Fetched ONCE for the whole frame. Three sections below are three views of
# this one report -- the 7-day baseline, the previous 7 days it is compared
# against, and this project's share of it -- and each used to call
# all_sessions() for itself. On a cache hit that is still a re-read and a
# re-parse of a 150KB payload (~0.01 CPU-s each, measured), and on a tick
# where the TTL has lapsed it is additionally a `corpus_changed_since` walk
# each.
#
# Coherence is the better reason. The three calls were three separate
# command substitutions, so a TTL lapsing between two of them handed the
# same frame two different payloads, and the trend arrow could be coloured
# against a baseline the figure beside it was not computed from -- section
# 6.1's drift, arriving through the cache rather than through a bucket.
# One fetch, one frame, one set of numbers that agree.
all_sess=$(all_sessions)
baseline_json=$(sessions_window "$all_sess" "$since7_iso" "")
avg_session_cost=$(jq -r '
[.session[].totalCost] | map(select(. > 0.05)) |
if length >= 3 then (add/length) else 0 end
' <</dev/null)
[ -z "$avg_session_cost" ] && avg_session_cost=0
since30=$(panel_date -v-29d +%Y%m%d 2>/dev/null || panel_date -d '29 days ago' +%Y%m%d)
since30_iso=$(panel_date -v-29d +%Y-%m-%d 2>/dev/null || panel_date -d '29 days ago' +%Y-%m-%d)
recent_json=$(recent_sections)
# Same 30-day window `daily --since "$since30"` covered; summing the rows
# reproduces that call's .totals.totalCost exactly (verified).
spend30=$(jq -r --arg d "$since30_iso" '[.daily[]? | select(.period >= $d) | .totalCost] | add // 0' <</dev/null)
[ -z "$spend30" ] && spend30=0
avg_daily_30=$(awk -v s="$spend30" 'BEGIN{ printf "%.4f", s/29 }')
# ---- trend baselines: the SAME two windows one period earlier, so the
# 7-day-avg and 30-day-spend lines can be traffic-lit against "am I
# spending more than I was a week/month ago" rather than against
# themselves (a baseline has nothing to compare to but its own past).
prev7_since=$(panel_date -v-14d +%Y%m%d 2>/dev/null || panel_date -d '14 days ago' +%Y%m%d)
prev7_until=$(panel_date -v-8d +%Y%m%d 2>/dev/null || panel_date -d '8 days ago' +%Y%m%d)
prev7_since_iso=$(panel_date -v-14d +%Y-%m-%d 2>/dev/null || panel_date -d '14 days ago' +%Y-%m-%d)
prev7_until_iso=$(panel_date -v-8d +%Y-%m-%d 2>/dev/null || panel_date -d '8 days ago' +%Y-%m-%d)
prev7_avg=$(sessions_window "$all_sess" "$prev7_since_iso" "$prev7_until_iso" | jq -r '
[.session[].totalCost] | map(select(. > 0.05)) |
if length >= 3 then (add/length) else 0 end
' 2>/dev/null)
[ -z "$prev7_avg" ] && prev7_avg=0
prev30_since=$(panel_date -v-58d +%Y%m%d 2>/dev/null || panel_date -d '58 days ago' +%Y%m%d)
prev30_until=$(panel_date -v-30d +%Y%m%d 2>/dev/null || panel_date -d '30 days ago' +%Y%m%d)
prev30_since_iso=$(panel_date -v-58d +%Y-%m-%d 2>/dev/null || panel_date -d '58 days ago' +%Y-%m-%d)
prev30_until_iso=$(panel_date -v-30d +%Y-%m-%d 2>/dev/null || panel_date -d '30 days ago' +%Y-%m-%d)
prev_spend30=$(daily_window "$(recent_sections)" "$prev30_since_iso" "$prev30_until_iso" | jq -r '.totals.totalCost // 0')
[ -z "$prev_spend30" ] && prev_spend30=0
prev_avg_daily_30=$(awk -v s="$prev_spend30" 'BEGIN{ printf "%.4f", s/29 }')
# ---- today's spend + EOD forecast: an account-wide total, so it renders
# fine with no session resolved yet. Only the three fields below it,
# Model, Session, Context Usage: genuinely need one, and all three now
# come from this pane's own transcript parse rather than from a query.
today_daily_json=$(today_daily_shape "$recent_json")
today_amt="0.00"
if [ -n "$today_daily_json" ] && [ "$(jq -r '.daily | length' <</dev/null)" != "0" ]; then
today_amt=$(jq -r '.totals.totalCost // 0' << $46 -> $22 across three 5s
# refreshes with nothing unusual happening).
#
# The remaining-hours forecast itself is the persisted bucket cache's
# historical average per hour-of-day, SCALED by how today's pace
# compares to a typical day's pace so far, not used unscaled. An
# unscaled historical average ignores today entirely: on a quiet day
# (e.g. $17.93 spent by 14:48 against a ~$274 historical average for
# hours 0-14) it forecast $215 for the day, back near the 30-day
# average, regardless of how light today had actually been. pace_ratio
# = today_amt ÷ the same buckets' historical average for hours 0..now;
# ratio 1 (no scaling) when there's no historical baseline yet (cold
# cache).
# The arithmetic moved to claude-day-projection.sh, which the cost-alert
# hook also sources: it now ALERTS on this projection, and a panel drawing
# one number while an alert fires on another is drift with consequences.
current_hour=$(( 10#$(panel_date +%H) ))
read -r today_pred typical_so_far remaining_avg _pred_frac <<100%.
#
# Only Model, Session, and Context Usage below actually need that
# resolved session, everything else in this block (Today, Current
# Block, All Sessions, Folder, 30-Day Value, Proxy State) was always
# independently computable, but used to be gated behind the SAME
# session check as these three, so a brand-new pane with nothing typed
# into it yet, the overwhelmingly common first few seconds of every
# session, showed nothing at all except "no active session found"
# instead of the account-wide context it could show all along.
if [ -n "$latest" ]; then
# Model: already resolved from the transcript by resolve_session(). It
# used to be sent to ccusage inside the statusline payload and read back
# out of the rendered string it came home in.
mtc=$(model_tier_color "${model_id:-}")
# The session's own id, in the same last-5-characters form the Top
# Sessions rows use, so the two can be read against each other -- that
# matching is the whole reason it is on screen twice. After the model,
# because it is an identifier you look up rather than a number you watch.
# Electric blue rather than dim: dim renders as low-contrast grey against
# this pane's background, which is the wrong signal for the one string
# you go looking for. Shared with the refresh tags rather than given its
# own colour, because it is the same kind of thing they are -- a label
# about the panel, not one of the numbers it reports.
#
# Labelled "SID", because five hex characters floating after the model
# name say nothing about what they are -- and not "Session", which is
# already the label on the money line directly below. Two rows reading
# "Session:" and meaning different things (an identifier, a spend) is
# worse than either being unlabelled. The leading * says the id is
# truncated (the last five characters of the UUID), not the whole thing.
printf ' 🤖 Model: %s%s%s SID: %s*%s%s\n' \
"$mtc" "${model_label:-Unknown}" "$C_RESET" \
"$C_ELECTRIC" "${sess_id: -5}" "$C_RESET"
else
printf ' 🤖 Model: %sUnknown%s\n' "$C_YELLOW" "$C_RESET"
fi
# Directly under Model, not down among the money rows where it used to
# sit. Model/SID/Folder all answer "what is this pane watching"; Session,
# Today, Block, 30-Day all answer "how much has it cost". Folder was the
# one identity row stranded on the wrong side of that split, five money
# lines away from the two it belongs with.
#
# Show just the project folder name, the transcript's own "cwd" field
# when a session is resolved (not Claude Code's sanitized full-path
# directory name, which can run well past a narrow 1/3-width split), or
# $PWD's own basename otherwise, since this panel is always launched
# into a same-cwd split either way.
if [ -n "$latest" ]; then
folder_disp="${folder_name:-unknown}"
else
folder_disp="$(basename "$PWD")"
fi
# The right-hand 25 characters: a repo name's distinguishing part is
# usually its end (wordpress-cyber-devtools, ...-cost-usage-panel), and a
# longer name pushed the spend after it off a narrow pane. The cut is
# marked with a plain "..." outside the name's colour: a single "…" in
# the same blue read as part of the name.
folder_cut=""
if [ "${#folder_disp}" -gt 25 ]; then
folder_disp="${folder_disp: -25}"
folder_cut="..."
fi
# Total spend attributed to THIS project, every session whose
# transcript lives under $project_dir, summed via ccusage's own
# per-session costs (not a token-repricing estimate), shown next to
# the folder name rather than the account-wide block projection that
# used to sit here. $project_dir needs no resolved session either.
proj_ids_json=$(ls "$project_dir"/*.jsonl 2>/dev/null | xargs -n1 basename 2>/dev/null | sed 's/\.jsonl$//' | jq -R -s -c 'split("\n") | map(select(length>0))')
proj_spend=$(printf '%s' "$all_sess" | jq -r --argjson ids "$proj_ids_json" '
[.session[] | select(.period as $p | $ids | index($p) != null) | .totalCost] | add // 0
')
# Electric blue on the name, for the same reason SID carries it: these are
# strings you go looking for, not numbers you watch move, and the colour is
# what separates the identity rows from the tier-coloured money below them.
# The spend stays uncoloured, it has no threshold to be coloured against.
printf ' 📁 Folder: %s%s%s%s (%s)\n' "$folder_cut" "$C_ELECTRIC" "$folder_disp" "$C_RESET" "$(fmt_money "$proj_spend")"
# Session spend needs BOTH a resolved session and a priced turn in it;
# the two used to be nested, which is why the "--" fallback had to be
# written out twice with near-identical reasoning attached to each.
if [ -n "$latest" ] && [ -n "$SESS_COST" ]; then
sess_amt=$(awk -v c="$SESS_COST" 'BEGIN{ printf "%.2f", c }')
# The same floor as the chat alert (CLAUDE_PANEL_ALERT_MIN_USD, the
# dashboard's "Session alert only above"): the $5 default was hardcoded
# here, so raising the setting quietened the alert but not this colour.
sc=$(tier_color "$sess_amt" "$avg_session_cost" "$TIER_YELLOW_MULT" "$TIER_RED_MULT" "$(panel_option_usd CLAUDE_PANEL_ALERT_MIN_USD "$MIN_SESSION_ALERT")")
# THIS session's own $/hr (spend so far ÷ time since its first
# message), separate from the block burn rate below, which is
# every session's combined spend in the current 5h window, not
# just this one. Shown on the same row as the spend it's derived
# from rather than its own line.
sess_rate=$(awk -v c="$sess_amt" -v h="$sess_elapsed_h" 'BEGIN{ printf "%.2f", c/h }')
src=$(threshold_color "$sess_rate" "$BURN_YELLOW" "$BURN_RED")
printf ' 💰 Session: %s$%s%s, Burn %s$%s/hr%s\n' \
"$sc" "$sess_amt" "$C_RESET" "$src" "$sess_rate" "$C_RESET"
else
# No session resolved, or one with no metadata line yet (a pre-existing
# cache entry, or a first turn that has not landed). "--" is the honest
# answer: `$0.00` would be indistinguishable from a real zero. It was the
# only money-shaped string on screen during the staleness this file's
# project_key() comment describes, so the one row that should have said
# "I know nothing" was the row that looked most like an answer.
printf ' 💰 Session: --, Burn --\n'
fi
# A model ccusage cannot price is in its totals at $0 (see unpriced_models).
# Today is withheld outright when one ran today -- the missing part can be
# most of the day -- and every other ccusage figure is flagged, since each
# of them undercounts by an amount the panel has no way to know.
today_unpriced=$(unpriced_models "$today_daily_json" | tr '\n' ' ')
recent_unpriced=$(unpriced_models "$recent_json" | tr '\n' ' ')
if [ -n "$recent_unpriced" ]; then
printf ' %s⚠ no price for %s(totals below exclude it)%s\n' \
"$C_YELLOW" "$recent_unpriced" "$C_RESET"
fi
# Under 1% of the day's usage the priced figure is still the answer, so it
# is shown with the gap named rather than withheld.
today_unpriced_small=0
if [ -n "$today_unpriced" ] && awk -v p="$(unpriced_share_pct "$today_daily_json")" 'BEGIN{exit !(p 0? t*100/w:0) }')
ctx_color=$(ctx_tier_color "$ctx_pct" "$CTX_YELLOW" "$CTX_RED" "$CTX_PURPLE")
forced_note=""
# Check the env var directly rather than re-deriving "was this model
# actually forced down" from a hardcoded model-name list, that list
# (originally just Sonnet 5/Fable 5) is exactly what went stale and
# caused the 1M-window bug this comment now sits next to.
if [ "$win_size" = "200000" ] && [[ "$model_id" != claude-haiku-4-5* ]] && [ "${CLAUDE_CODE_DISABLE_1M_CONTEXT:-0}" = "1" ]; then
forced_note=" [forced 200k]"
fi
# From CTX_RED up the label goes with it, same rule as the turn
# table's whole-row coloring: a coloured figure after a plain white
# "Context Usage:" is what got scanned past at 96% of a 1M window.
# Below that only the figure is tinted, so a routine yellow does not
# make the whole header line shout.
label_color=""
awk -v v="$ctx_pct" -v t="$CTX_RED" 'BEGIN{exit !(v+0>t)}' && label_color="$ctx_color"
printf ' %s🧠 Context: %s%s / %s tokens (%s%%)%s%s\n' \
"$label_color" "$ctx_color" "$(fmt_m "$ctx_tokens")" "$(fmt_m "$win_size")" "$ctx_pct" "$C_RESET" "$forced_note"
# Not while a pauseless compaction is about to replace this context:
# the summary is ready, so restarting would only throw it away.
[ "$SESS_COMPACTING" = 1 ] || restart_banner "$ctx_tokens"
else
# No context figure from the parse -- a session whose first turn has
# not landed yet, or an older cache entry. "N/A" is the honest answer;
# a 0% would read as an empty context window.
printf ' 🧠 Context: N/A\n'
fi
else
printf ' 🧠 Context: N/A\n'
fi
# Both trend lines below are colored against the SAME window one period
# earlier (this week's avg vs last week's, this month's spend vs last
# month's), a baseline has no natural threshold of its own, but a
# widening gap vs its own past is exactly the "am I burning through
# tokens faster than before" signal worth a color for.
spendc=$(tier_color "$spend30" "$prev_spend30" "$TIER_YELLOW_MULT" "$TIER_RED_MULT" "$MIN_TREND_ALERT")
if awk -v a="$avg_daily_30" 'BEGIN{exit !(a>0)}'; then
avgc=$(tier_color "$avg_daily_30" "$prev_avg_daily_30" "$TIER_YELLOW_MULT" "$TIER_RED_MULT" "$MIN_TREND_ALERT")
printf ' 💵 30-Day Value: %s%s%s (avg %s%s/day%s)\n' \
"$spendc" "$(fmt_money "$spend30")" "$C_RESET" "$avgc" "$(fmt_money "$avg_daily_30")" "$C_RESET"
else
printf ' 💵 30-Day Value: %s%s%s\n' "$spendc" "$(fmt_money "$spend30")" "$C_RESET"
fi
proxy_state_line
license_line
}
# ---- fast-tier render: this session's per-turn table ----
# The one section that has to track the conversation as it happens, and the
# cheapest one here: it reads a single transcript file and is cached on that
# file's own mtime+size (turn_table_cached), so an idle pane re-renders it
# for free and an active one pays exactly one parse per turn that lands. No
# ccusage call, no corpus scan -- which is why it can afford to run at
# $REFRESH while everything else runs at $SLOW_REFRESH.
build_session_table() {
# The blank separator line between the summary block and this one. It
# lives at the top of this function rather than the bottom of
# build_summary(), because $(...) strips trailing newlines -- a blank line
# emitted as the last thing in the summary would simply not survive into
# the cached string.
echo
# ---- per-turn breakdown of the current session ----
# ccusage doesn't expose per-message cost (session/daily/blocks only give
# per-session/day/block totals), so this reads the transcript directly and
# prices each turn itself. Rates below are Anthropic's published per-model
# $/1M input & output; cache read/write are the standard multiples of the
# input rate (0.1x read, 1.25x 5m write, 2x 1h write). Sonnet 5's launch
# rate of $2/$10 was made permanent on 2026-08-10, cancelling the planned
# increase to $3/$15; verify this has not changed again before trusting it.
if [ -n "$latest" ]; then
# Printed here, not by the (cached) table below: burn rate is a live,
# every-refresh figure independent of the transcript file, so it can't
# be part of output that's only recomputed when that file changes.
# The rate label goes LAST on this line deliberately: on a narrow pane
# clear_eol() truncates from the right, so the label is what gets cut,
# never the burn figure it annotates.
printf '%sThis Session%s, Burn %s%s/hr%s %s\n' \
"$C_BOLD$C_CYAN" "$C_RESET" "${burn_color:-$C_RESET}" "$(fmt_money "${blk_cph:-0}")" "$C_RESET" \
"$(rate_tag "$RATE_FAST")"
printf '%s\n' "$SESS_TABLE"
else
header "This Session $(rate_tag "$RATE_FAST")"
echo " (no active Claude Code session found)"
fi
}
# ---- slow-tier render: Recent + Top Sessions Today ----
# Same reasoning as build_summary(), plus the expensive bit: Top Sessions
# fans out one session_today_tokens_cached() per session active today. Each
# of those is a `ccusage session -i ` whose -i filters only the OUTPUT
# -- the scan is the whole corpus either way -- and each sid is its own
# cache key, so the mtime cache dedupes a session against itself but never
# the eight against each other. On the old single tier a day with eight
# live sessions meant eight concurrent full corpus scans every 10 seconds.
#
# Emitted untruncated; the caller applies `head -n $remaining` at PRINT
# time, not here, because the height left over depends on how many rows the
# fast-tier turn table happens to have this tick.
# Is the slow-tier frame due to be rebuilt this tick?
#
# A function, not three lines inline, because the third condition is the only
# part of this panel's refresh behaviour that is neither a clock nor a resize
# -- and a decision that cannot be called from a test is a decision that gets
# asserted by grepping the source for a variable name, which proves nothing
# about what the loop does with it.
#
# The three reasons a frame is due:
# 1. SLOW_REFRESH has elapsed.
# 2. The pane was resized, so the whole frame must be re-laid out.
# 3. The session identity CHANGED.
#
# (3) exists because identity is resolved on every FAST tick but rendered by
# the header, which is slow tier -- so a model learned at 10s did not reach
# the screen for up to two minutes. Every new pane starts in exactly that
# state: the panel launches with the session's first line on disk but no
# ASSISTANT line yet, so the scan correctly reports "unknown", the first
# frame renders `Model: Unknown` / `Context Usage: N/A`, and it sits there
# while the fast-tier turn table two lines below already names the model on
# every row. One frame contradicting itself, for two minutes, on every
# session start.
#
# Identity is not on a cadence at all -- it changes when it changes, and
# noticing is free because resolve_session has already run this tick. So
# redraw on the change rather than waiting for the clock. This also catches a
# genuine mid-session model switch, which had the same two-minute lag for the
# same reason.
#
# Pure: it reads the "what did the last frame show" state but never writes
# it. Those are updated where the frame is actually rendered, next to
# last_slow and last_cols, so a tick that decides "due" and then does not
# render cannot mark the identity as already shown.
slow_frame_due() { # $1 = now epoch
(( $1 - last_slow >= SLOW_REFRESH )) && return 0
[ "$cols" != "$last_cols" ] && return 0
[ "${model_label:-}" != "${last_model_label:-}" ] && return 0
return 1
}
build_trailing() {
echo
# ---- recent: today's totals/models + 3-day trend + week/month, one
# header. Was three separate headers (TODAY, LAST 3 DAYS, WEEK / MONTH)
# with a bar chart eating 3 rows for 3 numbers, merged so this whole
# block reliably fits above the fold instead of scrolling off a short
# pane.
header "Recent $(rate_tag "$RATE_SLOW")"
# Same query as today_daily_json in build_summary(), that runs in its own
# $(...) subshell, so its value doesn't survive into this one. Re-fetching
# here goes through ccusage_cached(), and build_summary() and this function
# are called back to back on the same slow tick, so the entry is always
# well inside its TTL by the time this reads it: a cache read, never a
# second ccusage fork.
daily_json=$(today_daily_shape "$(recent_sections)")
if [ -n "$daily_json" ] && [ "$(jq -r '.daily | length' <</dev/null)" != "0" ]; then
IFS=$'\t' read -r tCost tTok tIn tOut tCacheC tCacheR <<<"$(jq -r '
.totals | [.totalCost, .totalTokens, .inputTokens, .outputTokens, .cacheCreationTokens, .cacheReadTokens] | @tsv
' <<<"$daily_json")"
unpriced_today=$(unpriced_models "$daily_json")
# Same rule as build_summary's Today line: an unpriced sliver (under 1%
# of the day) shows the priced total with the gap named.
if [ -n "$unpriced_today" ] && ! awk -v p="$(unpriced_share_pct "$daily_json")" 'BEGIN{exit !(p < 1)}'; then
printf ' %stoday:%s ? | %s tokens\n' "$C_CYAN" "$C_RESET" "$(fmt_mt "$tTok")"
elif [ -n "$unpriced_today" ]; then
printf ' %stoday:%s %s %s(+ unpriced)%s | %s tokens\n' "$C_CYAN" "$C_RESET" "$(fmt_money "$tCost")" "$C_YELLOW" "$C_RESET" "$(fmt_mt "$tTok")"
else
printf ' %stoday:%s %s | %s tokens\n' "$C_CYAN" "$C_RESET" "$(fmt_money "$tCost")" "$(fmt_mt "$tTok")"
fi
# Wrapped at the pane's width rather than cut off at its edge: five
# models in a day ran past a narrow pane and the last one's cost was
# the part lost. Widths are counted without the colour codes.
models_line="" models_w=0
local wrap_w=$(( ${cols:-80} - 2 ))
while IFS=$'\t' read -r mname mcost; do
[ -z "$mname" ] && continue
# Short label: drop the "claude-" prefix and any -YYYYMMDD date suffix.
mlabel=${mname#claude-}
[[ $mlabel =~ ^(.*)-[0-9]{8}$ ]] && mlabel=${BASH_REMATCH[1]}
# ccusage's $0 for a model it cannot price is not a cost; show "?".
if grep -qxF "$mname" << wrap_w )); then
models_line+=$'\n '"$seg" models_w=$seg_w
else
models_line+=" | $seg" models_w=$(( models_w + 3 + seg_w ))
fi
done < <(jq -r '.daily[0].modelBreakdowns[]? | [.modelName, .cost] | @tsv' <</dev/null || panel_date -d '2 days ago' +%Y%m%d)
since3_iso=$(panel_date -v-2d +%Y-%m-%d 2>/dev/null || panel_date -d '2 days ago' +%Y-%m-%d)
trend_json=$(daily_window "$(recent_sections)" "$since3_iso" "")
if [ -n "$trend_json" ]; then
trend_line=""
while IFS=$'\t' read -r day dcost dtok; do
[ -z "$day" ] && continue
# Day-of-month only, and two spaces instead of " | ", because the
# month is the same for all three cells in a 3-day window and this
# line was running past the pane's right edge -- the third day's cost,
# i.e. TODAY's, was the number being truncated away.
# An ordinal ("27th") so a bare day number cannot be read as a count.
seg="${C_CYAN}$(ordinal_day "${day:8}")${C_RESET} $(fmt_money "$dcost")"
trend_line="${trend_line:+$trend_line }$seg"
done < <(jq -r '.daily[] | [.period, .totalCost, .totalTokens] | @tsv' <<<"$trend_json")
printf ' %s3 days:%s %s\n' "$C_CYAN" "$C_RESET" "$trend_line"
fi
recent_json=$(recent_sections)
week_cost=$(current_week_cost "$recent_json")
month_cost=$(jq -r --arg m "$(panel_date +%Y-%m)" '[.monthly[]? | select(.period == $m) | .totalCost][0] // 0' <</dev/null)
[ -z "$month_cost" ] && month_cost=0
printf ' %sweek:%s %s | %smonth:%s %s\n' \
"$C_CYAN" "$C_RESET" "$(fmt_money "$week_cost")" "$C_CYAN" "$C_RESET" "$(fmt_money "$month_cost")"
echo
# ---- top sessions today: which session is consuming the day's spend ----
header "Top Sessions Today $(rate_tag "$RATE_HISTORY")"
session_json=$(sessions_window "$(all_sessions)" "$(panel_date +%Y-%m-%d)" "")
if [ -n "$session_json" ] && [ "$(jq -r '.session | length' <</dev/null)" != "0" ]; then
# ccusage's per-session totalCost/totalTokens are all-time-per-session,
# not date-scoped, `--since` only decides which sessions get *listed*
# (any with activity today), so a session spanning multiple days shows
# its FULL history here, which can exceed the whole day's real total
# (ccusage daily). Recompute today's slice from that session's own
# deduped entry list (`-i `, which matches ccusage's authoritative
# totalTokens exactly, re-parsing the raw JSONL ourselves double-counts
# branches/retries). Entry-level costUSD is 0 for this account (ccusage
# prices from its model-rate table, not per-entry), so today's cost is
# estimated as a share of the session's all-time cost proportional to
# its token share.
today_str=$(panel_date +%Y-%m-%d)
tmpdir=$(mktemp -d)
# Wait on the pids we actually spawned, never a bare `wait`. This runs
# inside a $(...) command substitution, and such a subshell inherits the
# PARENT's job table without those jobs being its children -- so a bare
# `wait` here reaches the panel's own stdin-drain background loop, prints
# "pid N is not a child of this shell", and never retires the entry: it
# spins, emitting that line forever. (It was survivable only while this
# block sat inside a `| head -n` pipeline, which resets the job table.)
fanout_pids=""
while IFS=$'\t' read -r sid _ _ _; do
[ -z "$sid" ] && continue
( session_today_tokens_cached "$sid" "$today_str" > "$tmpdir/$sid.tok" ) &
fanout_pids="$fanout_pids $!"
done < <(jq -r '.session[] | [.period, .totalCost, .totalTokens, .metadata.lastActivity] | @tsv' <</dev/null; done
top_rows=$(while IFS=$'\t' read -r sid all_cost all_tok slast; do
[ -z "$sid" ] && continue
ef="$tmpdir/$sid.tok"
today_tok=""
[ -s "$ef" ] && today_tok=$(cat "$ef")
# Falling back to the session's ALL-TIME total is deliberate and
# unchanged: better to overstate a multi-day session's today-slice
# than to silently drop it out of the ranking entirely.
[ -z "$today_tok" ] && today_tok="$all_tok"
today_cost=$(awk -v c="$all_cost" -v tt="$today_tok" -v at="$all_tok" 'BEGIN{ printf "%.10f", (at>0 ? c*tt/at : 0) }')
printf '%s\t%s\t%s\t%s\n' "$sid" "$today_cost" "$today_tok" "$slast"
done < <(jq -r '.session[] | [.period, .totalCost, .totalTokens, .metadata.lastActivity] | @tsv' <</dev/null)
# "*" then the last 5 characters of the sid -- 5, not the previous 4,
# so this cell and the id on the Model line are the same string. That
# matching is the only reason the id is on screen twice: it is how you
# find the row you are currently sitting in.
#
# The current session's row gets a green "<<" pointing back at it. It
# is a suffix, where the old "*this" suffix was -- but three characters
# shorter, and that is the whole difference: "*this" sat off the right
# edge of a block that has spent this session being pulled back inside
# the pane, so it was the part that got truncated away. " <<" ends the
# row at 30 columns, inside this block's own 32-column header, so it
# cannot be the first thing to go. A prefix would have cost no width at
# all but "<<" is two characters and the id cell is a fixed six, so it
# would have shifted this row's columns out of line with the other four.
# The bold stays; the marker is for a monochrome screenshot or a
# terminal that renders bold as plain. (The space in "${sid: -5}" is
# required: "${sid:-5}" is the unset-default expansion and would print
# the whole id.)
row=$(printf '%-6s %6s %5s %s' "*${sid: -5}" "$(fmt_money "$scost")" "$(fmt_mt "$stok")" "$lasthm")
if [ "$sid" = "${sess_id:-}" ]; then
printf ' %s%s%s %s<<%s\n' "$C_BOLD" "$row" "$C_RESET" "$C_GREEN" "$C_RESET"
else
printf ' %s\n' "$row"
fi
done < /dev/null || return 0
printf '%s\n' "$2" > "$BAND_DIR/$1.ansi.$$" && mv -f "$BAND_DIR/$1.ansi.$$" "$BAND_DIR/$1.ansi"
find "$BAND_DIR" -name '*.ansi' -mtime +2 -delete 2>/dev/null
return 0
}
# Install-time options, one KEY=value per line in
# ~/.config/claude-panel/options (written with every option false by
# claude-panel-setup.sh; an environment variable of the same name wins).
# Read with grep, not sourced, so the file can only ever set a flag.
# True is true/1/yes/on; anything else, or no file, is false.
panel_option() { # $1 = KEY
local v="${!1:-}"
if [ -z "$v" ]; then
v=$(grep -E "^$1=" "$HOME/.config/claude-panel/options" 2>/dev/null | tail -1)
v="${v#*=}"
fi
case "$(printf '%s' "$v" | tr '[:upper:]' '[:lower:]' | tr -d '"'"'"' ')" in
true|1|yes|on) return 0 ;;
esac
return 1
}
# For options that default to ON: true only when the value is explicitly
# false/0/no/off. A missing file or key, or anything else, leaves it on.
panel_option_off() { # $1 = KEY
local v="${!1:-}"
if [ -z "$v" ]; then
v=$(grep -E "^$1=" "$HOME/.config/claude-panel/options" 2>/dev/null | tail -1)
v="${v#*=}"
fi
case "$(printf '%s' "$v" | tr '[:upper:]' '[:lower:]' | tr -d '"'"'"' ')" in
false|0|no|off) return 0 ;;
esac
return 1
}
# ---- the floating "Async Compaction In Progress" notice ----
# While Claude Burst summarises this session in the background (pauseless
# compaction), the same floating notice the launcher uses sits over the top
# of the Ghostty window, and turns to "Async Compaction Finished" when the
# summary is done. Burst saves each session's state, with "pending" true
# for the length of the summary call, to compaction-state.json on every
# transition, so the file is re-read only when its mtime moves. A pending
# left behind by a gateway that died mid-summary is ignored once the file
# is 15 minutes old. CLAUDE_PANEL_COMPACTION_OVERLAY=false turns it off.
COMPACT_STATE_FILE="$HOME/.config/claude-burst/compaction-state.json"
COMPACT_STATE_MTIME=""
COMPACT_PENDING=0
COMPACT_SHOWN=0
COMPACT_OVERLAY_PID=""
# Headless, the mod's starter found it before detaching, since a detached
# process has no Ghostty above it to find.
PANEL_GHOSTTY_PID="${CLAUDE_PANEL_GHOSTTY_PID:-}"
compaction_pending() { # $1 = session id
local m
[ -n "$1" ] && [ -f "$COMPACT_STATE_FILE" ] || return 1
m=$(stat -f %m "$COMPACT_STATE_FILE" 2>/dev/null) || return 1
(( $(panel_now) - m > 900 )) && return 1
if [ "$m|$1" != "$COMPACT_STATE_MTIME" ]; then
COMPACT_STATE_MTIME="$m|$1"
COMPACT_PENDING=$(jq -r --arg p "$1|" \
'[to_entries[] | select(.key | startswith($p)) | select(.value.pending == true)] | length' \
"$COMPACT_STATE_FILE" 2>/dev/null)
fi
(( ${COMPACT_PENDING:-0} > 0 ))
}
# The Ghostty process this panel runs in, so the notice sits over its window.
panel_ghostty_pid() {
if [ -z "$PANEL_GHOSTTY_PID" ]; then
local walk=$$ depth=0
PANEL_GHOSTTY_PID=0
while [ -n "$walk" ] && [ "$walk" -gt 1 ] && [ "$depth" -lt 12 ]; do
if [ "$(ps -o comm= -p "$walk" 2>/dev/null | sed 's|.*/||')" = ghostty ]; then
PANEL_GHOSTTY_PID=$walk
break
fi
walk=$(ps -o ppid= -p "$walk" 2>/dev/null | tr -d ' ')
depth=$(( depth + 1 ))
done
fi
printf '%s' "$PANEL_GHOSTTY_PID"
}
compaction_overlay_tick() { # $1 = session id
panel_option_off CLAUDE_PANEL_COMPACTION_OVERLAY && return 0
[ -x "$HOME/.local/bin/claude-panel-overlay" ] || return 0
if compaction_pending "$1"; then
# Once per compaction: one that outlives the notice's own 10 minutes
# does not bring it back.
(( COMPACT_SHOWN )) && return 0
COMPACT_SHOWN=1
"$HOME/.local/bin/claude-panel-overlay" "$(panel_ghostty_pid)" 600 \
"Async Compaction In Progress" "Async Compaction Finished" >/dev/null 2>&1 &
COMPACT_OVERLAY_PID=$!
elif (( COMPACT_SHOWN )); then
COMPACT_SHOWN=0
[ -n "$COMPACT_OVERLAY_PID" ] && kill -USR1 "$COMPACT_OVERLAY_PID" 2>/dev/null
COMPACT_OVERLAY_PID=""
fi
return 0
}
# ---- gateway alerts: the same floating notice for what Burst runs into ----
# Claude Burst writes what it wants on screen (failed over, network down,
# restarting, ...) to notices.json, newest last. Each new event is shown
# once, one at a time, coloured by severity: info blue, ok green, warn
# amber, error red. Info and ok show for 3s, warnings for 8s. An error is
# sticky: it comes back after any notice that interrupts it, until an ok
# that resolves its kind arrives, or 10 minutes pass. Events from before
# the panel started (2 minutes of grace) are not replayed. The gateway
# cannot report its own death, so the panel checks the dashboard answers
# every 10s and says so after 3 misses in a row.
# Every panel reads the same file, so each event is claimed (mkdir, atomic)
# and only the panel that claims it shows it. An event about one session
# goes to that session's panel, except a handover, which is news for the
# others. Any other event is held until this panel's Ghostty is the app in
# front: each window can be its own Ghostty process, and a notice only shows
# over its own, so the first panel to claim one used to show it later over
# whichever window it lived in, often a session nobody was looking at.
# CLAUDE_PANEL_ALERTS=false turns all of it off.
ALERT_FILE="$HOME/.config/claude-burst/notices.json"
ALERT_MTIME=""
ALERT_LAST_ID=""
ALERT_SINCE=""
ALERT_QUEUE=()
ALERT_HELD=() # events for whichever panel is in front: id, at, then the alert_take fields
ALERT_HELD_FOR=600 # seconds an event waits for a Ghostty to come to the front
ALERT_PID=""
ALERT_IS_STICKY=0
ALERT_STICKY="" # severity, title, detail, kind (\x1f separated)
ALERT_STICKY_UNTIL=0
ALERT_HEALTH_AT=0
ALERT_HEALTH_MISSES=0
ALERT_GW_DOWN=0
ALERT_CLAIMS="$HOME/.config/claude-panel/alerts-claimed"
ALERT_CLAIMS_SWEPT=0
# Claims an event for this panel; fails when another panel already has it.
alert_claim() { # $1 = event id
if (( ! ALERT_CLAIMS_SWEPT )); then
ALERT_CLAIMS_SWEPT=1
mkdir -p "$ALERT_CLAIMS" 2>/dev/null
find "$ALERT_CLAIMS" -mindepth 1 -maxdepth 1 -mmin +1440 -exec rmdir {} + 2>/dev/null
fi
mkdir "$ALERT_CLAIMS/$1" 2>/dev/null
}
# New events from notices.json since the last read, one per line:
# severity, kind, title, detail, resolves, id, session, separated by \x1f (a tab
# is whitespace to read, so an empty detail would shift the fields).
alert_new_events() {
local m
[ -f "$ALERT_FILE" ] || return 0
m=$(stat -f %m "$ALERT_FILE" 2>/dev/null) || return 0
[ "$m" = "$ALERT_MTIME" ] && return 0
ALERT_MTIME="$m"
jq -r --arg last "$ALERT_LAST_ID" --argjson since "${ALERT_SINCE:-0}" '
(.events // []) as $e
| ($e | map(.id) | index($last)) as $i
| (if ($last != "" and $i != null) then $e[$i+1:] else [$e[] | select(.ts > $since)] end)[]
| [.severity, .kind, .title, (.detail // ""), (.resolves // ""), .id, (.session // "")]
| map(gsub("[\u001f\n]"; " ")) | join("\u001f")' "$ALERT_FILE" 2>/dev/null
}
# Takes one event in: an ok that resolves the sticky error ends it; an
# error becomes the sticky one; everything else joins the queue.
alert_take() { # severity kind title detail resolves
local sev="$1" kind="$2" title="$3" detail="$4" resolves="$5"
if [ -n "$resolves" ] && [ -n "$ALERT_STICKY" ] && [ "$resolves" = "$(printf '%s' "$ALERT_STICKY" | cut -d $'\x1f' -f4)" ]; then
ALERT_STICKY=""
if (( ALERT_IS_STICKY )) && [ -n "$ALERT_PID" ]; then
kill "$ALERT_PID" 2>/dev/null
ALERT_PID=""
fi
fi
if [ "$sev" = error ]; then
ALERT_STICKY=$(printf '%s\037%s\037%s\037%s' "$sev" "$title" "$detail" "$kind")
ALERT_STICKY_UNTIL=$(( $(panel_now) + 600 ))
# Shown now, not after the queue: an error outranks what is waiting.
if alert_alive; then
kill "$ALERT_PID" 2>/dev/null
fi
ALERT_PID=""
return 0
fi
ALERT_QUEUE+=("$(printf '%s\037%s\037%s' "$sev" "$title" "$detail")")
}
alert_show() { # severity seconds title detail
"$HOME/.local/bin/claude-panel-overlay" "$(panel_ghostty_pid)" "$2" "$3" "" "$1" "$4" >/dev/null 2>&1 &
ALERT_PID=$!
}
# Whether the notice on screen is still up. Not kill -0 alone: a notice that
# has exited but not yet been reaped answers it, and the queue would wait on
# a zombie.
alert_alive() {
local st
[ -n "$ALERT_PID" ] || return 1
st=$(ps -o stat= -p "$ALERT_PID" 2>/dev/null) || return 1
case "$st" in ''|Z*) return 1 ;; esac
return 0
}
# The panel's own check that the gateway answers: its dashboard, every 10s.
alert_health_tick() {
local url now
url=$(panel_gateway_url)
[ -n "$url" ] || return 0
now=$(panel_now)
(( now - ALERT_HEALTH_AT /dev/null; then
ALERT_HEALTH_MISSES=0
if (( ALERT_GW_DOWN )); then
ALERT_GW_DOWN=0
rmdir "$ALERT_CLAIMS/panel-gateway-down" 2>/dev/null
for item in ${ALERT_HELD[@]+"${ALERT_HELD[@]}"}; do
[ "${item%%$'\x1f'*}" = panel-gateway-down ] || keep+=("$item")
done
ALERT_HELD=(${keep[@]+"${keep[@]}"})
alert_resolve panel-gateway
ALERT_HELD+=("$(printf '%s\037%s\037%s\037%s\037%s\037%s\037%s' panel-gateway-back "$now" ok panel-gateway "Burst gateway back" "Its dashboard answers again." panel-gateway)")
fi
else
ALERT_HEALTH_MISSES=$(( ALERT_HEALTH_MISSES + 1 ))
# A claim left by a panel that closed mid-outage lapses after 15 minutes.
find "$ALERT_CLAIMS" -maxdepth 1 -name panel-gateway-down -mmin +15 -exec rmdir {} + 2>/dev/null
if (( ALERT_HEALTH_MISSES == 3 )); then
ALERT_GW_DOWN=1
rmdir "$ALERT_CLAIMS/panel-gateway-back" 2>/dev/null
ALERT_HELD+=("$(printf '%s\037%s\037%s\037%s\037%s\037%s\037%s' panel-gateway-down "$now" error panel-gateway "Burst gateway not responding" "Its dashboard has not answered for 30 seconds. Click [View] for the support console: what happened and a Restart button." "")")
fi
fi
}
# The frontmost app's pid. A function so the tests can say who is in front.
panel_front_pid() {
"$HOME/.local/bin/claude-panel-overlay" --front-pid 2>/dev/null
}
# Ends this panel's sticky error when $1 names its kind.
alert_resolve() { # $1 = kind an ok resolves
[ -n "$1" ] && [ -n "$ALERT_STICKY" ] || return 0
[ "$1" = "$(printf '%s' "$ALERT_STICKY" | cut -d $'\x1f' -f4)" ] || return 0
ALERT_STICKY=""
if (( ALERT_IS_STICKY )) && [ -n "$ALERT_PID" ]; then
kill "$ALERT_PID" 2>/dev/null
ALERT_PID=""
fi
}
# Held events: shown here only while this panel's Ghostty is in front, and
# only if no other panel took them first; dropped after ALERT_HELD_FOR.
alert_held_tick() { # $1 = now
(( ${#ALERT_HELD[@]} )) || return 0
local front item id at sev kind title detail resolves keep=()
front=$(panel_front_pid)
for item in "${ALERT_HELD[@]}"; do
IFS=$'\x1f' read -r id at sev kind title detail resolves <<< "$item"
[ -d "$ALERT_CLAIMS/$id" ] && continue
(( $1 - at < ALERT_HELD_FOR )) || continue
if [ -n "$front" ] && [ "$front" = "$(panel_ghostty_pid)" ]; then
alert_claim "$id" && alert_take "$sev" "$kind" "$title" "$detail" "$resolves"
continue
fi
keep+=("$item")
done
ALERT_HELD=(${keep[@]+"${keep[@]}"})
}
# Drops the held events of a kind no panel has shown yet; true when it
# dropped any.
alert_held_drop_kind() { # $1 = kind
(( ${#ALERT_HELD[@]} )) || return 1
local item id at sev kind rest keep=() dropped=1
for item in "${ALERT_HELD[@]}"; do
IFS=$'\x1f' read -r id at sev kind rest <<< "$item"
if [ "$kind" = "$1" ] && [ ! -d "$ALERT_CLAIMS/$id" ]; then
dropped=0
continue
fi
keep+=("$item")
done
ALERT_HELD=(${keep[@]+"${keep[@]}"})
return $dropped
}
gateway_alerts_tick() { # $1 = this panel's session id
local own="${1:-}"
panel_option_off CLAUDE_PANEL_ALERTS && return 0
[ -x "$HOME/.local/bin/claude-panel-overlay" ] || return 0
local now sev kind title detail resolves id session item secs
now=$(panel_now)
[ -n "$ALERT_SINCE" ] || ALERT_SINCE=$(( now - 120 ))
while IFS=$'\x1f' read -r sev kind title detail resolves id session; do
[ -n "$id" ] || continue
ALERT_LAST_ID="$id"
# An ok ends this panel's own sticky error whoever shows the ok.
alert_resolve "$resolves"
if [ -n "$session" ] && [ "$kind" != handover ]; then
[ "$session" = "$own" ] || continue
alert_claim "$id" || continue
alert_take "$sev" "$kind" "$title" "$detail" "$resolves"
continue
fi
[ "$kind" = handover ] && [ "$session" = "$own" ] && continue
# A newer event of a kind replaces a held one of that kind, and an ok
# that resolves held events nobody saw cancels them and itself: on
# 4 Oct 2026 a phone out of data made five failover and back pairs in
# four minutes, all held, then shown ten minutes later as a flapping
# failover that was long over.
alert_held_drop_kind "$kind" && [ -n "$resolves" ] && [ "$resolves" = "$kind" ] && continue
if [ -n "$resolves" ] && [ "$resolves" != "$kind" ]; then
alert_held_drop_kind "$resolves" && continue
fi
ALERT_HELD+=("$(printf '%s\037%s\037%s\037%s\037%s\037%s\037%s' "$id" "$now" "$sev" "$kind" "$title" "$detail" "$resolves")")
done < 0 )); then
kill "$ALERT_PID" 2>/dev/null
else
return 0
fi
fi
ALERT_PID=""
if (( ${#ALERT_QUEUE[@]} > 0 )); then
item="${ALERT_QUEUE[0]}"
ALERT_QUEUE=("${ALERT_QUEUE[@]:1}")
IFS=$'\x1f' read -r sev title detail <<= ALERT_STICKY_UNTIL )); then
ALERT_STICKY=""
return 0
fi
IFS=$'\x1f' read -r sev title detail kind <</dev/null | tail -1)
v="${v#*=}"
fi
v=$(printf '%s' "$v" | tr -d '"'"'"' _,')
case "$v" in
''|*[!0-9]*) printf '%s' "$2" ;;
*) printf '%s' "$((10#$v))" ;;
esac
}
# A dollar option: a plain non-negative number with at most one point, else
# the default ($2). Same precedence and tolerance as the two above.
panel_option_usd() { # $1 = KEY, $2 = default
local v="${!1:-}"
if [ -z "$v" ]; then
v=$(grep -E "^$1=" "$HOME/.config/claude-panel/options" 2>/dev/null | tail -1)
v="${v#*=}"
fi
v=$(printf '%s' "$v" | tr -d '"'"'"' $')
case "$v" in
''|.|*[!0-9.]*|*.*.*) printf '%s' "$2" ;;
*) printf '%s' "$v" ;;
esac
}
# CLAUDE_PANEL_RESTART_TOKENS (default 400000; 0 turns it off): once this
# session's context reaches it, a bold red line says to restart. A token
# count rather than a percentage, because the cost of a long context is per
# token -- every turn re-reads it -- whether the window is 200k or 1M.
restart_banner() { # $1 = context tokens
local limit
limit=$(panel_option_int CLAUDE_PANEL_RESTART_TOKENS 400000)
[ "$limit" -gt 0 ] && [ "${1:-0}" -ge "$limit" ] || return 0
restart_banner_line off
printf '\n'
}
# The banner in one of its two flash states, without a newline: "on" is
# reverse video (a solid red bar), "off" is the plain bold red text. The main
# loop alternates them between refreshes (flash_restart_banner). SGR 5 blink
# was tried first and Ghostty does not render it.
RESTART_BANNER_TEXT='*** RESTART DUE TO HIGH CONTEXT ***'
restart_banner_line() { # $1 = on|off
local rev=""
[ "$1" = on ] && rev=$'\033[7m'
printf ' %s%s%s%s%s' "$C_BOLD" "$C_RED" "$rev" "$RESTART_BANNER_TEXT" "$C_RESET"
}
# Waits out one refresh interval like the plain `sleep & wait` it replaces,
# but when the frame on screen carries the restart banner, redraws just that
# row once a second in alternating states so it flashes. Only that one row
# is written, and only while the banner is up, so a pane with a normal
# context costs no more than before. Each step is a backgrounded, waited-on
# sleep for the same reason as the main loop's: traps must not wait a tier.
flash_restart_banner() { # $1 = seconds to wait, $2 = frame on screen
local row state=on i
row=$(printf '%s\n' "$2" | grep -n -F -m1 "$RESTART_BANNER_TEXT" | cut -d: -f1)
if [ -z "$row" ]; then
panel_sleep "$1"
return
fi
for (( i = 0; i /dev/null | awk '{print $2}')
case "$ccols" in ''|*[!0-9]*|0) return 0 ;; esac
pct=$(( ($1 * 100 + ($1 + ccols) / 2) / ($1 + ccols) ))
(( pct 50 )) && pct=50
now="$1:$ccols"
if [ "$now" != "$_width_seen" ]; then
_width_seen="$now"
return 0
fi
[ "$(cat "$PANEL_WIDTH_FILE" 2>/dev/null)" = "$pct" ] && return 0
mkdir -p "$(dirname "$PANEL_WIDTH_FILE")" 2>/dev/null
printf '%s\n' "$pct" > "$PANEL_WIDTH_FILE.$$" 2>/dev/null \
&& mv -f "$PANEL_WIDTH_FILE.$$" "$PANEL_WIDTH_FILE" 2>/dev/null
}
# ---- close button ----
# An [X] in the top-right corner closes the panel with a click. In the split
# the launcher opened (it types CLAUDE_PANEL_SPLIT=1 before the command) the
# split closes too, since that pane exists only to show the panel; run by
# hand, the panel just exits back to the prompt.
#
# The click arrives as xterm mouse reporting (1000 = press and release, 1006
# = SGR encoding: ESC [ <button command>/dev/null 2>&1 || return 0
local cfg="$HOME/.config/claude-burst/config.json" a
[ -f "$cfg" ] || return 0
a=$(jq -r '.admin_listen // "127.0.0.1:7788"' "$cfg" 2>/dev/null)
case "$a" in ''|off|null) return 0 ;; esac
printf 'http://%s/' "$a"
}
# Where [View] goes: the dashboard when it answers, else Burst's support
# console (its own process, up when the gateway is not: audit, log,
# Restart and Repair). console_listen in config.json, 127.0.0.1:7789
# unless changed.
panel_view_target() {
local cfg="$HOME/.config/claude-burst/config.json" c
if curl -s -o /dev/null -m 1 "$PANEL_GW_URL" 2>/dev/null; then
printf '%s' "$PANEL_GW_URL"
return
fi
c=$(jq -r '.console_listen // "127.0.0.1:7789"' "$cfg" 2>/dev/null)
case "$c" in ''|off|null) printf '%s' "$PANEL_GW_URL" ;; *) printf 'http://%s/' "$c" ;; esac
}
# " [View]" for the end of the Proxy State line, when there is a dashboard.
panel_view_tag() {
(( PANEL_CLOSE )) || return 0
[ -n "$(panel_gateway_url)" ] || return 0
printf ' %s%s%s' "$C_BTN_VIEW" "$PANEL_GW_LABEL" "$C_RESET"
}
# Where [View] landed in a frame drawn from row 1: sets PANEL_GW_ROW and
# PANEL_GW_COL, 0 when it is not there. The line's one emoji is two
# columns wide, hence the +1.
panel_locate_view() { # $1 = the frame text
local LC_ALL=en_US.UTF-8 n=0 line pre
PANEL_GW_ROW=0 PANEL_GW_COL=0
while IFS= read -r line; do
n=$(( n + 1 ))
case "$line" in *"Proxy State:"*) ;; *) continue ;; esac
line=$(printf '%s' "$line" | sed $'s/\e\\[[0-9;]*m//g')
case "$line" in *"$PANEL_GW_LABEL"*) ;; *) return 0 ;; esac
pre=${line%%"$PANEL_GW_LABEL"*}
PANEL_GW_ROW=$n PANEL_GW_COL=$(( ${#pre} + 2 ))
return 0
done <<< "$1"
}
draw_close_button() { # $1 = pane columns
(( PANEL_CLOSE )) || return 0
PANEL_GW_URL=$(panel_gateway_url)
printf '\033[1;%dH%s[X]%s' "$(panel_close_col "$1")" "$C_BTN_CLOSE" "$C_RESET"
}
# Which button, if any, a left-button press in PANEL_INBUF landed on:
# sets PANEL_CLICK to close, gateway or nothing. Consumes the buffer
# either way, keeping only an incomplete trailing sequence.
panel_read_clicks() { # $1 = pane columns
# Every complete mouse report is consumed (releases, other buttons);
# only a left-button press (0 ... M) on a button counts: the [X] on row 1,
# [View] where panel_locate_view found it. A close in the same read wins.
local re=$'\e\\[= col )); then
PANEL_CLICK=close
elif [ "$PANEL_CLICK" != close ] && [ -n "$PANEL_GW_URL" ] && (( PANEL_GW_ROW > 0 && r == PANEL_GW_ROW && c >= PANEL_GW_COL && c 32 )) && PANEL_INBUF=""
return 0
}
# Was there a left-button press on the [X]?
panel_clicked_close() { # $1 = pane columns
panel_read_clicks "$1"
[ "$PANEL_CLICK" = close ]
}
# Close the panel, and in the launcher's split the split as well, by
# hanging up the pane's own shell. Only a shell on this same terminal: under
# tmux the parent is the server, and exiting is already what closes the pane.
panel_close() {
trap - EXIT INT TERM
declare -F restore_tty >/dev/null && restore_tty
if [ "${CLAUDE_PANEL_SPLIT:-}" = 1 ]; then
local pcomm ptty mytty
pcomm=$(ps -o comm= -p "$PPID" 2>/dev/null)
ptty=$(ps -o tty= -p "$PPID" 2>/dev/null | tr -d ' ')
mytty=$(ps -o tty= -p "$$" 2>/dev/null | tr -d ' ')
case "${pcomm##*/}" in
-zsh|zsh|-bash|bash|-sh|sh|-fish|fish)
if [ -n "$mytty" ] && [ "$mytty" != "??" ] && [ "$ptty" = "$mytty" ]; then
kill -HUP "$PPID" 2>/dev/null
fi
;;
esac
fi
exit 0
}
# Read whatever is waiting on the terminal for up to $1 seconds (0 = only
# what is already there) and close on a click on the [X]. Without the
# button this is the old discard, so typed text never reaches the prompt.
panel_poll_input() { # $1 = seconds
local c t="${1:-0}"
if (( ! PANEL_CLOSE )); then
drain_stdin
return 0
fi
[ "$t" = 0 ] && t=0.01
c=""
read -r -s -t "$t" -n 64 c 2>/dev/null
PANEL_INBUF+="$c"
panel_read_clicks "${COLS:-80}"
case "$PANEL_CLICK" in
close) panel_close ;;
gateway) open "$(panel_view_target)" >/dev/null 2>&1 & ;;
esac
return 0
}
# sleep $1, answering clicks meanwhile. Without the button it is the old
# backgrounded sleep, which a signal interrupts at once (see the main loop).
panel_sleep() { # $1 = whole seconds
if (( ! PANEL_CLOSE )); then
sleep "$1" &
wait $! 2>/dev/null
return 0
fi
local end=$(( SECONDS + $1 ))
while (( SECONDS "$PANEL_ERR_FILE"
RECENT_JSON=$(recent_sections_fetch 2>>"$PANEL_ERR_FILE")
refresh_active_block
}
# ---- headless: the same panel, drawn by the Claude Code mod ---------------
# PANEL_HEADLESS=1 ccusage-panel.sh runs
# this loop with nothing drawn: every tick writes what the pane would have
# shown, as numbers, to mod/.json, and the usage-panel mod draws
# it in a sidebar inside Claude Code. Everything that computes a figure is the
# pane's own code, run at the pane's own two tiers; only the drawing moved.
# The alerts over Ghostty still come from here, as they did from the pane.
#
# It runs only while the mod wants it: the mod touches mod/.alive on every
# refresh, and a file older than MOD_ALIVE_SECS ends this loop. One per
# session, held by mod/.pid.
MOD_DIR="$HOME/.cache/ccusage-panel-cache/mod"
MOD_ALIVE_SECS="${PANEL_MOD_ALIVE_SECS:-90}"
mod_alive() { # $1 = session id
local f="$MOD_DIR/$1.alive" m
m=$(stat -f %m "$f" 2>/dev/null) || return 1
(( $(panel_now) - m <= MOD_ALIVE_SECS ))
}
# Claims mod/.pid for this process. False when another live process holds
# it. The same pid holds it across restart_if_changed's exec.
mod_claim() { # $1 = session id
local f="$MOD_DIR/$1.pid" held
mkdir -p "$MOD_DIR"
held=$(cat "$f" 2>/dev/null)
if [ -n "$held" ] && [ "$held" != "$$" ] && kill -0 "$held" 2>/dev/null; then
return 1
fi
printf '%s\n' "$$" > "$f.$$.tmp" && mv -f "$f.$$.tmp" "$f"
}
# A colour code from the tier helpers, as the word the mod draws it with.
tier_name() { # $1 = colour code
case "$1" in
"$C_GREEN") printf green ;;
"$C_YELLOW") printf yellow ;;
"$C_RED") printf red ;;
"$C_MAGENTA") printf purple ;;
"$C_CYAN") printf cyan ;;
*) printf '' ;;
esac
}
# Writes mod/.json: the figures build_summary and build_trailing computed
# on the last slow tick, this tick's turn figures, and the series behind the
# graphs. Replaced whole, by rename, so the mod never reads half a file.
mod_json_write() { # $1 = session id
local sid="$1" out="$MOD_DIR/$1.json"
[ -n "$sid" ] || return 0
mkdir -p "$MOD_DIR"
local sess_tier="" rate_tier="" today_tier="" pred_tier="" ctx_tier="" spend_tier="" avg_tier="" model_tier=""
[ -n "${sc:-}" ] && sess_tier=$(tier_name "$sc")
[ -n "${src:-}" ] && rate_tier=$(tier_name "$src")
[ -n "${tc:-}" ] && today_tier=$(tier_name "$tc")
[ -n "${pc:-}" ] && pred_tier=$(tier_name "$pc")
[ -n "${spendc:-}" ] && spend_tier=$(tier_name "$spendc")
[ -n "${avgc:-}" ] && avg_tier=$(tier_name "$avgc")
[ -n "${mtc:-}" ] && model_tier=$(tier_name "$mtc")
if [ -n "$SESS_CTX" ] && [ -n "$SESS_WIN" ] && [ "$SESS_WIN" != 0 ]; then
ctx_tier=$(tier_name "$(ctx_tier_color "$(awk -v t="$SESS_CTX" -v w="$SESS_WIN" 'BEGIN{printf "%.0f", t*100/w}')" "$CTX_YELLOW" "$CTX_RED" "$CTX_PURPLE")")
fi
local sess_rate_now="" sess_rate_tier=""
if [ -n "$SESS_COST" ] && [ -n "${sess_elapsed_h:-}" ]; then
sess_rate_now=$(awk -v c="$SESS_COST" -v h="$sess_elapsed_h" 'BEGIN{ printf "%.4f", c/h }')
sess_rate_tier=$(tier_name "$(threshold_color "$sess_rate_now" "$BURN_YELLOW" "$BURN_RED")")
fi
local errs_file="${PANEL_ERR_FILE:-/dev/null}"
MJ_SID="$sid" MJ_NOW="$(panel_now)" MJ_SLOW_AT="${last_slow:-0}" \
MJ_REFRESH="$REFRESH" MJ_SLOW_REFRESH="$SLOW_REFRESH" \
MJ_MODEL="${model_label:-}" MJ_MODEL_ID="${model_id:-}" MJ_MODEL_TIER="$model_tier" \
MJ_FOLDER="${folder_name:-}" MJ_FOLDER_SPEND="${proj_spend:-}" \
MJ_SESS_COST="$SESS_COST" MJ_SESS_TIER="$sess_tier" MJ_SESS_RATE="$sess_rate_now" MJ_SESS_RATE_TIER="$sess_rate_tier" \
MJ_SESS_START="${sess_start_epoch:-0}" MJ_AVG_SESSION="${avg_session_cost:-0}" \
MJ_CTX="$SESS_CTX" MJ_WIN="$SESS_WIN" MJ_CTX_TIER="$ctx_tier" MJ_COMPACTING="$SESS_COMPACTING" \
MJ_RESTART_TOKENS="$(panel_option_int CLAUDE_PANEL_RESTART_TOKENS 400000)" \
MJ_TODAY="${today_amt:-}" MJ_TODAY_TIER="$today_tier" MJ_PRED="${today_pred:-}" MJ_PRED_TIER="$pred_tier" \
MJ_TODAY_UNPRICED="${today_unpriced:-}" MJ_TYPICAL_SO_FAR="${typical_so_far:-}" \
MJ_BLOCK="${has_block:-0}" MJ_BLK_COST="${blk_cost:-0}" MJ_BLK_CPH="${blk_cph:-0}" MJ_BLK_REM="${blk_rem:-0}" \
MJ_BURN_LABEL="${burn_label:-}" MJ_BURN_TIER="$(tier_name "${burn_color:-}")" \
MJ_SPEND30="${spend30:-0}" MJ_PREV_SPEND30="${prev_spend30:-0}" MJ_SPEND_TIER="$spend_tier" \
MJ_AVG30="${avg_daily_30:-0}" MJ_PREV_AVG30="${prev_avg_daily_30:-0}" MJ_AVG_TIER="$avg_tier" \
MJ_WEEK="${week_cost:-0}" MJ_MONTH="${month_cost:-0}" \
MJ_TOP="${top_rows:-}" MJ_SERIES="$SESS_SERIES" \
MJ_SUMMARY="${summary_block:-}" MJ_TABLE="$SESS_TABLE" \
MJ_ERRORS="$(sort -u "$errs_file" 2>/dev/null | head -5)" \
MJ_THRESHOLDS="$CTX_YELLOW $CTX_RED $CTX_PURPLE $BURN_YELLOW $BURN_RED $TIER_YELLOW_MULT $TIER_RED_MULT" \
MJ_HOURLY="${HOURLY_BUCKET_CACHE:-}" \
MJ_BURST_DASHBOARD="$(panel_gateway_url)" MJ_BURST_CONSOLE="$(burst_console_url)" \
python3 - "$out" <>"$errs_file"
import json, os, sys, time
from datetime import datetime, timedelta
out = sys.argv[1]
E = os.environ
def num(k):
try:
return float(E.get(k, ""))
except ValueError:
return None
def text(k):
return E.get(k, "")
def jload(s):
try:
return json.loads(s)
except (ValueError, TypeError):
return None
def decode_project(name):
"""Claude Code names a project's directory by its path with every '/'
and '.' made '-'. Rebuilt against the disk one level at a time, taking
the longest entry whose own encoding matches, so a name with dashes or
dots in it survives; the last component is what is shown. When the
disk no longer has it, the encoded name is shown as it is."""
rest, path = name, "/"
while rest:
if not rest.startswith("-"):
return name
rest = rest[1:]
try:
entries = os.listdir(path)
except OSError:
return name
best = ""
for e in entries:
enc = e.replace("/", "-").replace(".", "-")
if (rest == enc or rest.startswith(enc + "-")) and len(enc) > len(best.replace(".", "-")):
if os.path.isdir(os.path.join(path, e)):
best = e
if not best:
return name
path = os.path.join(path, best)
rest = rest[len(best):]
return os.path.basename(path) or name
def jfile(k):
try:
with open(E.get(k, "")) as f:
return json.load(f)
except (OSError, ValueError, TypeError):
return None
recent = jfile("MJ_RECENT_FILE") or {}
daily = []
for d in (recent.get("daily") or [])[-30:]:
daily.append({
"d": d.get("period") or d.get("date"),
"cost": round(d.get("totalCost") or 0, 4),
"tokens": d.get("totalTokens") or 0,
"models": {m.get("modelName"): round(m.get("cost") or 0, 4) for m in d.get("modelBreakdowns") or []},
})
hourly = None
try:
with open(E.get("MJ_HOURLY", "")) as f:
hb = json.load(f)
hourly = [0.0] * 24
for b in hb.get("buckets", []):
h = int(b.get("hour", -1))
if 0 <= h < 24:
hourly[h] = round(b.get("avgCost") or 0, 4)
except (OSError, ValueError, TypeError):
pass
projects = []
sess = jfile("MJ_ALL_SESS_FILE") or {}
since = (datetime.now() - timedelta(days=29)).strftime("%Y-%m-%d")
by_proj = {}
for s in sess.get("session") or []:
last = (s.get("lastActivity") or (s.get("metadata") or {}).get("lastActivity") or "")[:10]
if last and last 0:
projects.append({"name": decode_project(p) if p else "unknown", "cost": round(c, 2)})
top = []
for line in E.get("MJ_TOP", "").splitlines():
f = line.split("\t")
if len(f) /dev/null)
case "$c" in ''|off|null) ;; *) printf 'http://%s/' "$c" ;; esac
}
# Files of sessions whose mod has gone, after two days.
mod_prune() {
find "$MOD_DIR" -maxdepth 1 -type f -mtime +2 -delete 2>/dev/null
}
headless_main() {
# hsid, not sid: build_trailing reads rows into a variable named sid, and
# bash's dynamic scoping would hand it this one.
local hsid="$PIN_SESSION_ID" tmp_s tmp_t tmp_r tmp_a
[ -n "$hsid" ] || { echo "headless: no session id" >&2; return 2; }
mod_claim "$hsid" || return 0
PIN_SOURCE=mod
COLS="${PANEL_HEADLESS_COLS:-60}"
cols="$COLS"
export COLS
tmp_s=$(mktemp "${TMPDIR:-/tmp}/ccusage-mod-s.XXXXXX")
tmp_t=$(mktemp "${TMPDIR:-/tmp}/ccusage-mod-t.XXXXXX")
tmp_r=$(mktemp "${TMPDIR:-/tmp}/ccusage-mod-r.XXXXXX")
tmp_a=$(mktemp "${TMPDIR:-/tmp}/ccusage-mod-a.XXXXXX")
# shellcheck disable=SC2064
trap "rm -f '$tmp_s' '$tmp_t' '$tmp_r' '$tmp_a'; [ \"\$(cat '$MOD_DIR/$hsid.pid' 2>/dev/null)\" = \"\$\$\" ] && rm -f '$MOD_DIR/$hsid.pid'" EXIT
mod_prune
while mod_alive "$hsid"; do
restart_if_changed "$REFRESH" "$TURN_ROWS" "$hsid"
now_epoch=$(panel_now)
resolve_session
compaction_overlay_tick "$hsid"
gateway_alerts_tick "$hsid"
session_stats_refresh
slow_due=0
slow_frame_due "$now_epoch" && slow_due=1
(( slow_due )) && slow_fetch
block_clock_tick
if (( slow_due )); then
# Run in this shell, not a $(...), so the figures each builder
# computes on the way are still set when mod_json_write reads them.
build_summary > "$tmp_s" 2>>"$PANEL_ERR_FILE"
summary_block=$(cat "$tmp_s")
build_trailing > "$tmp_t" 2>>"$PANEL_ERR_FILE"
band_write "$hsid" "$summary_block"
# The two reports behind the graphs, to files: too big for the
# environment the writer gets everything else through.
printf '%s' "$RECENT_JSON" > "$tmp_r"
printf '%s' "${all_sess:-}" > "$tmp_a"
last_slow=$now_epoch
last_cols=$cols
last_model_label="${model_label:-}"
fi
MJ_RECENT_FILE="$tmp_r" MJ_ALL_SESS_FILE="$tmp_a" mod_json_write "$hsid"
panel_sleep "$REFRESH"
done
}
# Test seam: source this file with PANEL_LIB_ONLY=1 to get every function
# above without entering the render loop. The tty setup further up is
# already guarded by `[ -t 0 ]`, so a sourced panel touches no terminal and
# installs no traps.
if [ -n "${PANEL_LIB_ONLY:-}" ]; then
return 0 2>/dev/null || exit 0
fi
# Headless for the Claude Code mod: none of the terminal set-up below.
if [ -n "${PANEL_HEADLESS:-}" ]; then
headless_main
exit $?
fi
# CLAUDE_PANEL_CAFFEINATE (options file, see panel_option): keep the Mac
# awake for as long as this panel runs. `caffeinate -w` watches our pid
# rather than wrapping our command line, so the panel's argv -- which the
# launcher's pgrep and the pane walk both match on -- is unchanged. The
# exported marker stops restart_if_changed's exec (same pid) from starting
# a second one.
if panel_option CLAUDE_PANEL_CAFFEINATE && [ "${CLAUDE_PANEL_CAFFEINATED:-}" != "$$" ] \
&& command -v caffeinate >/dev/null 2>&1; then
caffeinate -i -w "$$" >/dev/null 2>&1 &
export CLAUDE_PANEL_CAFFEINATED="$$"
fi
if [ -n "${ORIG_STTY:-}" ] && [ -t 1 ] && ! panel_option_off CLAUDE_PANEL_CLOSE_BUTTON; then
PANEL_CLOSE=1
# 1004 is focus reporting: the terminal sends ESC [ I when this pane is
# focused again, see panel_read_clicks.
printf '\033[?1000h\033[?1006h\033[?1004h'
fi
# A resize redraws at once rather than at the next tick.
trap 'PANEL_REDRAW=1' WINCH
last_frame=""
last_size=""
PANEL_REDRAW=0
while true; do
restart_if_changed
# Cursor-home only, NOT a full \033[2J clear, a full clear blanks the
# whole pane for one frame before the redraw lands, which reads as a
# visible flicker every refresh. Staying purely additive-overwrite only
# works because clear_eol() (above) truncates every line to $COLS, so a
# frame's physical row count can never silently exceed $rows and desync
# this cursor-home overwrite against the previous frame.
# `tput cols`/`tput lines` run inside $(...) have their OWN stdout
# redirected to the capture pipe, so the ioctl they'd normally use to ask
# the terminal for its real size fails and they silently return the
# compiled-in terminfo default (80x24), a fixed ceiling that has nothing
# to do with the pane's actual height. `stty size` doesn't have this
# problem because it reads the size off the fd it's given, so pointing it
# at fd3 (see above) gets the real, live pane dimensions.
read -r rows cols < <(stty size /dev/null)
[ -z "$cols" ] && cols=60
[ -z "$rows" ] && rows=24
(( cols < 40 )) && cols=40
(( rows >"$PANEL_ERR_FILE")
trailing_raw=$(build_trailing 2>>"$PANEL_ERR_FILE")
band_write "$(basename "${latest:-}" .jsonl)" "$summary_block"
last_slow=$now_epoch
last_cols=$cols
last_model_label="${model_label:-}"
fi
# Everything through the per-turn table is GUARANTEED, printed in full,
# never truncated, even on a short pane, so "show N turns" always means
# N turns, not "N turns if there's room after the other sections." Only
# the sections below it compete for whatever pane height is left over.
# At most three lines, so a burst of failures cannot push the turn table
# off a short pane -- but say how many there are, or three of eight reads
# as all of them.
errs=""
if [ -s "$PANEL_ERR_FILE" ]; then
err_n=$(sort -u "$PANEL_ERR_FILE" | wc -l | tr -d ' ')
errs=$(sort -u "$PANEL_ERR_FILE" | head -3 | while IFS= read -r e; do
printf ' %s! %s%s\n' "$C_RED" "${e:0:$(( cols > 8 ? cols - 5 : 40 ))}" "$C_RESET"
done)
if (( err_n > 3 )); then
errs="$errs"$'\n'"$(printf ' %s! and %d more failure(s)%s' "$C_RED" "$(( err_n - 3 ))" "$C_RESET")"
fi
fi
guaranteed="$summary_block"${errs:+$'\n'"$errs"}$'\n'"$(build_session_table 2>>"$PANEL_ERR_FILE")"
used_lines=$(printf '%s\n' "$guaranteed" | wc -l | tr -d ' ')
remaining=$(( rows - 1 - used_lines ))
# Both blocks are written to the terminal once, together, below,
# previously the guaranteed block was printed immediately and the trailing
# Recent/Top Sessions block followed seconds later (once its several
# sequential `ccusage ...` calls finished), so every refresh visibly
# redrew in two separate passes. A slow trailing fetch delays the whole
# frame instead of half-updating it: the previous frame just stays up a
# little longer, which reads as a pause, not a tear.
trailing=""
if (( remaining > 0 )) && [ -n "$trailing_raw" ]; then
trailing=$(printf '%s\n' "$trailing_raw" | head -n "$remaining")
fi
# Write only when the frame actually differs from the one already on
# screen. On a pane between slow ticks nothing in it can have moved unless
# a turn landed: the summary block and the trailing sections are rebuilt on
# the slow tier, and the header's clock string is rebuilt with them, so
# eleven of every twelve fast ticks compose a frame identical to the last.
#
# The saving is not mostly ours. Every write is a repaint in the terminal
# emulator too, and that cost is charged to Ghostty, once per open panel --
# so it is the part that scales with the number of Claude Code sessions
# running, which is the whole reason this pane is cheap to leave open.
#
# No separate periodic repaint is needed: a slow tick rebuilds the header
# with a new clock string, so the frame always differs at least once every
# $SLOW_REFRESH and the pane cannot sit stale after an external scribble.
frame="$guaranteed"$'\n'"$trailing"
if [ "$frame" != "$last_frame" ]; then
printf '\033[H'
printf '%s\n' "$guaranteed" | clear_eol
[ -n "$trailing" ] && printf '%s\n' "$trailing" | clear_eol
printf '\033[0J'
draw_close_button "$cols"
panel_locate_view "$guaranteed"
last_frame="$frame"
fi
# Backgrounded and waited on, not a plain `sleep`. Bash defers every trap
# until the current FOREGROUND child returns, so with a bare `sleep
# $REFRESH` a Ctrl-C or a `kill` sat unanswered for up to a full tier --
# measured at 9.06s on the 10s default. `wait` is interruptible, so the
# handler runs the moment the signal lands. The orphaned sleep exits on
# its own a few seconds later and costs nothing.
flash_restart_banner "$REFRESH" "$guaranteed"
done
PANEL_EOF
# Mode before rename: the file must already be executable at the instant it
# becomes ccusage-panel.sh, or a panel re-exec'ing in that window finds one
# it cannot run.
chmod +x "$BIN_DIR/.ccusage-panel.sh.new"
# Only a real change replaces it: every open panel re-execs when the file's
# mtime moves, so rewriting identical bytes on each Burst deploy restarted
# every panel for nothing.
if cmp -s "$BIN_DIR/.ccusage-panel.sh.new" "$BIN_DIR/ccusage-panel.sh"; then
rm -f "$BIN_DIR/.ccusage-panel.sh.new"
else
mv -f "$BIN_DIR/.ccusage-panel.sh.new" "$BIN_DIR/ccusage-panel.sh"
fi
echo "Installing ccusage-panel-mod-start (the usage-panel mod's data feed) ..."
# What the usage-panel mod runs every 30 seconds: says the mod is still there
# (mod/.alive), and starts the headless panel for its session when none is
# running. The panel stops by itself once .alive is 90 seconds old, so a
# session that ends takes its panel with it without anyone killing anything.
cat > "$BIN_DIR/.ccusage-panel-mod-start.new" <<'MODSTART_EOF'
#!/usr/bin/env bash
# Usage: ccusage-panel-mod-start
set -uo pipefail
sid="${1:-}" cwd="${2:-$HOME}"
case "$sid" in
''|*[!0-9a-fA-F-]*) echo "ccusage-panel-mod-start: not a session id: '$sid'" >&2; exit 2 ;;
esac
dir="$HOME/.cache/ccusage-panel-cache/mod"
mkdir -p "$dir"
touch "$dir/$sid.alive"
held=$(cat "$dir/$sid.pid" 2>/dev/null)
if [ -n "$held" ] && kill -0 "$held" 2>/dev/null; then
echo running
exit 0
fi
# The Ghostty this session runs in, found now: the panel is detached below,
# and a detached process has no Ghostty above it for the alerts to sit over.
ghostty=0 walk=$$ depth=0
while [ -n "$walk" ] && [ "$walk" -gt 1 ] && [ "$depth" -lt 16 ]; do
if [ "$(ps -o comm= -p "$walk" 2>/dev/null | sed 's|.*/||')" = ghostty ]; then
ghostty=$walk
break
fi
walk=$(ps -o ppid= -p "$walk" 2>/dev/null | tr -d ' ')
depth=$(( depth + 1 ))
done
[ -d "$cwd" ] || cwd="$HOME"
# Twice forked and in a session of its own, so the panel belongs to neither
# this script nor Claude Code, and no signal to the terminal reaches it.
( cd "$cwd" && PANEL_HEADLESS=1 CLAUDE_PANEL_GHOSTTY_PID="$ghostty" \
nohup python3 -c 'import os, sys; os.setsid(); os.execvp(sys.argv[1], sys.argv[1:])' \
bash "$HOME/.local/bin/ccusage-panel.sh" 10 12 "$sid" /dev/null 2>&1 & )
echo started
MODSTART_EOF
chmod +x "$BIN_DIR/.ccusage-panel-mod-start.new"
mv -f "$BIN_DIR/.ccusage-panel-mod-start.new" "$BIN_DIR/ccusage-panel-mod-start"
echo "Installing claude-panel-keyblock (keyboard and click guard for the auto-split) ..."
# Swallows real keyboard input system-wide for a few seconds while
# claude-panel-launch.sh is driving synthetic keystrokes into the new split,
# so typing during that window can't land in the wrong pane or get
# interleaved into the command being typed and corrupt it.
#
# Safety valves against ever getting "stuck blocked":
# - the event tap is owned by this process; macOS tears it down the moment
# the process exits, crashes, or is killed, there is no way to leave
# the keyboard blocked after this process is gone
# - CFRunLoopRunInMode returns on its own after $1 seconds even if no
# events arrive, so the normal path always exits by itself
# - a SIGALRM backstop fires ~2s after that in case the run loop ever
# wedges, and the duration argument is hard-capped at 15s regardless of
# what's passed in
#
# Real vs. synthetic keystrokes are told apart via kCGEventSourceUnixProcessID:
# hardware-originated events report source pid 0; keystrokes that "System
# Events" (osascript's keystroke command) posts on our behalf report ITS
# pid. So real typing gets dropped and the launcher's own automation still
# gets through untouched.
#
# Mouse BUTTONS are swallowed too (movement and scrolling are not). The
# keystrokes are addressed to the Ghostty process, and Ghostty hands them to
# whichever of its splits has focus -- so a click back on the claude pane
# half way through moved the rest of the panel command, Return included,
# into the claude prompt. A click cannot move focus while this runs.
KEYBLOCK_SRC="$(mktemp -t claude-panel-keyblock).c"
cat > "$KEYBLOCK_SRC" <<'KEYBLOCK_EOF'
#include
#include
#include
#include
#include
#include
static CFMachPortRef g_tap;
static CGEventRef tap_callback(CGEventTapProxy proxy, CGEventType type, CGEventRef event, void *refcon) {
(void)proxy; (void)refcon;
/* macOS disables a tap it thinks is slow; turn it straight back on, or
the rest of the guard window silently lets everything through. */
if (type == kCGEventTapDisabledByTimeout || type == kCGEventTapDisabledByUserInput) {
if (g_tap) CGEventTapEnable(g_tap, true);
return event;
}
int64_t source_pid = CGEventGetIntegerValueField(event, kCGEventSourceUnixProcessID);
if (source_pid == 0) {
return NULL; /* hardware-originated keystroke: swallow it */
}
return event; /* synthetic (posted by System Events on our behalf): let it through */
}
static void on_alarm(int sig) {
(void)sig;
_exit(0); /* hard backstop: exit unconditionally, tearing the tap down with us */
}
int main(int argc, char **argv) {
double duration = argc > 1 ? atof(argv[1]) : 2.5;
if (duration 15) duration = 2.5;
signal(SIGALRM, on_alarm);
alarm((unsigned int)duration + 2);
CGEventMask mask = CGEventMaskBit(kCGEventKeyDown)
| CGEventMaskBit(kCGEventKeyUp)
| CGEventMaskBit(kCGEventFlagsChanged)
| CGEventMaskBit(kCGEventLeftMouseDown)
| CGEventMaskBit(kCGEventLeftMouseUp)
| CGEventMaskBit(kCGEventRightMouseDown)
| CGEventMaskBit(kCGEventRightMouseUp)
| CGEventMaskBit(kCGEventOtherMouseDown)
| CGEventMaskBit(kCGEventOtherMouseUp);
CFMachPortRef tap = CGEventTapCreate(kCGSessionEventTap, kCGHeadInsertEventTap,
kCGEventTapOptionDefault, mask, tap_callback, NULL);
g_tap = tap;
if (!tap) {
fprintf(stderr, "claude-panel-keyblock: failed to create event tap "
"(grant Accessibility + Input Monitoring to this binary)\n");
return 1;
}
CFRunLoopSourceRef src = CFMachPortCreateRunLoopSource(kCFAllocatorDefault, tap, 0);
CFRunLoopAddSource(CFRunLoopGetCurrent(), src, kCFRunLoopCommonModes);
CGEventTapEnable(tap, true);
CFRunLoopRunInMode(kCFRunLoopDefaultMode, duration, false);
CGEventTapEnable(tap, false);
CFMachPortInvalidate(tap);
CFRelease(tap);
CFRelease(src);
return 0;
}
KEYBLOCK_EOF
if command -v clang >/dev/null 2>&1; then
if clang -O2 -Wall -framework ApplicationServices -framework CoreFoundation \
-o "$BIN_DIR/claude-panel-keyblock" "$KEYBLOCK_SRC" 2>/tmp/claude-panel-keyblock-build.log; then
chmod +x "$BIN_DIR/claude-panel-keyblock"
echo "Built ~/.local/bin/claude-panel-keyblock."
echo "NOTE: the first time it runs, macOS will ask you to grant it Accessibility"
echo "and Input Monitoring access (System Settings > Privacy & Security), approve"
echo "both, otherwise it just logs a failure and the launcher proceeds unblocked."
else
echo "WARNING: failed to build claude-panel-keyblock (see /tmp/claude-panel-keyblock-build.log)."
echo "The auto-split launcher will still work, just without the keyboard guard."
fi
else
echo "WARNING: no clang found, skipping claude-panel-keyblock (keyboard guard)."
echo "The auto-split launcher will still work, just without the keyboard guard."
fi
rm -f "$KEYBLOCK_SRC"
echo "Installing claude-panel-overlay (floating 'wait to type' notice for the auto-split) ..."
# While the launcher opens the panel split, keyboard focus is on the NEW
# split and the keyboard guard above swallows real input, so for a few
# seconds typing goes nowhere and nothing on screen said so. This shows a
# small floating notice over the Ghostty window until the launcher signals
# that focus is back on the claude pane. CLAUDE_PANEL_LOADING_OVERLAY=false
# in ~/.config/claude-panel/options turns it off. Compiled like the keyboard
# guard; no clang means no notice and the launcher runs exactly as before.
OVERLAY_SRC="$(mktemp -t claude-panel-overlay).m"
cat > "$OVERLAY_SRC" <<'OVERLAY_EOF'
#import
#include
#include
#include
#include
/* claude-panel-overlay [timeout-seconds] [message] [ready-message] [severity] [detail]
*
* A borderless, click-through, NON-ACTIVATING notice near the top centre of
* the given process's front window, shown while claude-panel-launch.sh opens
* the panel split. Focus is on the new split (and the keyboard guard is
* swallowing input) for those few seconds, so typing goes nowhere, and
* without this nothing said so.
*
* It must never take focus itself, or it would cause the very problem it
* reports: the app is an Accessory (no Dock icon, no menu bar) and is never
* activated, the panel cannot become key or main, it is shown with
* orderFrontRegardless, and it ignores the mouse.
*
* Exits on: SIGTERM/SIGINT/SIGHUP (now), SIGUSR1 (shows the ready message,
* "Ready: start typing" unless given, for 0.8s, then exits), its timeout
* (default 10s, at most 900s), or its parent exiting before SIGUSR1. A
* SIGALRM backstop 2s past the timeout exits even if the event loop wedges.
*
* A notice longer than 15s (the usage panel's "Async Compaction In
* Progress") is a status, not a warning about typing: it hides while
* another app is in front, so it never floats over the user's other work,
* and its ready message stays for 2s.
*
* Gateway alerts add [severity] [detail]: info, ok, warn or error colours
* the border (blue, green, amber, red) and makes it a status at any
* length; detail is a smaller second line, truncated to fit. */
@interface OverlayPanel : NSPanel
@end
@implementation OverlayPanel
- (BOOL)canBecomeKeyWindow { return NO; }
- (BOOL)canBecomeMainWindow { return NO; }
@end
static volatile sig_atomic_t g_ready = 0, g_quit = 0;
static void on_usr1(int s) { (void)s; g_ready = 1; }
static void on_term(int s) { (void)s; g_quit = 1; }
static void on_alarm(int s) { (void)s; _exit(0); }
/* Front window bounds of pid, in CoreGraphics global coordinates (top-left
* origin of the primary display). Window list is front to back, so the first
* normal-layer window that is big enough is the one in front. */
static BOOL front_window_of(pid_t pid, CGRect *out) {
CFArrayRef list = CGWindowListCopyWindowInfo(
kCGWindowListOptionOnScreenOnly | kCGWindowListExcludeDesktopElements, kCGNullWindowID);
if (!list) return NO;
BOOL found = NO;
for (CFIndex i = 0; i < CFArrayGetCount(list) && !found; i++) {
NSDictionary *w = (__bridge NSDictionary *)CFArrayGetValueAtIndex(list, i);
if ([w[(id)kCGWindowOwnerPID] intValue] != pid) continue;
if ([w[(id)kCGWindowLayer] intValue] != 0) continue;
CGRect r;
if (!CGRectMakeWithDictionaryRepresentation(
(__bridge CFDictionaryRef)w[(id)kCGWindowBounds], &r)) continue;
if (r.size.width < 200 || r.size.height 1 && strcmp(argv[1], "--front-pid") == 0) {
printf("%d\n", [NSWorkspace sharedWorkspace].frontmostApplication.processIdentifier);
return 0;
}
pid_t target = argc > 1 ? (pid_t)atoi(argv[1]) : 0;
double timeout = argc > 2 ? atof(argv[2]) : 10;
if (timeout 900) timeout = 10;
BOOL status = timeout > 15;
NSString *msg = argc > 3 ? [NSString stringWithUTF8String:argv[3]]
: @"Loading usage panel... wait to type";
NSString *readyMsg = argc > 4 && argv[4][0] ? [NSString stringWithUTF8String:argv[4]]
: @"Ready: start typing";
/* A gateway alert names its severity (info, ok, warn, error), which
* sets the border colour, and may carry a second, smaller line. It
* is a status whatever its length: hidden while Ghostty is not in
* front. */
const char *sev = argc > 5 ? argv[5] : "";
NSString *detail = argc > 6 && argv[6][0] ? [NSString stringWithUTF8String:argv[6]] : nil;
if (sev[0]) status = YES;
NSColor *border = [NSColor colorWithCalibratedRed:0.96 green:0.62 blue:0.04 alpha:1];
if (!strcmp(sev, "info")) border = [NSColor colorWithCalibratedRed:0.49 green:0.98 blue:1.00 alpha:1];
else if (!strcmp(sev, "ok")) border = [NSColor colorWithCalibratedRed:0.20 green:0.78 blue:0.35 alpha:1];
else if (!strcmp(sev, "error")) border = [NSColor colorWithCalibratedRed:0.94 green:0.22 blue:0.22 alpha:1];
signal(SIGALRM, on_alarm);
/* An alert's time only runs while it can be seen (below), so its
* backstop allows for Ghostty being in the background a while. */
alarm((unsigned int)timeout + (sev[0] ? 900 : 2));
signal(SIGUSR1, on_usr1);
signal(SIGTERM, on_term);
signal(SIGINT, on_term);
signal(SIGHUP, on_term);
pid_t parent = getppid();
NSApplication *app = [NSApplication sharedApplication];
/* Accessory: no Dock icon, no menu bar, and never activated below. */
[app setActivationPolicy:NSApplicationActivationPolicyAccessory];
NSFont *font = [NSFont systemFontOfSize:15 weight:NSFontWeightSemibold];
NSTextField *label = [NSTextField labelWithString:msg];
label.font = font;
/* Sized for the longer of the two messages, so the switch to
* the ready one is not clipped. */
NSTextField *probe = [NSTextField labelWithString:readyMsg];
probe.font = font;
[probe sizeToFit];
label.textColor = [NSColor whiteColor];
label.alignment = NSTextAlignmentCenter;
[label sizeToFit];
NSTextField *sub = nil;
if (detail) {
sub = [NSTextField labelWithString:detail];
sub.font = [NSFont systemFontOfSize:12];
sub.textColor = [NSColor colorWithCalibratedWhite:0.80 alpha:1];
sub.alignment = NSTextAlignmentCenter;
sub.lineBreakMode = NSLineBreakByTruncatingTail;
[sub sizeToFit];
}
CGFloat padX = 22, padY = 11;
CGFloat textW = MAX(label.frame.size.width, sub ? sub.frame.size.width : 0);
if (!sev[0]) textW = MAX(textW, probe.frame.size.width);
if (textW > 620) textW = 620;
CGFloat w = textW + 2 * padX + 40;
CGFloat subH = sub ? sub.frame.size.height + 2 : 0;
CGFloat h = label.frame.size.height + subH + 2 * padY;
/* Placement: top centre of the target window, 48pt below its top edge
* (clears the title bar and tab bar). Without a window, top centre of
* the main screen. Cocoa's y axis runs up from the primary display's
* bottom edge; CoreGraphics' runs down from its top. */
NSScreen *primary = [NSScreen screens].firstObject;
CGFloat primaryH = primary ? primary.frame.size.height : 900;
CGRect wr;
NSPoint origin;
if (target > 0 && front_window_of(target, &wr)) {
origin.x = wr.origin.x + (wr.size.width - w) / 2;
origin.y = primaryH - (wr.origin.y + 48) - h;
} else {
NSRect vf = [NSScreen mainScreen].visibleFrame;
origin.x = vf.origin.x + (vf.size.width - w) / 2;
origin.y = vf.origin.y + vf.size.height - 48 - h;
}
OverlayPanel *panel = [[OverlayPanel alloc]
initWithContentRect:NSMakeRect(origin.x, origin.y, w, h)
styleMask:NSWindowStyleMaskBorderless | NSWindowStyleMaskNonactivatingPanel
backing:NSBackingStoreBuffered
defer:NO];
panel.level = NSStatusWindowLevel;
panel.opaque = NO;
panel.backgroundColor = [NSColor clearColor];
panel.hasShadow = YES;
panel.ignoresMouseEvents = YES;
panel.hidesOnDeactivate = NO;
panel.becomesKeyOnlyIfNeeded = YES;
panel.collectionBehavior = NSWindowCollectionBehaviorCanJoinAllSpaces
| NSWindowCollectionBehaviorStationary
| NSWindowCollectionBehaviorFullScreenAuxiliary
| NSWindowCollectionBehaviorIgnoresCycle;
NSView *bg = [[NSView alloc] initWithFrame:NSMakeRect(0, 0, w, h)];
bg.wantsLayer = YES;
bg.layer.backgroundColor = [[NSColor colorWithCalibratedRed:0.10 green:0.11 blue:0.14 alpha:0.94] CGColor];
bg.layer.cornerRadius = sub ? 14 : h / 2;
bg.layer.borderWidth = sev[0] ? 2 : 1;
bg.layer.borderColor = [border CGColor];
label.frame = NSMakeRect(padX, h - padY - label.frame.size.height,
w - 2 * padX, label.frame.size.height);
[bg addSubview:label];
if (sub) {
sub.frame = NSMakeRect(padX, padY, w - 2 * padX, sub.frame.size.height);
[bg addSubview:sub];
}
panel.contentView = bg;
/* orderFrontRegardless shows the window without activating this app
* or making the panel key: focus does not move. */
[panel orderFrontRegardless];
NSDate *deadline = [NSDate dateWithTimeIntervalSinceNow:timeout];
NSDate *readyUntil = nil;
NSDate *lastTick = [NSDate date];
while (!g_quit) {
@autoreleasepool {
NSEvent *ev = [app nextEventMatchingMask:NSEventMaskAny
untilDate:[NSDate dateWithTimeIntervalSinceNow:0.05]
inMode:NSDefaultRunLoopMode
dequeue:YES];
if (ev) [app sendEvent:ev];
}
/* Launcher gone before saying "ready": nobody is left to close
* us, so go now. After "ready" the launcher exits straight away
* by design, and the 0.8s ready notice must outlive it. */
if (!readyUntil && getppid() != parent) break;
NSDate *now = [NSDate date];
if (status && target > 0) {
BOOL front = [NSWorkspace sharedWorkspace].frontmostApplication.processIdentifier == target;
if (front && !panel.visible) [panel orderFrontRegardless];
else if (!front && panel.visible) [panel orderOut:nil];
/* A gateway alert's seconds count only while it is on
* screen: one that arrived while another app was in front
* used to spend its time hidden and then flash for a moment
* when Ghostty came back. */
if (sev[0] && !front) deadline = [deadline dateByAddingTimeInterval:[now timeIntervalSinceDate:lastTick]];
}
lastTick = now;
if (g_ready && !readyUntil) {
label.stringValue = readyMsg;
bg.layer.borderColor = [[NSColor colorWithCalibratedRed:0.20 green:0.78 blue:0.35 alpha:1] CGColor];
[bg display];
readyUntil = [now dateByAddingTimeInterval:status ? 2.0 : 0.8];
}
if (readyUntil && [now compare:readyUntil] != NSOrderedAscending) break;
if ([now compare:deadline] != NSOrderedAscending) break;
}
[panel orderOut:nil];
}
return 0;
}
OVERLAY_EOF
if command -v clang >/dev/null 2>&1; then
# Build to a temp name and rename: a launcher starting mid-install must
# never exec a half-written binary.
if clang -O2 -Wall -fobjc-arc -framework Cocoa \
-o "$BIN_DIR/.claude-panel-overlay.new" "$OVERLAY_SRC" 2>/tmp/claude-panel-overlay-build.log; then
chmod +x "$BIN_DIR/.claude-panel-overlay.new"
mv -f "$BIN_DIR/.claude-panel-overlay.new" "$BIN_DIR/claude-panel-overlay"
echo "Built ~/.local/bin/claude-panel-overlay."
else
rm -f "$BIN_DIR/.claude-panel-overlay.new"
echo "WARNING: failed to build claude-panel-overlay (see /tmp/claude-panel-overlay-build.log)."
echo "The auto-split launcher will still work, just without the 'wait to type' notice."
fi
else
echo "WARNING: no clang found, skipping claude-panel-overlay ('wait to type' notice)."
fi
rm -f "$OVERLAY_SRC" "${OVERLAY_SRC%.m}"
echo "Installing claude-panel-session-hook.sh ..."
cat > "$BIN_DIR/claude-panel-session-hook.sh" <<'SESSHOOK_EOF'
#!/usr/bin/env bash
# Claude Code SessionStart hook: tell the usage panel which session is
# running in this directory.
#
# Reads the hook payload on stdin and writes "\t" to
# ~/.cache/claude-panel-pin/, which
# ccusage-panel.sh reads (adopt_handoff_pin) to open the right transcript.
#
# This is the only pin source that is authoritative rather than predictive.
# The ~/.zshrc preexec hook has to CHOOSE the session id in advance and force
# it on with --session-id, which it cannot do for `claude --resume`,
# `--continue`, a GUI window or an IDE-embedded terminal, all of which were
# therefore unpinned, every time, and left the panel guessing. Here the
# session has already started and simply reports what it is.
#
# Prints only the sessionTitle JSON below: plain SessionStart hook stdout is
# injected into the model's context.
set -uo pipefail
PIN_DIR="${PANEL_PIN_DIR:-$HOME/.cache/claude-panel-pin}"
LOG="$HOME/.cache/claude-panel-pin.log"
payload=$(cat 2>/dev/null)
[ -n "$payload" ] || exit 0
sid=$(printf '%s' "$payload" | jq -r '.session_id // empty' 2>/dev/null)
cwd=$(printf '%s' "$payload" | jq -r '.cwd // empty' 2>/dev/null)
[ -n "$sid" ] && [ -n "$cwd" ] || exit 0
# Name the session after its folder, which is what the terminal title shows.
# Without a session title Claude Code titles every window "Claude Code", so
# five of them are indistinguishable in the window switcher. SessionStart's
# hookSpecificOutput.sessionTitle is the supported way to set one (the same
# thing /rename does), and it is the ONLY thing this hook prints: JSON stdout
# is parsed as hook output, not injected into the model's context.
#
# "startup" only. A resumed session may carry a title someone chose with
# /rename, and clobbering it with the folder name would undo that choice.
# CLAUDE_PANEL_SESSION_TITLE=false in ~/.config/claude-panel/options (the
# Claude Burst dashboard switches it) or PANEL_SESSION_TITLE=0 turns it off.
source=$(printf '%s' "$payload" | jq -r '.source // empty' 2>/dev/null)
title_opt=$(grep -E '^CLAUDE_PANEL_SESSION_TITLE=' "$HOME/.config/claude-panel/options" 2>/dev/null | tail -1)
title_opt=$(printf '%s' "${title_opt#*=}" | tr -d "\"' " | tr '[:upper:]' '[:lower:]')
case "$title_opt" in false|0|no|off) PANEL_SESSION_TITLE=0 ;; esac
if [ "$source" = "startup" ] && [ "${PANEL_SESSION_TITLE:-1}" != "0" ]; then
jq -cn --arg t "${cwd##*/}" \
'{hookSpecificOutput: {hookEventName: "SessionStart", sessionTitle: $t}}' 2>/dev/null
fi
case "$sid" in
[0-9a-f][0-9a-f][0-9a-f][0-9a-f][0-9a-f][0-9a-f][0-9a-f][0-9a-f]-[0-9a-f][0-9a-f][0-9a-f][0-9a-f]-[0-9a-f][0-9a-f][0-9a-f][0-9a-f]-[0-9a-f][0-9a-f][0-9a-f][0-9a-f]-[0-9a-f][0-9a-f][0-9a-f][0-9a-f][0-9a-f][0-9a-f][0-9a-f][0-9a-f][0-9a-f][0-9a-f][0-9a-f][0-9a-f]) ;;
*) exit 0 ;;
esac
mkdir -p "$PIN_DIR" 2>/dev/null || exit 0
# Both writes below are same-directory write + rename, so a panel reading a
# pin mid-write never sees half a UUID, the exact class of half-written id
# this whole mechanism exists to stop happening.
#
# Which pane is this claude running in? Its controlling terminal, which is
# what makes a per-pane pin possible at all, the directory-keyed file below
# cannot tell two sessions in one repo apart, and every panel in that repo
# follows whichever started last.
#
# The hook process itself has NO controlling terminal: Claude Code gives it
# pipes, so `ps -o tty= -p $$` prints "??". So walk up, but stop at the
# FIRST claude in the ancestry, the one that ran this hook, and answer with
# that process's terminal or with nothing.
#
# The first version stopped at the first process with ANY terminal instead.
# For an interactive pane that is claude, one level up, and it is right. For
# a HEADLESS claude, `claude --print`, which is how the standards-review
# sections and every build script that shells out to the CLI run, it walks
# straight past the terminal-less claude and returns the terminal of the
# interactive shell that started the build. Observed 2026-09-14: a build's
# review sections wrote pins naming a 7-turn Sonnet session against the pane
# of the Opus session that launched them, and that repo's panel spent the
# afternoon reporting the review's model, cost and context as its own.
#
# A claude with no controlling terminal is in no pane. That is the whole
# answer: it is nobody's pane session, so it writes NEITHER pin and the
# panels in that directory are left alone.
session_tty() {
local p="$$" t comm i
for i in 1 2 3 4 5 6 7 8; do
p=$(ps -o ppid= -p "$p" 2>/dev/null | tr -d '[:space:]')
[ -n "$p" ] && [ "$p" != "0" ] && [ "$p" != "1" ] || return 1
comm=$(ps -o comm= -p "$p" 2>/dev/null | tr -d '[:space:]')
# A wrapper shell between the hook and claude costs nothing; keep going.
case "${comm##*/}" in
claude|claude-code) ;;
# An npm install runs as `node .../bin/claude`, so its comm is node.
# Without this such a machine never got a pin from this hook, and a
# panel paired to that pane stayed on the first session for good.
node)
ps -o args= -p "$p" 2>/dev/null | grep -qE '(/|^| )claude(-code)?( |$)|@anthropic-ai/claude-code' || continue ;;
*) continue ;;
esac
t=$(ps -o tty= -p "$p" 2>/dev/null | tr -d '[:space:]')
case "$t" in
''|'??') return 1 ;;
*) printf '%s' "$t"; return 0 ;;
esac
done
return 1
}
# Both pins are gated on the pane, and this is the gate: no terminal, no
# pane, no pin. It is checked BEFORE the directory write rather than only
# for the tty one, the directory key is the channel a headless session
# hijacked, because every panel in a repo reads it and nothing about it says
# which pane it was written for.
ctty=$(session_tty) || ctty=""
if [ -z "$ctty" ]; then
printf '%s [%s] SessionStart: %s (no controlling terminal, headless claude, or no claude in this hook'"'"'s ancestry) -> %s, no pin written\n' \
"$(date '+%Y-%m-%d %H:%M:%S')" "$$" "$cwd" "$sid" >> "$LOG" 2>/dev/null
exit 0
fi
key=$(printf '%s' "$cwd" | tr '/' '-')
tmp="$PIN_DIR/.$key.$$"
printf '%s\t%s\n' "$sid" "$(date +%s)" > "$tmp" 2>/dev/null &&
mv -f "$tmp" "$PIN_DIR/$key" 2>/dev/null
rm -f "$tmp" 2>/dev/null
# The pane-scoped pin. Written in ADDITION to the directory one, never
# instead of it: a panel that has no pairing (started by hand, or through a
# path with no launcher) still needs the directory file, and a panel that
# does have one ignores it.
mkdir -p "$PIN_DIR/tty" 2>/dev/null
tmp="$PIN_DIR/tty/.$ctty.$$"
printf '%s\t%s\n' "$sid" "$(date +%s)" > "$tmp" 2>/dev/null &&
mv -f "$tmp" "$PIN_DIR/tty/$ctty" 2>/dev/null
rm -f "$tmp" 2>/dev/null
printf '%s [%s] SessionStart: %s (tty %s) -> %s\n' "$(date '+%Y-%m-%d %H:%M:%S')" "$$" "$cwd" "$ctty" "$sid" >> "$LOG" 2>/dev/null
exit 0
SESSHOOK_EOF
chmod +x "$BIN_DIR/claude-panel-session-hook.sh"
echo "Installing claude-panel-launch.sh ..."
# ---------------------------------------------------------------------------
# claude-panel-keysend: deliver the split-and-launch keystrokes to ONE process.
#
# System Events' `keystroke` goes to whatever window holds keyboard focus,
# system-wide, so the launcher has always had to identify the focused window
# and refuse to type when it could not. CGEventPostToPid addresses a PROCESS
# instead, and every Ghostty window here is its own process, so the events
# cannot land anywhere else no matter what focus is doing.
#
# Verified against a Ghostty instance with focus deliberately held on an
# unrelated window throughout: the split opened, the command ran, and the
# resulting panel's own process ancestry placed it in the targeted instance.
# Focus never moved.
# ---------------------------------------------------------------------------
KEYSEND_SRC="$BIN_DIR/claude-panel-keysend"
cat > "$KEYSEND_SRC" <<'KEYSEND_EOF'
"""Post the panel's split-and-launch key sequence to a single process.
usage: claude-panel-keysend
Exits 2 if pyobjc's Quartz bindings are missing, which is the launcher's
signal to fall back to its focus-dependent AppleScript path.
"""
import sys
import time
try:
import Quartz
except ImportError:
sys.stderr.write("Quartz (pyobjc) not available\n")
sys.exit(2)
# macOS virtual key codes. Only the four this sequence needs.
KEY = {"d": 2, "left": 123, "right": 124, "return": 36}
# "fn" and "numpad" are what a real arrow key press carries; Ghostty matched
# the arrow chords below with them set, verified against a live instance.
FLAG = {
"cmd": Quartz.kCGEventFlagMaskCommand,
"ctrl": Quartz.kCGEventFlagMaskControl,
"alt": Quartz.kCGEventFlagMaskAlternate,
"fn": Quartz.kCGEventFlagMaskSecondaryFn,
"numpad": Quartz.kCGEventFlagMaskNumericPad,
}
# Each event is posted down-then-up with a short gap. Ghostty drops keys sent
# faster than this, and a dropped key here is a half-typed command sitting on
# a prompt.
GAP = 0.012
def _post(pid, event):
Quartz.CGEventPostToPid(pid, event)
time.sleep(GAP)
def chord(pid, src, key, mods=()):
flags = 0
for m in mods:
flags |= FLAG[m]
for down in (True, False):
e = Quartz.CGEventCreateKeyboardEvent(src, KEY[key], down)
Quartz.CGEventSetFlags(e, flags)
_post(pid, e)
def text(pid, src, s):
# Key code 0 with an attached unicode string types the character itself,
# so this does not need a layout-specific code for every key -- which
# matters because the panel command contains "~", "/" and ".".
for ch in s:
for down in (True, False):
e = Quartz.CGEventCreateKeyboardEvent(src, 0, down)
Quartz.CGEventKeyboardSetUnicodeString(e, len(ch), ch)
_post(pid, e)
def main():
if len(sys.argv) != 4:
sys.stderr.write(__doc__)
return 64
pid = int(sys.argv[1])
command = sys.argv[2]
presses = int(sys.argv[3])
src = Quartz.CGEventSourceCreate(Quartz.kCGEventSourceStateHIDSystemState)
# Same sequence, and the same delays, as the AppleScript path below it:
# split, type, run, focus left pane, shrink the right one.
#
# Focus and resize use Ghostty's OWN default bindings (cmd+opt+left is
# goto_split:left, cmd+ctrl+right is resize_split:right,10), not keybinds
# this installer adds. The old ctrl+h / ctrl+shift+l needed lines in
# ~/.config/ghostty/config that a fresh machine does not have (and that a
# running Ghostty ignores until reloaded), so on a new install ctrl+h was
# typed into the panel as a backspace, focus stayed on the panel, and the
# split stayed 50/50.
chord(pid, src, "d", ("cmd",))
time.sleep(0.6)
text(pid, src, command)
time.sleep(0.1)
chord(pid, src, "return")
time.sleep(0.3)
chord(pid, src, "left", ("cmd", "alt", "fn", "numpad"))
time.sleep(0.2)
for _ in range(presses):
chord(pid, src, "right", ("cmd", "ctrl", "fn", "numpad"))
time.sleep(0.05)
return 0
sys.exit(main())
KEYSEND_EOF
chmod +x "$KEYSEND_SRC"
cat > "$BIN_DIR/claude-panel-launch.sh" <> "$LOG"; }
# The usage-panel mod draws this panel inside Claude Code, as a sidebar, so
# while it is installed there is no split to open and nothing to type.
# CLAUDE_PANEL_SPLIT=true (environment or the options file) opens it anyway.
split_stands_aside() {
local v="${CLAUDE_PANEL_SPLIT:-$(grep -E '^CLAUDE_PANEL_SPLIT=' "$HOME/.config/claude-panel/options" 2>/dev/null | tail -1 | cut -d= -f2-)}"
case "$(printf '%s' "$v" | tr '[:upper:]' '[:lower:]' | tr -d '"'"'"' ')" in
true|1|yes|on) return 1 ;;
esac
[ -f "$HOME/.config/claude-panel/mod-installed" ]
}
if split_stands_aside; then
log "usage-panel mod installed: the panel is a sidebar inside Claude Code; no split (CLAUDE_PANEL_SPLIT=true to open one)"
exit 0
fi
panel_pids() { pgrep -f '[b]in/ccusage-panel\.sh' 2>/dev/null | sort; }
# Is the pin readable where the panel will look for it? The session id no
# longer travels on the command line this launcher TYPES into the new split,
# which is what this check used to inspect -- it compared the sent id against
# the new panel's argv, because keystrokes are synthetic and a dropped or
# interleaved character rewrites an id in place. One observed pane ran with
# `9e435181h-888e-4f0c-811-3befb80226t3d` against a real session id of
# `9e435181-888e-4f0c-81f1-3befb802263d`, and spent hours reporting
# "Model: Unknown / no active session found" while every account-wide figure
# beside it stayed correct.
#
# write_pin_handoff below takes the id out of the keystroke path entirely, so
# there is no longer a transit to corrupt. What remains worth checking is
# that the file actually landed and reads back byte-for-byte: a $HOME that is
# read-only or full fails silently otherwise, and the symptom looks exactly
# like the panel bug this replaced.
verify_pin() { # $1 = newline-separated pids (unused; kept for call-site shape)
[ -n "$PIN_SID" ] || return 0
local got
IFS=$'\t' read -r got _ /dev/null || got=""
if [ "$got" = "$PIN_SID" ]; then
log "attempt $attempt: pin handoff verified at $PIN_HANDOFF_FILE"
else
log "attempt $attempt: WARNING: pin handoff did not land (sent '$PIN_SID', read back '${got:-nothing}' from $PIN_HANDOFF_FILE); the panel will fall back to the SessionStart hook or to detecting the session itself"
fi
}
# Hand the session id to the panel through the filesystem rather than
# through the keyboard. Written BEFORE any keystroke goes out, so the panel
# can read it on its very first tick. Same-directory write + rename, so a
# panel reading mid-write never sees half a UUID.
#
# This duplicates what claude-panel-session-hook.sh does from inside Claude
# Code, and is not redundant with it: the hook is authoritative but needs
# ~/.claude/settings.json to exist and hooks to be enabled, and it cannot
# run at all if the user's `claude` never starts. This one covers the pin
# the launcher itself chose.
write_pin_handoff() {
[ -n "$PIN_SID" ] || return 0
mkdir -p "$PIN_HANDOFF_DIR" 2>/dev/null || { log "WARNING: could not create $PIN_HANDOFF_DIR; panel will fall back to detecting the session itself"; return 0; }
local tmp="$PIN_HANDOFF_DIR/.$(basename "$PIN_HANDOFF_FILE").$$"
if printf '%s\t%s\n' "$PIN_SID" "$(date +%s)" > "$tmp" 2>/dev/null &&
mv -f "$tmp" "$PIN_HANDOFF_FILE" 2>/dev/null; then
log "pin handoff written: $PIN_HANDOFF_FILE -> $PIN_SID"
else
rm -f "$tmp" 2>/dev/null
log "WARNING: could not write $PIN_HANDOFF_FILE; panel will fall back to detecting the session itself"
fi
# ...and again under this pane's own terminal, which is the key the panel
# prefers. Same id, different question: the file above answers "what is the
# newest session in this directory", which stops being this pane's answer
# the moment a second session opens in the same repo. This one answers
# "what is the session in THIS pane", and nothing another pane does can
# overwrite it. claude-panel-session-hook.sh writes the same file from
# inside Claude Code with the id it actually chose; this covers the case
# where hooks are not installed at all.
[ -n "$CLAUDE_TTY" ] || return 0
mkdir -p "$PIN_TTY_DIR" 2>/dev/null || return 0
tmp="$PIN_TTY_DIR/.$CLAUDE_TTY.$$"
if printf '%s\t%s\n' "$PIN_SID" "$(date +%s)" > "$tmp" 2>/dev/null &&
mv -f "$tmp" "$PIN_TTY_DIR/$CLAUDE_TTY" 2>/dev/null; then
log "pane pin written: $PIN_TTY_DIR/$CLAUDE_TTY -> $PIN_SID"
else
rm -f "$tmp" 2>/dev/null
log "WARNING: could not write $PIN_TTY_DIR/$CLAUDE_TTY; the panel falls back to the directory-keyed pin"
fi
}
# Pair the panel we just started with the claude pane we were launched from.
# This is the one moment either fact is knowable together: this script runs
# in the claude pane's own shell (so $CLAUDE_TTY is that pane), and it has
# just watched a new ccusage-panel.sh appear (so the panel's tty is a `ps`
# away). Neither process can work the other out on its own, they sit in
# different splits with different terminals and share nothing else.
#
# Nothing is written when more than one panel appeared in the window between
# the two `pgrep`s: which of them is ours is then a guess, and a guess here
# writes a pairing that makes a panel confidently show the wrong session for
# as long as it runs. The directory-keyed fallback is the honest answer.
write_pane_pairing() { # $1 = newline-separated new panel pids
local pids pid ptty tmp
[ -n "$CLAUDE_TTY" ] || return 0
pids=$(printf '%s\n' "$1" | tr -s '[:space:]' '\n' | grep -c '^[0-9][0-9]*$') || pids=0
if [ "$pids" != "1" ]; then
log "attempt $attempt: not writing a pane pairing, $pids new panel process(es), cannot tell which is ours"
return 0
fi
pid=$(printf '%s' "$1" | tr -dc '0-9')
ptty=$(ps -o tty= -p "$pid" 2>/dev/null | tr -d '[:space:]')
case "$ptty" in
''|'??') log "attempt $attempt: not writing a pane pairing, panel pid $pid has no controlling terminal"; return 0 ;;
esac
mkdir -p "$PIN_PANE_DIR" 2>/dev/null || return 0
tmp="$PIN_PANE_DIR/.$ptty.$$"
# The pid goes in the file because terminal names are recycled: the panel
# refuses a pairing that names a different process, so a later split
# reusing this tty cannot inherit this one.
if printf '%s\t%s\t%s\n' "$CLAUDE_TTY" "$pid" "$(date +%s)" > "$tmp" 2>/dev/null &&
mv -f "$tmp" "$PIN_PANE_DIR/$ptty" 2>/dev/null; then
log "attempt $attempt: pane pairing written: panel $ptty (pid $pid) -> claude $CLAUDE_TTY"
else
rm -f "$tmp" 2>/dev/null
log "attempt $attempt: WARNING: could not write $PIN_PANE_DIR/$ptty; the panel falls back to the directory-keyed pin"
fi
}
# Swallow real keyboard input for a few seconds while synthetic keystrokes
# are in flight, so anything typed during window setup cannot be woven into
# the command being typed into the new split. Best-effort: a missing binary
# or an ungranted permission just means no guard.
KEYBLOCK_PID=""
start_keyboard_guard() { # $1 = seconds
[ -x "$HOME/.local/bin/claude-panel-keyblock" ] || return 0
"$HOME/.local/bin/claude-panel-keyblock" "$1" >>"$LOG" 2>&1 &
KEYBLOCK_PID=$!
log "attempt $attempt: keyboard guard started (pid $KEYBLOCK_PID, $1s)"
}
# End the guard as soon as the key sequence has been sent. Its duration is a
# ceiling sized for the slowest sequence (a wide window's resize loop), not
# for the usual one: the launch log shows the targeted send finishing in
# about 2.5s of a 5s guard, so the user sat for another 2.5s with keystrokes
# silently swallowed after focus was already back on the claude pane. Once
# the last synthetic event is posted there is nothing left to protect. The
# short settle lets Ghostty drain the posted events before real typing
# queues behind them.
release_keyboard_guard() {
[ -n "$KEYBLOCK_PID" ] || return 0
sleep 0.2
if kill "$KEYBLOCK_PID" 2>/dev/null; then
log "attempt $attempt: keyboard guard released (key sequence sent)"
fi
KEYBLOCK_PID=""
}
# The floating "wait to type" notice (claude-panel-overlay). While this
# script works, focus is on the NEW split and the guard swallows input, so
# typing goes nowhere and, before this, nothing said so. Shown when an
# attempt begins, switched to "Ready" the moment focus is back on the claude
# pane and the guard is gone, and closed by the EXIT trap on every other way
# out. The helper also closes itself after 10s and when this script dies, so
# it cannot be left on screen. It never takes focus (see its own comments).
#
# CLAUDE_PANEL_LOADING_OVERLAY in ~/.config/claude-panel/options, default
# ON: only an explicit false/0/no/off turns it off. The environment wins
# over the file, so one launch can override it.
OVERLAY_PID=""
overlay_enabled() {
local v
v=$(grep -E '^CLAUDE_PANEL_LOADING_OVERLAY=' "$HOME/.config/claude-panel/options" 2>/dev/null | tail -1)
v="${CLAUDE_PANEL_LOADING_OVERLAY:-${v#*=}}"
v=$(printf '%s' "$v" | tr -d "\"' " | tr '[:upper:]' '[:lower:]')
case "$v" in false|0|no|off) return 1 ;; esac
return 0
}
show_overlay() {
[ -n "$OVERLAY_PID" ] && kill -0 "$OVERLAY_PID" 2>/dev/null && return 0
OVERLAY_PID=""
overlay_enabled || return 0
[ -x "$HOME/.local/bin/claude-panel-overlay" ] || return 0
"$HOME/.local/bin/claude-panel-overlay" "${ghostty_pid:-0}" 10 >>"$LOG" 2>&1 &
OVERLAY_PID=$!
log "attempt $attempt: overlay shown (pid $OVERLAY_PID, closes itself after 10s at most)"
}
overlay_ready() {
[ -n "$OVERLAY_PID" ] || return 0
kill -USR1 "$OVERLAY_PID" 2>/dev/null && log "attempt $attempt: overlay: focus is back, told the user to start typing"
OVERLAY_PID=""
}
overlay_close() {
[ -n "$OVERLAY_PID" ] || return 0
kill "$OVERLAY_PID" 2>/dev/null
OVERLAY_PID=""
}
trap overlay_close EXIT
# Passed by the autolaunch hook only for a bare `claude` invocation, which
# it forces to run with this same ID via --session-id, lets the panel open
# that exact transcript instead of guessing by mtime. Empty for anything
# else, and the panel falls back to the SessionStart hook's handoff or to
# its own directory-scoped guess.
PIN_SID="${1:-}"
PIN_HANDOFF_DIR="${PANEL_PIN_DIR:-$HOME/.cache/claude-panel-pin}"
PIN_HANDOFF_FILE="$PIN_HANDOFF_DIR/$(printf '%s' "$PWD" | tr '/' '-')"
PIN_PANE_DIR="$PIN_HANDOFF_DIR/pane"
PIN_TTY_DIR="$PIN_HANDOFF_DIR/tty"
# The pane `claude` is about to run in, this script is backgrounded from the
# zsh preexec hook (or from ghostty-claude-launcher), both of which run in
# that pane's own shell, so our controlling terminal IS its controlling
# terminal. `ps -o tty=`, not `tty`: backgrounded, stdin is not the terminal.
CLAUDE_TTY="$(ps -o tty= -p $$ 2>/dev/null | tr -d '[:space:]')"
case "$CLAUDE_TTY" in ''|'??') CLAUDE_TTY="" ;; esac
# The command TYPED into the new split carries no session id any more, so
# there is nothing in it a stray keystroke can corrupt into a transcript name
# that will never exist. 10 and 12 are the panel's own defaults for refresh
# and turn-table rows, so an argument-free launch is identical to the old
# pinned one minus the pin.
# CLAUDE_PANEL_SPLIT=1 tells the panel this pane is the launcher's split, so
# its [X] closes the split as well as the panel.
PANEL_CMD="CLAUDE_PANEL_SPLIT=1 ~/.local/bin/ccusage-panel.sh"
# How much of the window the panel gets, as a whole percent. Ghostty makes
# splits 50/50, so the launcher shrinks the new pane with N presses of
# cmd+ctrl+right (Ghostty's default resize_split:right,10 -- 10pt each;
# measured: 20 presses took a 71-column pane to 47):
#
# presses = (50% - target%) of the window width, in 10pt steps
# = width * (50 - PCT) / 100 / 10
# = width * (50 - PCT) / 1000
#
# A number rather than the old open-coded `(width / 6) / 40`, which was the
# same expression with 1/3 already substituted in and no way to see that
# that was what it meant, let alone change it. 40 because a third was too
# narrow for the widest rows the panel draws -- the Top Sessions block and
# the 3-day trend were wrapping mid-value. Now 30 (a 70/30 split): the
# panel wraps its long rows itself since then, and the chat pane is the
# one being worked in.
#
# Both send paths below compute this, and they must agree: a launch that
# lands on the AppleScript fallback should produce the same pane as one
# that does not.
# The width the user last dragged a panel to, saved by the panel itself
# (remember_panel_width), wins over the 30 default; the environment over both.
_saved_pct=$(cat "$HOME/.config/claude-panel/width-pct" 2>/dev/null)
case "$_saved_pct" in ''|*[!0-9]*) _saved_pct=30 ;; esac
(( _saved_pct 50 )) && _saved_pct=30
PANEL_WIDTH_PCT="${PANEL_WIDTH_PCT:-$_saved_pct}"
log "start: TERM_PROGRAM=${TERM_PROGRAM:-unset} TMUX=${TMUX:-unset} PWD=$PWD PIN_SID=${PIN_SID:-none}"
write_pin_handoff
# Inside tmux, TERM_PROGRAM gets overridden (often to "tmux") regardless of
# the outer terminal, so the Ghostty check below never sees "ghostty" even
# when Ghostty is the real host, the launcher aborted silently for every
# tmux user. tmux has its own native split primitive that needs no
# Accessibility permission and no keystroke simulation, so prefer it
# whenever we're inside a tmux client at all, before falling through to the
# Ghostty/osascript path.
if [ -n "${TMUX:-}" ]; then
if ! command -v tmux >/dev/null 2>&1; then
log "abort: TMUX is set but tmux binary not found"
exit 0
fi
if tmux split-window -h -l "${PANEL_WIDTH_PCT}%" "$PANEL_CMD" 2>>"$LOG"; then
tmux select-pane -L >>"$LOG" 2>&1
log "done: tmux split-window succeeded"
else
log "done: tmux split-window FAILED"
fi
exit 0
fi
if [ "${TERM_PROGRAM:-}" != "ghostty" ]; then
log "abort: not running inside Ghostty (TERM_PROGRAM=${TERM_PROGRAM:-unset})"
exit 0
fi
if ! command -v osascript >/dev/null 2>&1; then
log "abort: no osascript on this system (not macOS?)"
exit 0
fi
ghostty_procs=$(pgrep -x ghostty 2>/dev/null | wc -l | tr -d ' ')
log "context: ${ghostty_procs} ghostty process(es) running"
# WHICH Ghostty instance is ours? Not a rhetorical question: every Finder
# Service launch runs `Ghostty.app/Contents/MacOS/ghostty -e ...` directly,
# which starts a new app INSTANCE rather than a new window inside the
# existing one, so several processes named "ghostty" coexist as a matter of
# routine, one per launched window, plus any whose window was closed while
# a child shell kept the process alive.
#
# Everything below used to identify its target as "the frontmost process
# named ghostty", which is only unambiguous while exactly one instance
# exists. It stopped being true on 2026-09-05: macOS reported a two-day-old
# instance as frontmost, that instance had no windows left, and all three
# attempts died on `Can't get window 1 of application process "ghostty".
# Invalid index. (-1719)` while the real window sat there in focus.
#
# Our own instance is always an ancestor of this script (ghostty -> login ->
# shell -> here), so walk up and get its pid. Everything downstream then
# addresses it by unix id instead of by name. If the walk fails we fall back
# to the old name match rather than refusing to launch, but the log says so.
ghostty_pid=""
walk=$$
depth=0
while [ -n "$walk" ] && [ "$walk" -gt 1 ] && [ "$depth" -lt 12 ]; do
if [ "$(ps -o comm= -p "$walk" 2>/dev/null | sed 's|.*/||')" = "ghostty" ]; then
ghostty_pid="$walk"
break
fi
walk=$(ps -o ppid= -p "$walk" 2>/dev/null | tr -d ' ')
depth=$((depth + 1))
done
if [ -n "$ghostty_pid" ]; then
log "context: our Ghostty instance is pid $ghostty_pid (walked $depth level(s) of process ancestry)"
else
log "context: could not identify our Ghostty instance from process ancestry, falling back to matching on the name 'ghostty', which is ambiguous when several instances are running"
fi
# Which python3, if any, can post key events to a specific process?
#
# pyobjc's Quartz bindings are not part of stock macOS -- /usr/bin/python3
# does not have them; a Homebrew python usually does -- so this is a probe,
# not an assumption. Empty means the targeted path is unavailable on this
# machine and the AppleScript path runs exactly as before.
#
# PANEL_KEYSEND_PYTHON names the interpreter to use, for anyone whose python
# is somewhere else. It is AUTHORITATIVE, not merely first in the search: if
# it is set and cannot post events, the search stops rather than quietly
# picking a different interpreter. Otherwise the variable could not turn the
# targeted path OFF, which would leave the AppleScript path below
# unreachable on this machine -- and an untested fallback is one that has
# stopped working without anyone finding out. `PANEL_KEYSEND_PYTHON=/usr/bin/
# python3` (stock macOS, no pyobjc) exercises it.
BIN_DIR_KEYSEND="$HOME/.local/bin/claude-panel-keysend"
panel_python=""
find_quartz_python() {
local py
if [ -n "${PANEL_KEYSEND_PYTHON:-}" ]; then
if command -v "$PANEL_KEYSEND_PYTHON" >/dev/null 2>&1 &&
"$PANEL_KEYSEND_PYTHON" -c 'import Quartz' 2>/dev/null; then
printf '%s' "$PANEL_KEYSEND_PYTHON"
return 0
fi
return 1
fi
for py in /opt/homebrew/bin/python3 /usr/local/bin/python3 python3 \
/usr/bin/python3; do
command -v "$py" >/dev/null 2>&1 || continue
if "$py" -c 'import Quartz' 2>/dev/null; then
printf '%s' "$py"
return 0
fi
done
return 1
}
# A bare permission-probe first, if Accessibility access isn't granted,
# every subsequent step will fail the same way, so say so once clearly
# instead of three confusing retries.
probe=$(osascript -e 'tell application "System Events" to get name of first process' 2>&1)
probe_status=$?
if [ "$probe_status" -ne 0 ]; then
log "abort: System Events probe failed (exit=$probe_status): $probe"
log "abort: likely missing Accessibility permission, check System Settings > Privacy & Security > Accessibility for Ghostty"
exit 0
fi
attempt=0
max_attempts=3
success=0
while [ "$attempt" -lt "$max_attempts" ] && [ "$success" -eq 0 ]; do
attempt=$((attempt + 1))
log "attempt $attempt/$max_attempts: begin"
show_overlay
before_pids=$(panel_pids)
# ---- targeted path: address the process, never the focus ---------------
# CGEventPostToPid delivers to a specific PROCESS, and every Ghostty window
# here is its own process (see the ancestry walk above), so these keystrokes
# cannot land in another window however focus moves. That removes the whole
# problem the AppleScript path below spends its length managing: it can only
# type into the FOCUSED window, so it has to identify that window first and
# refuse when it cannot -- which is why new windows were silently getting no
# panel whenever a second Ghostty was alive.
#
# Needs pyobjc's Quartz bindings, which are not on stock macOS: /usr/bin/
# python3 does not have them, a Homebrew python usually does. When no
# interpreter has them the AppleScript path below runs unchanged, so this is
# strictly an upgrade where it is available rather than a new requirement.
#
# The window geometry still comes from System Events -- reading a window's
# size does not require it to be focused, only typing into it does.
if [ -z "$panel_python" ] && [ -n "$ghostty_pid" ]; then
if panel_python=$(find_quartz_python); then
[ "$attempt" = 1 ] && log "context: key events will be addressed to our process via $panel_python"
else
panel_python=""
[ "$attempt" = 1 ] && log "context: no python3 with pyobjc's Quartz bindings, using the focus-dependent AppleScript path"
fi
fi
if [ -n "$panel_python" ] && [ -n "$ghostty_pid" ] && [ -x "$BIN_DIR_KEYSEND" ]; then
geom=$(osascript -e "tell application \"System Events\"
set p to first application process whose unix id is $ghostty_pid
if (count of windows of p) is 0 then return \"nowindow\"
-- Bind the size before indexing it. \`item 1 of (size of front window
-- of p)\` reads fine and fails at runtime with \"Can't make ... into
-- type specifier (-1700)\": inside a tell block the index is applied to
-- the unevaluated reference rather than to the returned list.
set sz to size of front window of p
return item 1 of sz
end tell" 2>&1)
case "$geom" in
''|*[!0-9]*)
log "attempt $attempt: targeted path unavailable (window geometry: $geom), falling through to the AppleScript path"
;;
*)
presses=$(( geom * (50 - PANEL_WIDTH_PCT) / 1000 ))
log "attempt $attempt: targeted send to pid $ghostty_pid (width=$geom presses=$presses) via $panel_python"
# The guard belongs on THIS path too. It used to be started only
# further down, on the AppleScript path, so the targeted path -- the
# one that runs whenever pyobjc is available, i.e. the normal one
# here -- typed the command with the real keyboard wide open. That is
# how a session id acquires an 'h' and a 't' it never had: the user
# keeps typing in the window they were already working in while this
# types into the new split, and both streams reach the same pane.
# The keysend sequence is ~3s at its slowest (0.6s settle + two
# events per character at 12ms + the resize repeats).
start_keyboard_guard 5
if "$panel_python" "$BIN_DIR_KEYSEND" "$ghostty_pid" "$PANEL_CMD" "$presses" >>"$LOG" 2>&1; then
# The sequence ends by moving focus back to the claude pane, so the
# user can type from here, before the 1s wait to verify the panel.
release_keyboard_guard
overlay_ready
sleep 1
after_pids=$(panel_pids)
new_pids=$(comm -13 <(echo "$before_pids") /dev/null)
if [ -n "$new_pids" ]; then
log "attempt $attempt: VERIFIED: new panel process(es): $(echo "$new_pids" | tr '\n' ' ')"
verify_pin "$new_pids"
write_pane_pairing "$new_pids"
success=1
continue
fi
log "attempt $attempt: targeted send reported success but no panel appeared, falling through"
else
log "attempt $attempt: targeted send failed (exit $?), falling through to the AppleScript path"
release_keyboard_guard
fi
;;
esac
fi
# ---- focus-dependent path: only reached when the above is unavailable ---
# Ask our own instance to come to the front before polling. This isn't
# cosmetic: System Events delivers `keystroke` to whatever application is
# frontmost, not to the process an enclosing `tell` names, so targeting
# the right instance and typing into the right window are one and the
# same requirement, a check that merely observes frontmost can be
# satisfied by an instance we are not about to type into.
if [ -n "$ghostty_pid" ]; then
osascript -e "tell application \"System Events\" to set frontmost of (first application process whose unix id is $ghostty_pid) to true" >/dev/null 2>&1
fi
# Brand-new windows can take a beat to become frontmost at the
# Accessibility API level, poll instead of checking once and giving up.
front=""
polls=0
for _ in $(seq 1 20); do
polls=$((polls + 1))
if [ -n "$ghostty_pid" ]; then
front=$(osascript -e 'tell application "System Events" to get unix id of first application process whose frontmost is true' 2>/dev/null)
[ "$front" = "$ghostty_pid" ] && break
else
front=$(osascript -e 'tell application "System Events" to get name of first application process whose frontmost is true' 2>/dev/null)
[ "$front" = "ghostty" ] && break
fi
sleep 0.1
done
if [ -n "$ghostty_pid" ] && [ "$front" != "$ghostty_pid" ]; then
log "attempt $attempt: our Ghostty instance (pid $ghostty_pid) never became frontmost after $polls polls (last saw pid '$front'), retrying"
sleep 0.5
continue
fi
if [ -z "$ghostty_pid" ] && [ "$front" != "ghostty" ]; then
log "attempt $attempt: frontmost never became ghostty after $polls polls (last saw '$front'), retrying"
sleep 0.5
continue
fi
log "attempt $attempt: frontmost confirmed ($([ -n "$ghostty_pid" ] && echo "pid $ghostty_pid" || echo "name match")) after $polls poll(s)"
# Block real keyboard input for the settle delay + the whole keystroke
# sequence below (worst case, a wide monitor's resize-repeat loop, runs
# ~4s) so anything typed while the window is still settling can't land in
# the new split or get woven into the command being typed into it. Fully
# self-bounded: it exits on its own after the duration below even if this
# script dies first, see claude-panel-keyblock's own comments for the
# safety valves. Best-effort: missing binary or ungranted permissions
# just mean no guard, same as before this existed.
show_overlay
start_keyboard_guard 6
# Settle delay: frontmost can flip true right as a cold `open -na` launch
# is still mid-activation-animation, before the window can reliably
# receive keystrokes.
sleep 0.3
# Everything below, the frontmost re-check, the window-width read, the
# resize math, and every keystroke, happens inside ONE osascript call.
# Splitting this across two calls previously let frontmost change out
# from under the second one, and both halves would separately exit 0.
# 0 means "we never worked out which instance is ours", the AppleScript
# then falls back to the old, ambiguous name match.
TARGET_PID="${ghostty_pid:-0}"
result=$(osascript <&1
tell application "System Events"
-- Identify the focused instance POSITIVELY, and refuse to type if we
-- cannot.
--
-- "first application process whose frontmost is true" returns whichever
-- match comes first in System Events' own process order. That is fine
-- with one Ghostty and wrong with several: on 2026-09-05 the shell-side
-- poll logged "frontmost confirmed (pid 37092)" and this script, asking
-- the identical question a second later, read pid 87107 -- an OLDER
-- instance -- and skipped, on all three attempts, for every new window
-- opened while a second Ghostty was alive.
--
-- So enumerate every ghostty and ask each one directly, rather than
-- asking the list who is first. Proceed only when EXACTLY ONE claims
-- frontmost and it is ours. Anything else skips.
--
-- Skipping is the right failure. The alternative -- assume it is ours and
-- type anyway -- was tried and is far worse: "keystroke" goes to whatever
-- window holds keyboard focus system-wide, NOT to the process an
-- enclosing "tell" names (see the comment on the raise above), so a wrong
-- guess types a shell command into whatever the user is actually working
-- in. It did: six panels appeared in one unrelated window, and since the
-- typed command lands in a shell that runs the autolaunch hook, it
-- recursed into a second launcher run. No panel is a small problem;
-- keystrokes in the wrong window is not.
--
-- Every skip reports the full per-instance picture, because "which of
-- these two cases is it" is exactly what could not be answered from the
-- old one-line message.
set diag to ""
set frontIds to {}
repeat with g in (every application process whose name is "ghostty")
set gid to unix id of g
set gFront to frontmost of g
set diag to diag & gid & "(front=" & (gFront as string) & ",win=" & (count of windows of g) & ") "
if gFront then set end of frontIds to gid
end repeat
if $TARGET_PID is not 0 then
if (count of frontIds) is 0 then return "skip: no ghostty instance reports frontmost -- " & diag
if (count of frontIds) is greater than 1 then return "skip: " & (count of frontIds) & " ghostty instances claim frontmost, cannot tell which is focused -- " & diag
if (item 1 of frontIds) is not $TARGET_PID then return "skip: focused ghostty is pid " & (item 1 of frontIds) & ", not our instance $TARGET_PID -- " & diag
set frontApp to first application process whose unix id is $TARGET_PID
else
set frontApp to first application process whose frontmost is true
if name of frontApp is not "ghostty" then return "skip: frontmost is " & (name of frontApp)
end if
-- A Ghostty instance whose windows have all been closed still exists as
-- a process, and asking it for the front window raises a bare "Invalid
-- index (-1719)" that reads like a permissions or scripting fault rather
-- than the plain fact it is. Say the plain fact instead.
--
-- No backticks anywhere in this heredoc body: it is deliberately UNQUOTED
-- (<<APPLESCRIPT, not <<'APPLESCRIPT') so $TARGET_PID/$PANEL_CMD expand --
-- which means bash also runs any backtick-quoted text in here as a real
-- command substitution before osascript ever sees it. A "front window"
-- comment written with markdown-style backtick code-formatting shipped as
-- a live bug: bash executed "front window" as a command and osascript got
-- the AppleScript with that comment line silently missing, every run.
if (count of windows of frontApp) is 0 then return "skip: ghostty pid " & (unix id of frontApp) & " has no windows"
tell frontApp
set winSize to size of front window
set winWidth to item 1 of winSize
set numPresses to round ((winWidth * (50 - $PANEL_WIDTH_PCT)) / 1000)
delay 0.3
keystroke "d" using command down
delay 0.6
keystroke "$PANEL_CMD"
key code 36
delay 0.3
key code 123 using {command down, option down}
delay 0.2
repeat numPresses times
key code 124 using {command down, control down}
delay 0.05
end repeat
end tell
return "ok: width=" & winWidth & " presses=" & numPresses
end tell
APPLESCRIPT
)
osa_status=$?
log "attempt $attempt: osascript exit=$osa_status result=$result"
# No more keystrokes from this attempt either way. Only an "ok" sent the
# sequence that ends with focus back on the claude pane; a skip typed
# nothing, and the notice stays up through the retry.
release_keyboard_guard
case "$result" in ok:*) overlay_ready ;; esac
# Ground truth: did an actual new panel process appear? Don't trust the
# AppleScript's own report of success, verify it.
sleep 1
after_pids=$(panel_pids)
new_pids=$(comm -13 <(echo "$before_pids") /dev/null)
if [ -n "$new_pids" ]; then
log "attempt $attempt: VERIFIED: new panel process(es): $(echo "$new_pids" | tr '\n' ' ')"
verify_pin "$new_pids"
write_pane_pairing "$new_pids"
success=1
else
log "attempt $attempt: FAILED: no new panel process appeared (before=[$(echo "$before_pids" | tr '\n' ' ')] after=[$(echo "$after_pids" | tr '\n' ' ')])"
sleep 0.5
fi
done
if [ "$success" -eq 1 ]; then
log "done: succeeded on attempt $attempt/$max_attempts"
else
log "done: GAVE UP after $max_attempts attempts, panel did not launch"
log "done: troubleshooting: confirm cmd+opt+left / cmd+ctrl+right are not rebound in ~/.config/ghostty/config, confirm ~/.local/bin/ccusage-panel.sh is executable, try running it manually"
fi
exit 0
LAUNCH_EOF
chmod +x "$BIN_DIR/claude-panel-launch.sh"
# Install-time options, read at run time by the panel (CLAUDE_PANEL_CAFFEINATE)
# and by the `claude` wrapper / Finder launcher (CLAUDE_PANEL_REMOTE_CONTROL).
# An existing file is never overwritten: a key missing from it is appended
# with its default, preceded by its comment unless that comment is already
# there, so every key and every comment appears once, in a fresh file and in
# one an older setup wrote. One table, so a new option cannot get a comment
# in one place and a default in another.
PANEL_OPTIONS="$HOME/.config/claude-panel/options"
mkdir -p "$(dirname "$PANEL_OPTIONS")"
# The Telegram push defaults ON only where its credentials already exist. A
# fresh machine has no ~/Desktop/github/.creds, and defaulting on there meant
# every alert carried a "no phone push sent" notice for a channel nobody set
# up. Where the push IS switched on and the credentials later go missing, the
# hook still says so -- that is the silent breakage the notice exists for.
TG_DEFAULT=false
grep -q 'TELEGRAM_BOT_TOKEN' "$HOME/Desktop/github/.creds" 2>/dev/null \
&& grep -q 'TELEGRAM_CHAT_ID' "$HOME/Desktop/github/.creds" 2>/dev/null \
&& TG_DEFAULT=true
[ -f "$PANEL_OPTIONS" ] || printf '%s\n' \
"# claude-panel options -- true/false. Written by claude-panel-setup.sh." \
> "$PANEL_OPTIONS"
while IFS='|' read -r opt default comment; do
grep -qE "^$opt=" "$PANEL_OPTIONS" && continue
grep -qxF "# $opt: $comment" "$PANEL_OPTIONS" \
|| printf '# %s: %s\n' "$opt" "$comment" >> "$PANEL_OPTIONS"
printf '%s=%s\n' "$opt" "$default" >> "$PANEL_OPTIONS"
done < "$ZSHRC_BLOCK" </dev/null | tail -1)
v="${CLAUDE_PANEL_REMOTE_CONTROL:-${v#*=}}"
case "${(L)v//[\"\' ]/}" in true|1|yes|on) ;; *) return 1 ;; esac
case "${1:-}" in ''|-*) ;; *) return 1 ;; esac
local a
for a in "$@"; do
case "$a" in
-p|--print|-h|--help|-v|--version|--remote-control|--remote-control=*) return 1 ;;
esac
done
return 0
}
claude() {
local -a args
if [ -n "${CLAUDE_PANEL_PIN_SID:-}" ]; then
args=(--session-id "$CLAUDE_PANEL_PIN_SID")
unset CLAUDE_PANEL_PIN_SID
fi
if _ccusage_want_rc "$@"; then
local rc_name
rc_name=$("$HOME/.local/bin/claude-panel-rc-name" 2>/dev/null) || rc_name="${PWD:t}"
args+=(--remote-control "${rc_name:-${PWD:t}}")
fi
if (( $+functions[_ccusage_claude_orig] )); then
_ccusage_claude_orig "${args[@]}" "$@"
else
command claude "${args[@]}" "$@"
fi
}
# Is this command line an interactive claude session with no session flag
# of its own, i.e. one this hook can and should give a known --session-id?
# Not `claude -p`, `claude --version` or a subcommand (`claude mcp list`,
# `claude update`): none of those is the session a pane is showing.
_ccusage_is_fresh_session() {
local -a w; w=(${(z)1})
local i=${w[(i)claude]} a
(( i /dev/null || return
key=$(print -r -- "$PWD" | tr '/' '-')
print -r -- "$1"$'\t'"$now" > "$dir/.$key.$$" && mv -f "$dir/.$key.$$" "$dir/$key"
[ -n "$t" ] && print -r -- "$1"$'\t'"$now" > "$dir/tty/.$t.$$" && mv -f "$dir/tty/.$t.$$" "$dir/tty/$t"
}
_ccusage_panel_autolaunch() {
[[ "$1" =~ '(^|[[:space:]])claude([[:space:]]|$)' ]] || return
local pin_sid=""
if _ccusage_is_fresh_session "$1"; then
pin_sid=$(uuidgen | tr '[:upper:]' '[:lower:]')
export CLAUDE_PANEL_PIN_SID="$pin_sid"
fi
# Diagnostic: the pin/no-pin split is a silent decision with no other
# trace of it anywhere, when "no pin" turns out to be the overwhelming
# common case in practice, this is the only way to see the raw command
# line that drove it instead of guessing at which flag matched.
print -r -- "$(date '+%Y-%m-%d %H:%M:%S') [hook] cmd=[$1] pin_sid=${pin_sid:-none}${CCUSAGE_PANEL_LAUNCHED:+ (panel already open: re-pinning)}" >> ~/.cache/claude-panel-launch.log
# The panel is opened once per window, but claude can be exited and started
# again in the same pane any number of times. Each restart is a new
# session, and the panel beside it was still reading the pin written for
# the first one -- so it showed a session that had ended and none of the
# new turns. The SessionStart hook normally rewrites the pin, but only
# where the hook is installed and can see a claude with a terminal above
# it; this does not depend on either. (--resume/--continue still rely on
# the hook: only claude knows which session those pick.)
if [ -n "${CCUSAGE_PANEL_LAUNCHED:-}" ]; then
[ -n "$pin_sid" ] && _ccusage_write_pins "$pin_sid"
return
fi
export CCUSAGE_PANEL_LAUNCHED=1
# &! disowns: a plain & in an interactive shell prints "[1] + done ..."
# over the claude prompt when the launcher exits.
~/.local/bin/claude-panel-launch.sh "$pin_sid" &!
}
autoload -Uz add-zsh-hook
add-zsh-hook preexec _ccusage_panel_autolaunch
# --- end ccusage split-panel autolaunch ---
ZSHRC_EOF
# Replaced in place on every install rather than written once, so a change
# to the block reaches machines that already have it (it used to say
# "leaving it as-is", which meant an edit here never shipped). Only between
# both markers; with the end marker missing the block has been hand-edited
# and is left alone rather than guessed at.
if [ -f "$ZSHRC" ] && grep -qF "$MARKER" "$ZSHRC"; then
if grep -qxF "$END_MARKER" "$ZSHRC"; then
zshrc_new=$(mktemp "${TMPDIR:-/tmp}/zshrc.XXXXXX")
awk -v start="$MARKER" -v end="$END_MARKER" -v block="$ZSHRC_BLOCK" '
!skip && index($0, start) == 1 {
while ((getline l 0) print l
skip = 1; next
}
skip && $0 == end { skip = 0; next }
!skip
' "$ZSHRC" > "$zshrc_new"
if cmp -s "$zshrc_new" "$ZSHRC"; then
echo "~/.zshrc autolaunch hook is current."
else
cp "$ZSHRC" "$ZSHRC.bak-ccusage-$(date +%Y%m%d-%H%M%S)"
cat "$zshrc_new" > "$ZSHRC"
echo "Updated the autolaunch hook in ~/.zshrc (backup alongside it)."
fi
rm -f "$zshrc_new"
else
echo "~/.zshrc has the autolaunch hook but no end marker, hand-edited, leaving it as-is." >&2
fi
else
echo "Adding the autolaunch hook to ~/.zshrc ..."
{ printf '\n'; cat "$ZSHRC_BLOCK"; } >> "$ZSHRC"
fi
rm -f "$ZSHRC_BLOCK"
# If a `ghostty-claude-launcher` script exists (e.g. a Finder Service /
# Automator workflow that runs `open -na Ghostty.app --args -e
# ghostty-claude-launcher `), patch it too, that path execs
# `claude` directly with no interactive shell involved, so the preexec
# hook above never fires for it. Best-effort: inserts the launcher call
# immediately before the file's last line (its own launch line).
GCL="$BIN_DIR/ghostty-claude-launcher"
GCL_MARKER="# Auto-open the live ccusage stats panel"
if [ -f "$GCL" ] && grep -qF "$GCL_MARKER" "$GCL"; then
echo "~/.local/bin/ghostty-claude-launcher already patched, leaving it as-is."
elif [ -f "$GCL" ]; then
echo "Patching ~/.local/bin/ghostty-claude-launcher (Finder Service launch path) ..."
tmp=$(mktemp)
gcl_lines=$(wc -l "$tmp"
cat >> "$tmp" <> "$tmp"
;;
*)
printf '%s\n' "$tail_line" >> "$tmp"
;;
esac
done < &2
mv "$tmp" "$GCL"
chmod +x "$GCL"
else
echo "No ~/.local/bin/ghostty-claude-launcher found, skipping (not using that Finder Service workflow)."
fi
# CLAUDE_PANEL_REMOTE_CONTROL for the Finder launch path, which execs claude
# without the ~/.zshrc wrapper. A separate step from the patch above so that
# launchers patched before this option existed pick it up too: it reads the
# options file at launch time and adds --remote-control straight after the
# pinned --session-id, where the next token is the launcher's own flag.
GCL_RC_MARKER="# CLAUDE_PANEL_REMOTE_CONTROL (claude-panel options)"
GCL_PIN_LINE='"$CLAUDE" --session-id "$PIN_SID"'
if [ -f "$GCL" ] && grep -qF "$GCL_PIN_LINE" "$GCL" && ! grep -qF "$GCL_RC_MARKER" "$GCL"; then
echo "Adding the Remote Control option to ~/.local/bin/ghostty-claude-launcher ..."
rc_snip=$(mktemp)
cat > "$rc_snip" </dev/null | tail -1)"
rc_opt="$(printf '%s' "${rc_opt#*=}" | tr -d "\"' " | tr '[:upper:]' '[:lower:]')"
case "$rc_opt" in true|1|yes|on) PANEL_RC_ARGS=(--remote-control "$("$HOME/.local/bin/claude-panel-rc-name" 2>/dev/null || basename "$PWD")") ;; esac
GCL_RC_EOF
# Above the comment that sits on the launch line, if there is one, so the
# comment stays attached to the line it describes.
pin_n=$(grep -nF "$GCL_PIN_LINE" "$GCL" | head -1 | cut -d: -f1)
at_n=$pin_n
case "$(sed -n "$((pin_n - 1))p" "$GCL" | sed 's/^[[:space:]]*//')" in '#'*) at_n=$((pin_n - 1)) ;; esac
tmp=$(mktemp)
awk -v at="$at_n" -v pin_n="$pin_n" -v snip="$rc_snip" '
NR == at { while ((getline l 0) print l }
NR == pin_n {
sub(/"\$CLAUDE" --session-id "\$PIN_SID"/, "\"$CLAUDE\" --session-id \"$PIN_SID\" \"${PANEL_RC_ARGS[@]}\"")
}
{ print }
' "$GCL" > "$tmp"
rm -f "$rc_snip"
mv "$tmp" "$GCL"
chmod +x "$GCL"
fi
# Launchers patched before sessions were named: a bare --remote-control lets
# Claude Code invent "--", which says nothing on
# the phone. Name the session after its folder instead.
if [ -f "$GCL" ] && grep -qF 'PANEL_RC_ARGS=(--remote-control) ;;' "$GCL"; then
tmp=$(mktemp)
sed 's|PANEL_RC_ARGS=(--remote-control) ;;|PANEL_RC_ARGS=(--remote-control "$(basename "$PWD")") ;;|' "$GCL" > "$tmp"
mv "$tmp" "$GCL"
chmod +x "$GCL"
fi
# Launchers that name the session after its folder only: two sessions in
# one repository then share a name on the phone. Use claude-panel-rc-name.
if [ -f "$GCL" ] && grep -qF 'PANEL_RC_ARGS=(--remote-control "$(basename "$PWD")") ;;' "$GCL"; then
tmp=$(mktemp)
sed 's#PANEL_RC_ARGS=(--remote-control "$(basename "$PWD")") ;;#PANEL_RC_ARGS=(--remote-control "$("$HOME/.local/bin/claude-panel-rc-name" 2>/dev/null || basename "$PWD")") ;;#' "$GCL" > "$tmp"
mv "$tmp" "$GCL"
chmod +x "$GCL"
fi
# CLAUDE_PANEL_BYPASS_PERMISSIONS for the Finder launch path. Some launchers
# hard-code --dangerously-skip-permissions on the launch line, which made the
# dashboard's "Start with bypass permissions" checkbox untrue for those
# windows. The flag becomes an array the options file controls: true adds it,
# false drops it, and with the key absent the launcher keeps doing what it
# did before (flag or no flag), so upgrading changes nothing by itself.
# Typed sessions follow permissions.defaultMode in ~/.claude/settings.json,
# which the dashboard sets alongside this key.
GCL_BP_MARKER="# CLAUDE_PANEL_BYPASS_PERMISSIONS (claude-panel options)"
if [ -f "$GCL" ] && grep -qF "$GCL_PIN_LINE" "$GCL" && ! grep -qF "$GCL_BP_MARKER" "$GCL"; then
echo "Adding the bypass permissions option to ~/.local/bin/ghostty-claude-launcher ..."
pin_n=$(grep -nF "$GCL_PIN_LINE" "$GCL" | head -1 | cut -d: -f1)
bp_default="()"
sed -n "${pin_n}p" "$GCL" | grep -q -- '--dangerously-skip-permissions' && bp_default="(--dangerously-skip-permissions)"
bp_snip=$(mktemp)
{
echo "$GCL_BP_MARKER"
echo "PANEL_BYPASS_ARGS=$bp_default"
cat </dev/null | tail -1)"
bp_opt="$(printf '%s' "${bp_opt#*=}" | tr -d "\"' " | tr '[:upper:]' '[:lower:]')"
case "$bp_opt" in
true|1|yes|on) PANEL_BYPASS_ARGS=(--dangerously-skip-permissions) ;;
false|0|no|off) PANEL_BYPASS_ARGS=() ;;
esac
GCL_BP_EOF
} > "$bp_snip"
at_n=$pin_n
case "$(sed -n "$((pin_n - 1))p" "$GCL" | sed 's/^[[:space:]]*//')" in '#'*) at_n=$((pin_n - 1)) ;; esac
tmp=$(mktemp)
awk -v at="$at_n" -v pin_n="$pin_n" -v snip="$bp_snip" '
NR == at { while ((getline l 0) print l }
NR == pin_n {
gsub(/ --dangerously-skip-permissions/, "")
sub(/"\$CLAUDE" --session-id "\$PIN_SID"/, "\"$CLAUDE\" --session-id \"$PIN_SID\" \"${PANEL_BYPASS_ARGS[@]}\"")
}
{ print }
' "$GCL" > "$tmp"
rm -f "$bp_snip"
mv "$tmp" "$GCL"
chmod +x "$GCL"
fi
# The launcher drives Ghostty through its DEFAULT bindings (cmd+d,
# cmd+opt+left, cmd+ctrl+right), so nothing is added to ~/.config/ghostty.
# It used to append ctrl+shift+h/l resize keybinds and rely on a ctrl+h focus
# bind it never installed: a fresh machine had neither, so focus stayed on the
# panel and the split stayed 50/50. All that can break it now is a config
# that rebinds those defaults, so say so if one does.
GHOSTTY_CONF="$HOME/.config/ghostty/config"
if [ -f "$GHOSTTY_CONF" ]; then
rebound=$( {
grep -E '^[[:space:]]*keybind[[:space:]]*=[[:space:]]*(super|cmd)\+(alt|opt|option)\+(left|arrow_left)=' "$GHOSTTY_CONF" | grep -v 'goto_split:left'
grep -E '^[[:space:]]*keybind[[:space:]]*=[[:space:]]*(super|cmd)\+(ctrl|control)\+(right|arrow_right)=' "$GHOSTTY_CONF" | grep -v 'resize_split:right'
} 2>/dev/null )
if [ -n "$rebound" ]; then
echo "WARNING: ~/.config/ghostty/config rebinds a Ghostty default the launcher uses"
echo " (cmd+opt+left = focus left split, cmd+ctrl+right = resize):"
printf ' %s\n' "$rebound"
fi
fi
echo "Installing claude-panel-rc-name ..."
# The Remote Control session name: the folder, plus " 2", " 3" ... when a
# running claude already uses that name, so two sessions in one repository
# are told apart on the phone. Shared by the ~/.zshrc wrapper and the Finder
# launcher; both fall back to the bare folder name without it.
cat > "$BIN_DIR/claude-panel-rc-name" </dev/null | awk '
/(^| |\/)claude( |$)/ && / --remote-control / {
s = $0; sub(/.* --remote-control /, "", s); sub(/ --?[a-z].*$/, "", s); sub(/ .*$/, "", s); sub(/ +$/, "", s); print s
}')
name="$base"
n=1
while printf '%s\n' "$used" | grep -qxF -- "$name"; do
n=$((n + 1))
name="$base $n"
done
printf '%s\n' "$name"
RCNAME_EOF
chmod +x "$BIN_DIR/claude-panel-rc-name"
echo "Installing claude-day-projection.sh ..."
cat > "$BIN_DIR/claude-day-projection.sh" < $46 -> $22 across
# three 5s refreshes with nothing unusual happening).
#
# The forecast for the remaining hours is the persisted bucket cache's
# historical average per hour-of-day, SCALED by how today's pace compares
# with a typical day's pace so far. Unscaled it ignores today entirely: on a
# quiet day ($17.93 spent by 14:48 against a ~$274 historical average for
# hours 0-14) it forecast $215, back near the 30-day average, however light
# today had actually been.
# project_today
# -> " "
#
# elapsed_fraction is how much of a TYPICAL day's spend normally falls in the
# hours already gone. It is the honest measure of how far into the day we
# are for this purpose -- wall-clock is not, because these hours are not
# equally productive -- and it is returned rather than kept private so a
# caller can refuse to act on a projection built from a sliver of the day.
project_today() {
local today_amt="$1" buckets="$2" hour="$3"
local typical_so_far remaining_avg
IFS=$'\t' read -r typical_so_far remaining_avg <<<"$(jq -r --argjson ch "$hour" '
( [.buckets[]? | select(.hour $ch) | .avgCost] | add // 0 ) as $ra |
[$ts, $ra] | @tsv
' "$buckets" 2>/dev/null)"
[ -z "${typical_so_far:-}" ] && typical_so_far=0
[ -z "${remaining_avg:-}" ] && remaining_avg=0
# LC_ALL=C: awk's -v assignments parse in the C locale but its printf obeys
# LC_NUMERIC, and on an en_ZA machine that emits a comma -- which the
# caller then feeds back into another awk as a truncated number.
LC_ALL=C awk -v b="$today_amt" -v ts="$typical_so_far" -v ra="$remaining_avg" 'BEGIN{
# ratio 1 (no scaling) when there is no historical baseline yet, so a
# cold cache degrades to "today plus a typical remainder" rather than
# dividing by zero.
ratio = (ts > 0) ? b/ts : 1
total = ts + ra
frac = (total > 0) ? ts/total : 0
printf "%.4f %.4f %.4f %.4f", b + ratio*ra, ts, ra, frac
}'
}
PROJ_EOF
chmod +x "$BIN_DIR/claude-day-projection.sh"
echo "Installing claude-cost-alert-check.sh ..."
cat > "$BIN_DIR/claude-cost-alert-check.sh" <2x / >3x, same thresholds as ccusage-panel.sh, so "red"
# means the same thing here and in the panel), or
# - the ccusage split-panel launcher's last attempt for this window
# failed (see ~/.local/bin/claude-panel-launch.sh)
# Silent (no output) otherwise, in particular NOT on yellow, per request.
#
# It also emits a terminalSequence, so the Mac gets a desktop notification
# when it is the screen in use. That is additive, not a substitute: the
# sequence is discarded in the web app and in cloud sessions, so the
# systemMessage line remains the only thing that reaches a phone.
#
# Throttled per session so it fires once per tier increase and once per
# distinct launch failure, not on every single prompt: state is kept in
# ~/.cache/claude-cost-alert-state/.json.
set -uo pipefail
STATE_DIR="$HOME/.cache/claude-cost-alert-state"
LAUNCH_LOG="$HOME/.cache/claude-panel-launch.log"
mkdir -p "$STATE_DIR"
YELLOW_MULT=1.5
RED_MULT=2.0
PURPLE_MULT=3.0
# Two options from ~/.config/claude-panel/options (the Claude Burst dashboard
# switches both), read like the panel reads its own: quotes, spaces and case
# are tolerated, and anything unreadable falls back to the default.
# CLAUDE_PANEL_COST_ALERTS (default true): false silences the cost alerts
# (session tier, runaway day, bad day). The panel-launch failure alert
# still fires: it reports a broken install, not spend, and switching off
# spend alerts is no reason to hide that the panel never opened.
# CLAUDE_PANEL_ALERT_MIN_USD (default 5.00): a session below this never
# alerts, whatever its multiple of the average.
alert_option() { # $1 = KEY
local v
v=$(grep -E "^$1=" "$HOME/.config/claude-panel/options" 2>/dev/null | tail -1)
printf '%s' "${v#*=}" | tr -d "\"' " | tr '[:upper:]' '[:lower:]'
}
case "$(alert_option CLAUDE_PANEL_COST_ALERTS)" in
false|0|no|off) COST_ALERTS=0 ;;
*) COST_ALERTS=1 ;;
esac
MIN_SESSION_ALERT=$(alert_option CLAUDE_PANEL_ALERT_MIN_USD)
case "$MIN_SESSION_ALERT" in
''|.|*[!0-9.]*|*.*.*) MIN_SESSION_ALERT=5.00 ;;
esac
CCUSAGE_CACHE_DIR="$HOME/.cache/ccusage-panel-cache"
HOOK_CACHE_TTL=120
mkdir -p "$CCUSAGE_CACHE_DIR" 2>/dev/null
# ---- today's spend, against two control limits ----------------------------
#
# The session rule above cannot see this case at all. It compares ONE session
# against the average session, so a day made of twenty ordinary sessions
# never trips it however much it costs in total -- $150 can cross a day in
# silence, which is the gap this closes.
#
# TWO limits, because they answer different questions and only one of them
# is actionable:
#
# - PROJECTED end-of-day over mean + 2*sd. This is the "bad day" alert.
# It fires around the time the day's shape is clear but while there is
# still a day left to change, and it is the only one of the two you can
# act on. Backtested over 24 days of real history on a 14-day window it
# fires about once or twice a month.
# - ACTUAL spend over mean + 3*sd. Louder, later, and unarguable. A day
# total can only be judged once it has been spent, so on its own this is
# a postmortem -- worth having, not worth having alone.
#
# The window is 14 days, not 30. That choice does more work than the sigma
# multiplier does: on 30 days to 2026-09-09 mean+3sd was $787 and exactly
# one day in the window cleared it, because the window still carried a
# heavy fortnight from August. The same rule on a rolling 14 days sits near
# $190-370 and caught 2026-09-07 ($361.61). A limit set mostly by which
# fortnight happens to be in view is a limit that changes sensitivity while
# being told nothing new -- shortening the window is what stops the old
# regime dominating it.
#
# Both limits are reported by check-panel-status.sh rather than left
# implicit, because sd here is about the size of the mean and a threshold
# nobody can see is one nobody can tell has stopped being reachable.
DAILY_WINDOW_DAYS=14
DAILY_SIGMA_ACTUAL=3 # on spend already incurred
DAILY_SIGMA_PROJECTED=2 # on the end-of-day projection
MIN_DAILY_ALERT=15.00 # never alert below this, whatever the sigma says
MIN_DAILY_SAMPLE=7 # fewer prior days than this and sd is not a number
# worth acting on, so no daily alert is raised
# Refuse to project from a sliver of the day. Measured in TYPICAL SPEND
# elapsed rather than wall-clock, because these hours are not equally
# productive: at 09:00 a normal day has barely started spending, so a $40
# morning scales to a preposterous total and would alert on a day that then
# goes quiet. Below this fraction the projected rule stands down and only
# the actual one applies.
MIN_PROJECTION_ELAPSED=0.25
# Sourced, never reimplemented -- the panel draws this same projection as
# "Today's Predicted Value" and the two must not disagree, now that one of
# them is something an alert acts on.
DAY_PROJECTION_LIB="$HOME/.local/bin/claude-day-projection.sh"
[ -r "$DAY_PROJECTION_LIB" ] && . "$DAY_PROJECTION_LIB"
today_key=$(date +%Y-%m-%d)
# Throttled per DAY and shared across every session, not per session: the
# hook runs once per prompt in each open window, and N windows would
# otherwise each push the same day's alert. The claim is a `mkdir`, which is
# atomic on POSIX -- the loser of the race gets EEXIST and stays silent --
# where a test-then-write would let two concurrent prompts both pass the
# test.
#
# One claim EACH, so the early projected warning does not consume the later
# actual one: a day that is flagged at 14:00 and then genuinely blows past
# the 3-sigma line at 19:00 is two different pieces of news.
daily_claim_projected="$STATE_DIR/daily-$today_key-projected"
daily_claim_actual="$STATE_DIR/daily-$today_key-actual"
today_cost=0
today_proj=0
daily_limit_actual=0
daily_limit_projected=0
daily_mean=0
daily_sd=0
daily_n=0
proj_elapsed=0
proj_available=0
# Sets every daily_* / today_* / proj_* above. A function rather than a
# stretch of inline script because `--report` below has to show the operator
# the very numbers the alerts are gated on -- two implementations of one
# statistic is how the number on screen stops being the number in force.
compute_daily_stats() {
local since_day daily_args daily_key daily_file daily_json daily_mtime daily_stats
local hour proj_out
since_day=$(date -v-"$(( DAILY_WINDOW_DAYS - 1 ))"d +%Y%m%d 2>/dev/null \
|| date -d "$(( DAILY_WINDOW_DAYS - 1 )) days ago" +%Y%m%d)
daily_args="claude daily --json --since $since_day --offline"
daily_key=$(printf '%s' "$daily_args" | shasum -a 256 | cut -c1-16)
daily_file="$CCUSAGE_CACHE_DIR/$daily_key.json"
daily_json=""
if [ -f "$daily_file" ]; then
daily_mtime=$(stat -f %m "$daily_file" 2>/dev/null || stat -c %Y "$daily_file" 2>/dev/null || echo 0)
if (( $(date +%s) - daily_mtime /dev/null)
fi
fi
if [ -z "$daily_json" ]; then
daily_json=$(ccusage claude daily --json --since "$since_day" --offline 2>/dev/null \
| jq -c '{daily: (.daily // .dailies // [])}' 2>/dev/null)
if [ -n "$daily_json" ] && jq -e '.daily' >/dev/null 2>&1 << "$daily_file.$$.tmp" 2>/dev/null &&
mv "$daily_file.$$.tmp" "$daily_file" 2>/dev/null
fi
fi
# Today is excluded from the statistics it is being judged against, for
# the same reason the session baseline now excludes the current session --
# and doubly so here, because today is a PARTIAL day being compared with
# complete ones.
#
# Days with no activity are simply absent from ccusage's rows, so a
# fortnight off does not drag the mean toward zero. That also means
# daily_n counts DAYS WORKED, not days elapsed, which is why the report
# prints it.
#
# The payload arrives in the environment, not on stdin: stdin is already
# carrying the script itself via the heredoc, and a `<<<` on top of that
# silently loses the data rather than erroring -- json.load then reads the
# consumed script, returns nothing, and the alert simply never fires.
daily_stats=$(DAILY_JSON="$daily_json" \
python3 - "$today_key" "$DAILY_SIGMA_ACTUAL" "$DAILY_SIGMA_PROJECTED" "$MIN_DAILY_SAMPLE" </dev/null
import json, os, statistics as st, sys
today_key = sys.argv[1]
sig_a, sig_p, min_n = float(sys.argv[2]), float(sys.argv[3]), int(sys.argv[4])
try:
rows = json.loads(os.environ.get("DAILY_JSON") or "{}").get("daily", [])
except Exception:
rows = []
by_day = {}
for r in rows:
day = r.get("date") or r.get("period")
if day:
by_day[day] = float(r.get("totalCost") or 0)
today = by_day.get(today_key, 0.0)
prior = [v for d, v in by_day.items() if d != today_key]
if len(prior) >= min_n:
mean, sd = st.mean(prior), st.stdev(prior)
lim_a, lim_p = mean + sig_a * sd, mean + sig_p * sd
else:
mean = st.mean(prior) if prior else 0.0
sd = lim_a = lim_p = 0.0
print(f"{today:.4f} {lim_a:.4f} {lim_p:.4f} {mean:.4f} {sd:.4f} {len(prior)}")
PYEOF
)
read -r today_cost daily_limit_actual daily_limit_projected daily_mean daily_sd daily_n \
<</dev/null 2>&1 && [ -r "$HOME/.cache/claude-hourly-buckets.json" ]; then
proj_out=$(project_today "$today_cost" "$HOME/.cache/claude-hourly-buckets.json" "$hour" 2>/dev/null)
read -r today_proj _ts _ra proj_elapsed <<= m)}'; then
proj_available=1
fi
else
today_proj="$today_cost"
proj_elapsed=0
proj_available=0
fi
}
# The sample behind either limit has to be big enough to mean anything.
daily_sample_ok() {
[ "${daily_n:-0}" -ge "$MIN_DAILY_SAMPLE" ] 2>/dev/null
}
# True when spend already incurred is over the 3-sigma line.
daily_over_limit() {
daily_sample_ok || return 1
awk -v v="$today_cost" -v l="$daily_limit_actual" -v f="$MIN_DAILY_ALERT" \
'BEGIN{exit !(l > 0 && v > l && v >= f)}'
}
# True when the day is PROJECTED to end over the 2-sigma line -- the "bad
# day" rule. Requires a usable projection and enough of a typical day's
# spend already elapsed to be extrapolating from something.
daily_projected_over_limit() {
daily_sample_ok || return 1
[ "${proj_available:-0}" -eq 1 ] || return 1
awk -v v="$today_proj" -v l="$daily_limit_projected" -v f="$MIN_DAILY_ALERT" \
'BEGIN{exit !(l > 0 && v > l && v >= f)}'
}
# `--report`: print the control limits rather than act on them, for
# check-panel-status.sh. It runs the same compute_daily_stats() the alerts
# are gated on, so what the operator is shown cannot drift from what is
# enforced -- and a sigma limit on a distribution whose sd is the size of
# its mean is exactly the kind of threshold that quietly stops being
# reachable, which is the whole reason it is worth printing at all.
if [ "${1:-}" = "--report" ]; then
compute_daily_stats
printf 'window: %s day(s) worked in the last %s, minimum %s\n' \
"$daily_n" "$DAILY_WINDOW_DAYS" "$MIN_DAILY_SAMPLE"
LC_ALL=C awk -v m="$daily_mean" -v sd="$daily_sd" -v la="$daily_limit_actual" \
-v lp="$daily_limit_projected" -v t="$today_cost" -v tp="$today_proj" \
-v f="$MIN_DAILY_ALERT" -v sa="$DAILY_SIGMA_ACTUAL" -v sp="$DAILY_SIGMA_PROJECTED" 'BEGIN {
printf "mean: $%.2f sd $%.2f\n", m, sd
printf "bad day: $%.2f (mean + %s sd, on the projection)\n", lp, sp
printf "runaway: $%.2f (mean + %s sd, on actual spend; floor $%.2f)\n", la, sa, f
printf "today: $%.2f spent, $%.2f projected\n", t, tp
}'
if ! daily_sample_ok; then
printf 'status: NO DAILY ALERT POSSIBLE -- too few days to estimate sd\n'
else
if [ "${proj_available:-0}" -eq 1 ]; then
printf 'projection: usable (%s%% of a typical day elapsed)\n' \
"$(LC_ALL=C awk -v f="$proj_elapsed" 'BEGIN{printf "%.0f", f*100}')"
elif [ ! -r "$HOME/.cache/claude-hourly-buckets.json" ]; then
# Said plainly: with no buckets the bad-day rule is not merely quiet,
# it is switched off, and nothing else would ever tell you.
printf 'projection: UNAVAILABLE -- no hourly buckets yet (run the panel once)\n'
printf ' the bad-day alert cannot fire until then\n'
else
printf 'projection: standing down -- only %s%% of a typical day elapsed (needs %s%%)\n' \
"$(LC_ALL=C awk -v f="$proj_elapsed" 'BEGIN{printf "%.0f", f*100}')" \
"$(LC_ALL=C awk -v f="$MIN_PROJECTION_ELAPSED" 'BEGIN{printf "%.0f", f*100}')"
fi
if daily_over_limit; then
printf 'status: OVER THE RUNAWAY LIMIT\n'
elif daily_projected_over_limit; then
printf 'status: PROJECTED OVER THE BAD-DAY LIMIT\n'
else
printf 'status: under both limits\n'
fi
fi
exit 0
fi
# Claude Code passes this hook's own session_id on stdin as JSON (the
# UserPromptSubmit payload), read that instead of guessing "most recently
# modified transcript file" via `ls -t ~/.claude/projects/*/*.jsonl`, which
# picks up whichever session anywhere on the machine last wrote a line and
# would alert on (or throttle-state-track) the WRONG session whenever a
# second Claude Code window is active.
hook_input=$(cat)
session_id=$(jq -r '.session_id // empty' <</dev/null)
[ -z "$session_id" ] && exit 0
hook_cwd=$(jq -r '.cwd // empty' <</dev/null)
state_file="$STATE_DIR/$session_id.json"
# This hook runs on EVERY prompt submit, and each `ccusage` invocation
# parses every transcript under ~/.claude/projects (hundreds of MB) to answer
# -- so the two uncached calls that used to live here cost a full
# double corpus scan per prompt, on the interactive path, inside a 5s
# timeout. Worse, the second was pure waste: `session --json -i `
# returns the same all-time `.totalCost` for that session that the FIRST
# call's payload already lists under `.session[] | select(.period==)`
# (verified identical across every active session). One call now answers
# both questions.
#
# What remains is cached in ccusage-panel.sh's cache directory using that
# script's exact key scheme -- sha256 of the argument string, first 16
# chars -- so this is the same cache entry the panel's own 7-day-average
# call writes. Whenever a panel is open the hook pays nothing at all; when
# none is, the hook populates it for the panel instead. Deliberately NOT
# keyed on transcript mtime like the panel's per-session cache: a prompt
# submit always follows a transcript write, so an mtime key would miss
# every single time and cache nothing.
#
# The TTL is generous because of what this value is FOR: a 7-day rolling
# average moves imperceptibly minute to minute, and it only ever gates a
# >2x escalation alert above a $5 floor. Staleness here cannot change an
# alert decision that a fresh read would not also have made.
since7=$(date -v-7d +%Y%m%d 2>/dev/null || date -d '7 days ago' +%Y%m%d)
# Scoped to Claude Code, like the panel's own queries. Unscoped, `ccusage
# session` covers every detected agent CLI, so the 7-day average this hook
# alerts against was diluted by OpenCode and anything else installed -- and
# an alert threshold computed from the wrong denominator fires at the wrong
# time, in a hook whose per-session throttle then eats the real crossing.
cache_args="claude session --json --since $since7 --offline"
cache_key=$(printf '%s' "$cache_args" | shasum -a 256 | cut -c1-16)
cache_file="$CCUSAGE_CACHE_DIR/$cache_key.json"
sessions_json=""
if [ -f "$cache_file" ]; then
cache_mtime=$(stat -f %m "$cache_file" 2>/dev/null || stat -c %Y "$cache_file" 2>/dev/null || echo 0)
if (( $(date +%s) - cache_mtime /dev/null)
fi
fi
if [ -z "$sessions_json" ]; then
# `claude session` nests under `.sessions`; normalised to the `.session`
# this file and the panel both read. Same adapter, same reason, as
# ccusage-panel.sh's all_sessions().
sessions_json=$(ccusage claude session --json --since "$since7" --offline 2>/dev/null \
| jq -c '{session: (.sessions // .session // [])}' 2>/dev/null)
# Only a parseable payload is cached -- writing an empty or truncated
# result would poison the panel's cache too, since they share this file.
if [ -n "$sessions_json" ] && jq -e '.session' >/dev/null 2>&1 << "$cache_file.$$.tmp" 2>/dev/null &&
mv "$cache_file.$$.tmp" "$cache_file" 2>/dev/null
fi
fi
# The current session is excluded from its own baseline. It was not, and
# that is self-defeating in exactly the case the alert exists for: a runaway
# session is a member of the set whose average it is measured against, so
# the further it runs the higher it drags the bar it has to clear. Measured
# on a $42.13 session against three ~$8 ones, including it reported "2.5x a
# $16.68 average" where the honest answer is 5.1x an $8.20 average -- the
# alert fires late, and with a per-tier throttle a late fire can mean the
# real crossing is never reported at all.
avg_session_cost=$(jq -r --arg s "$session_id" '
[.session[] | select(.period != $s) | .totalCost] | map(select(. > 0.05)) |
if length >= 3 then (add/length) else 0 end
' <</dev/null)
[ -z "$avg_session_cost" ] && avg_session_cost="0"
# A session with no billable activity yet is simply absent from the list;
# 0 is the same answer the old `-i` call gave for it, and is below
# MIN_SESSION_ALERT regardless.
session_cost=$(jq -r --arg s "$session_id" \
'[.session[] | select(.period == $s) | .totalCost][0] // 0' <</dev/null)
[ -z "$session_cost" ] && session_cost="0"
tier="normal"
if awk -v v="$session_cost" -v f="$MIN_SESSION_ALERT" 'BEGIN{exit !(v>=f)}'; then
if awk -v a="$avg_session_cost" -v v="$session_cost" -v m="$PURPLE_MULT" 'BEGIN{exit !(a>0 && v>a*m)}'; then
tier="purple"
elif awk -v a="$avg_session_cost" -v v="$session_cost" -v m="$RED_MULT" 'BEGIN{exit !(a>0 && v>a*m)}'; then
tier="red"
elif awk -v a="$avg_session_cost" -v v="$session_cost" -v m="$YELLOW_MULT" 'BEGIN{exit !(a>0 && v>a*m)}'; then
tier="yellow"
fi
fi
alert_daily=0
alert_badday=0
# Skip the query entirely once BOTH of today's alerts are spent -- that is
# what bounds the cost of a second corpus scan on the interactive path.
if [ ! -d "$daily_claim_actual" ] || [ ! -d "$daily_claim_projected" ]; then
compute_daily_stats
# Claim before saying anything: if another window got there first, mkdir
# fails and this one stays quiet.
if [ ! -d "$daily_claim_actual" ] && daily_over_limit; then
mkdir "$daily_claim_actual" 2>/dev/null && alert_daily=1
fi
if [ ! -d "$daily_claim_projected" ] && daily_projected_over_limit; then
mkdir "$daily_claim_projected" 2>/dev/null && alert_badday=1
fi
# The actual limit is strictly above the projected one, so crossing it
# implies the day was always going to be flagged. Saying both at once is
# two lines making one point, and the louder one is the true one.
if [ "$alert_daily" -eq 1 ] && [ "$alert_badday" -eq 1 ]; then
alert_badday=0
mkdir "$daily_claim_projected" 2>/dev/null || true
fi
fi
last_launch_line=""
launch_failed=0
if [ -f "$LAUNCH_LOG" ]; then
last_launch_line=$(grep "done:" "$LAUNCH_LOG" | tail -1)
[[ "$last_launch_line" == *"GAVE UP"* ]] && launch_failed=1
fi
prev_tier="normal"
prev_launch_line=""
if [ -f "$state_file" ]; then
prev_tier=$(jq -r '.tier // "normal"' "$state_file" 2>/dev/null)
prev_launch_line=$(jq -r '.launch_line // ""' "$state_file" 2>/dev/null)
fi
severity() { case "$1" in normal) echo 0 ;; yellow) echo 1 ;; red) echo 2 ;; purple) echo 3 ;; *) echo 0 ;; esac; }
alert_cost=0
if { [ "$tier" = "red" ] || [ "$tier" = "purple" ]; } && [ "$(severity "$tier")" -gt "$(severity "$prev_tier")" ]; then
alert_cost=1
fi
alert_launch=0
if [ "$launch_failed" -eq 1 ] && [ "$last_launch_line" != "$prev_launch_line" ]; then
alert_launch=1
fi
# Cost alerts switched off: drop them here rather than skipping the work
# above, so the tier state keeps tracking and turning alerts back on does not
# fire at once for a tier the session reached while they were off.
if [ "$COST_ALERTS" -eq 0 ]; then
alert_cost=0; alert_daily=0; alert_badday=0
fi
# Persist state unconditionally (tracks de-escalation too, so a later
# re-escalation to the same tier alerts again).
python3 - "$state_file" "$tier" "$last_launch_line" </dev/null
if [ -n "${TELEGRAM_BOT_TOKEN:-}" ] && [ -n "${TELEGRAM_CHAT_ID:-}" ]; then
tg_state="ready"
fi
fi
tg_body_file=$(mktemp "${TMPDIR:-/tmp}/claude-cost-alert.XXXXXX")
python3 - "$alert_cost" "$alert_launch" "$tier" "$session_cost" "$avg_session_cost" \
"$term_program" "$tg_state" "$tg_body_file" "$session_id" "${hook_cwd:-}" \
"$alert_daily" "$today_cost" "$daily_limit_actual" "$daily_mean" "$daily_n" \
"$DAILY_SIGMA_ACTUAL" "$alert_badday" "$today_proj" "$daily_limit_projected" \
"$DAILY_SIGMA_PROJECTED" "$DAILY_WINDOW_DAYS" < 0 else 0
if tier == "purple":
head, tail = "\U0001f7e3 RUNAWAY COST", ", consider wrapping up or starting a fresh session"
else:
head, tail = "\U0001f534 COST ALERT", ""
lines.append(
f"{head}: ${cost:.2f} this session, {mult:.1f}x your ${avg:.2f} average{tail}"
)
context.append(
f"This session has cost ${cost:.2f}, {mult:.1f}x the 7-day average session cost of ${avg:.2f}."
)
if alert_launch == "1":
lines.append(
"⚠️ PANEL DIDN'T LAUNCH: no usage panel for this window (see ~/.cache/claude-panel-launch.log)"
)
context.append("The ccusage split-panel failed to launch for this window.")
# Only the chat line carries this. It is a note to the operator about a
# broken channel, not part of the alert, so it must not reach the model's
# context or the desktop popup -- and it obviously cannot reach the phone,
# the phone being the thing that is broken.
chat_lines = list(lines)
if tg_state == "unconfigured":
chat_lines.append(
"ℹ️ no phone push sent: TELEGRAM_BOT_TOKEN/TELEGRAM_CHAT_ID missing from ~/Desktop/github/.creds"
)
# The phone message. No per-line prefix to repeat here, so the alert lines go
# through unchanged -- the first one is what a lock screen shows -- followed
# by which of several open sessions this actually was, the question you ask
# before you can act on it.
if tg_state == "ready":
project = os.path.basename(hook_cwd.rstrip("/")) if hook_cwd else ""
tg = list(lines)
tg.append("")
tg.append(f"project: {project or 'unknown'}")
tg.append(f"session: {session_id[:8]}")
with open(tg_body_file, "w") as f:
f.write("\n".join(tg) + "\n")
out = {
"systemMessage": "\n".join(chat_lines),
"hookSpecificOutput": {
"hookEventName": "UserPromptSubmit",
"additionalContext": " ".join(context),
},
}
# A desktop notification on top of the in-chat line, for when the Mac is the
# screen being looked at. BEL is universal; OSC 777 is gated on Ghostty
# because a terminal that does not implement it prints the payload as text.
# Neither reaches a phone -- the docs are explicit that terminalSequence is
# discarded in the web app and in cloud sessions.
seq = "\a"
if term_program == "ghostty":
# OSC 777 delimits on ';', so any semicolon in the body would truncate
# the notification at that point.
body = lines[0].replace(";", ",")
seq = f"\033]777;notify;Claude Code;{body}\a"
out["hookSpecificOutput"]["terminalSequence"] = seq
print(json.dumps(out))
PYEOF
# Detached and backgrounded on purpose. This hook sits on the interactive
# path under a 5s timeout, and a slow or unreachable api.telegram.org must
# add exactly zero seconds to a prompt submission -- the hook's JSON has
# already been printed by the time this runs, and nothing downstream reads
# the send's result.
#
# The message goes over `--data-urlencode text@file` rather than on the
# command line, so it never appears in `ps`. curl's own stderr is discarded
# rather than logged: it can echo the request URL, and that URL contains the
# bot token.
if [ "$tg_state" = "ready" ] && [ -s "$tg_body_file" ]; then
(
if ! curl -s --max-time 20 \
-X POST "https://api.telegram.org/bot${TELEGRAM_BOT_TOKEN}/sendMessage" \
--data-urlencode "chat_id=${TELEGRAM_CHAT_ID}" \
--data-urlencode "text@${tg_body_file}" \
-o /dev/null 2>/dev/null; then
printf '%s send failed (session %s)\n' "$(date '+%Y-%m-%dT%H:%M:%S%z')" "$session_id" >> "$TG_LOG"
fi
rm -f "$tg_body_file"
) >/dev/null 2>&1 &
disown 2>/dev/null || true
else
rm -f "$tg_body_file"
fi
ALERT_EOF
chmod +x "$BIN_DIR/claude-cost-alert-check.sh"
CLAUDE_SETTINGS="$HOME/.claude/settings.json"
ALERT_CMD="~/.local/bin/claude-cost-alert-check.sh"
# Created when missing rather than skipped. A machine where Claude Code has
# never had a setting changed has no settings.json, and skipping it there
# meant no cost alerts and no SessionStart pin on exactly the fresh installs.
if [ ! -f "$CLAUDE_SETTINGS" ] && [ -d "$HOME/.claude" ]; then
printf '{}\n' > "$CLAUDE_SETTINGS" && echo "Created ~/.claude/settings.json for the panel's hooks."
fi
if [ -f "$CLAUDE_SETTINGS" ]; then
if jq -e --arg cmd "$ALERT_CMD" '
(.hooks.UserPromptSubmit // []) | any(.hooks[]?.command == $cmd)
' "$CLAUDE_SETTINGS" >/dev/null 2>&1; then
echo "~/.claude/settings.json already has the cost-alert hook, leaving as-is."
else
tmp=$(mktemp)
jq --arg cmd "$ALERT_CMD" '
.hooks //= {} |
.hooks.UserPromptSubmit //= [] |
.hooks.UserPromptSubmit += [{"hooks": [{"type": "command", "command": $cmd, "timeout": 5}]}]
' "$CLAUDE_SETTINGS" > "$tmp" && mv "$tmp" "$CLAUDE_SETTINGS"
echo "Added the cost-alert hook to ~/.claude/settings.json (UserPromptSubmit)."
fi
else
echo "No ~/.claude/settings.json found, skipping the cost-alert hook."
fi
SESSION_HOOK_CMD="~/.local/bin/claude-panel-session-hook.sh"
if [ -f "$CLAUDE_SETTINGS" ]; then
if jq -e --arg cmd "$SESSION_HOOK_CMD" '
(.hooks.SessionStart // []) | any(.hooks[]?.command == $cmd)
' "$CLAUDE_SETTINGS" >/dev/null 2>&1; then
echo "~/.claude/settings.json already has the session-pin hook, leaving as-is."
else
tmp=$(mktemp)
# No matcher: every SessionStart source (startup, resume, clear, compact)
# is equally "the session in this pane is now X", which is the whole
# question the panel is trying to answer.
jq --arg cmd "$SESSION_HOOK_CMD" '
.hooks //= {} |
.hooks.SessionStart //= [] |
.hooks.SessionStart += [{"hooks": [{"type": "command", "command": $cmd, "timeout": 5}]}]
' "$CLAUDE_SETTINGS" > "$tmp" && mv "$tmp" "$CLAUDE_SETTINGS"
echo "Added the session-pin hook to ~/.claude/settings.json (SessionStart)."
fi
else
echo "No ~/.claude/settings.json found, skipping the session-pin hook."
echo " (the panel will still get its pin from claude-panel-launch.sh, but"
echo " --resume/--continue and GUI launches will fall back to guessing)"
fi
# ---- the usage-panel mod: this panel in a sidebar inside Claude Code ----
# Installed from this checkout's mods/usage-panel when Claude Code loads mods.
# While it is installed the split launcher stands aside, so no keystrokes are
# typed into Ghostty; CLAUDE_PANEL_SPLIT=true in the options file brings the
# split back. A setup run from outside a checkout has no mod to install.
SETUP_DIR="$(cd "$(dirname "${BASH_SOURCE[0]}")" && pwd)"
if [ -f "$SETUP_DIR/install-mod.sh" ]; then
zsh "$SETUP_DIR/install-mod.sh" install
fi
echo
if [ -f "$HOME/.config/claude-panel/mod-installed" ]; then
echo "Done. New Claude Code sessions open the panel as a sidebar (the usage-panel"
echo "mod). /usage-panel opens it, /usage-panel unpin stops it opening by itself."
else
echo "Done. Open a NEW terminal window/tab (or 'source ~/.zshrc') and type"
echo "any 'claude...' command, it'll auto-split right and start the panel."
echo "Same goes for the 'Launch Claude Code in Ghostty' Finder Service, if"
echo "you use one (patched above when present)."
fi
echo "Run the panel manually any time with: ~/.local/bin/ccusage-panel.sh"
echo
# Claude Burst (a separate, optional gateway) writes metrics.jsonl, which the
# turn table reads for its Pauseless Compaction rows. Neither needs the other.
if [ -d "$HOME/.config/claude-burst" ]; then
echo "Claude Burst detected: the turn table marks its Pauseless Compaction (Started,"
echo "Pending and Finished rows, a green negative delta, and the summary cost in the"
echo "session total)."
else
echo "Optional: Claude Burst (https://github.com/andrewbakercloudscale/claude-burst)"
echo "compacts long subscription sessions at the proxy, and this panel's turn table"
echo "then shows each compaction and what it cost."
fi
if [ -x "$BIN_DIR/claude-panel-keyblock" ] && [ ! -f "$HOME/.config/claude-panel/mod-installed" ]; then
echo
echo "The first auto-split will prompt macOS for two more permissions, for"
echo "claude-panel-keyblock this time, grant BOTH Accessibility and Input"
echo "Monitoring (System Settings > Privacy & Security) or the keyboard"
echo "guard silently no-ops and typing during window setup can interfere"
echo "again, same as before it existed."
fi
EOFThat is the exact tool behind the case study in section 1.
5. How To Instrument OpenCode
Start with opencode-tokenscope. It is a plugin, not a separate dashboard: add it, restart OpenCode, then run /tokenscope. It turns OpenCode’s own recorded telemetry into a report covering fresh input against cache reads and writes per step, a retained content inventory broken down by system prompt, user turns, assistant turns and replayable tool output, cache hit rate and estimated savings at public rates, and recursive subagent totals so a delegated call’s cost rolls up into the session that spawned it. That last part matters specifically for checking whether a subagent is actually cheaper once its own cost is counted, which is exactly the isolation lever covered in the companion piece on cost optimisation.
# in your opencode.json plugin array
"plugin": ["@ramtinj95/opencode-tokenscope@latest"]
That alone gets the plugin loaded, but the /tokenscope command itself needs one more file:
mkdir -p ~/.config/opencode/command
cat > ~/.config/opencode/command/tokenscope.md << 'EOF'
---
description: Analyze token usage across the current session with detailed breakdowns by category
---
Call the tokenscope tool directly without delegating to other agents. Then cat the token-usage-output.txt.
EOF
If you want a running dashboard rather than a report you ask for, opencode-token-monitor tracks input, output, reasoning and cache tokens in real time, breaks cost down by agent and by agent crossed with model, keeps a persistent history so you get week over week trend charts, and fires a toast notification when a session crosses a budget threshold you set. Same install pattern, one line in the plugin array.
If the complaint is specifically that the interface itself shows too little, opencode-throughput puts token rate, latency and running cost directly into a sidebar inside the OpenCode TUI rather than a report you have to go and generate. That is the direct fix for wanting more than a summary number on screen while you work.
For a team rather than a single laptop, opencode-plugin-otel exports the same session, token, cost and tool duration signals over OpenTelemetry to whatever you already run, Datadog, Honeycomb, Grafana Cloud, and deliberately mirrors the signal names Claude Code’s own monitoring uses, so a dashboard built for one reads the other. Worth the extra setup once more than one developer needs to see the same numbers; overkill before that.
If you are driving this through OpenCode and want the same live terminal panel rather than a report you ask for, the equivalent is a small installer built directly against OpenCode’s own CLI: opencode session list --format json to find the current session, and opencode export <id> to read it turn by turn. Both are confirmed, documented commands. The exact JSON shape of opencode stats --json is not confirmed as of the version this was written against, so the today and weekly totals in the panel below deliberately show opencode stats‘s own plain output rather than a parsed table; if your installed version supports --json cleanly, that section is the one to upgrade. One genuine advantage over the Claude Code version: OpenCode already computes a cost figure per message, so there is no price table to keep up to date. The launcher below carries the same retry and verify logic as the Claude Code one rather than a simpler version, checking for an actual new panel process after each attempt instead of trusting the AppleScript’s own report, since there is no reason the failure mode described above would be specific to one tool.
cat < opencode-panel-setup.sh
#!/usr/bin/env bash
# Installs the OpenCode live usage panel + auto-split launcher.
#
# What this sets up:
#   ~/.local/bin/opencode-panel.sh        - live stats panel (per-turn
#                                            breakdown of the current
#                                            session, 7-day baseline
#                                            flagging, today/week/month
#                                            via `opencode stats`)
#   ~/.local/bin/opencode-panel-launch.sh - opens a right-hand Ghostty
#                                            split running the panel above
#   ~/.zshrc (appended, idempotent)       - a preexec hook that runs the
#                                            launcher once per terminal
#                                            window, the first time an
#                                            `opencode*` command is typed
#
# Requirements: macOS + Ghostty (for the auto-split part — the panel
# script itself works in any terminal), the `opencode` CLI on your PATH,
# and jq. Accessibility permission for Ghostty/Terminal is needed for the
# System Events automation (macOS will prompt the first time).
#
# What this does NOT try to do: parse `opencode stats --json`. As of the
# version this was written against, session list JSON is confirmed
# (`opencode session list --format json`) and session export JSON is
# confirmed (`opencode export `), but the exact JSON shape of
# `opencode stats --json` is not, so the today/week/month section below
# shells out to plain `opencode stats` and shows its own output rather
# than guessing at field names. If your installed version supports
# `--json` on stats cleanly, that section is the one to upgrade.
#
# Safe to re-run: overwrites the two scripts with the latest version and
# skips the .zshrc block if it's already present.
set -uo pipefail

BIN_DIR="$HOME/.local/bin"
mkdir -p "$BIN_DIR"

echo "Installing opencode-panel.sh ..."
cat > "$BIN_DIR/opencode-panel.sh" < w) plain = substr(plain, 1, w + n_cont); printf "%s\033[K\n", (vis_len > w ? plain : line) }'; }

fmt_money() { printf '$%.2f' "${1:-0}"; }
fmt_m() { awk -v n="${1:-0}" 'BEGIN{ printf "%.2fM", n/1000000 }'; }
# value yellow_threshold red_threshold -> green/yellow/red. No historical
# baseline to compare against (unlike the Claude Code panel's ccusage-backed
# tier_color) — Together AI/opencode has no equivalent of ccusage's flexible
# --since/--until session query, so these are fixed heuristic dollar/percent
# cutoffs rather than "vs. your own recent average". Adjust if they don't
# match your actual usage pattern.
threshold_color() {
  local v="$1" yt="$2" rt="$3" color="$C_GREEN"
  awk -v v="$v" -v t="$yt" 'BEGIN{exit !(v+0>t)}' && color="$C_YELLOW"
  awk -v v="$v" -v t="$rt" 'BEGIN{exit !(v+0>t)}' && color="$C_RED"
  printf '%s' "$color"
}

# Looks up a model's context-window size via `opencode models --verbose`,
# which takes ~1s (it hits models.dev), so the result is cached to disk for
# 10 minutes — a model's context limit never changes mid-session, and this
# runs on every 5s refresh tick otherwise.
model_context_limit() {
  local provider="$1" model="$2"
  local cache_dir="$HOME/.cache/opencode-panel-model-limits"
  mkdir -p "$cache_dir" 2>/dev/null
  local cache_key cache_file cache_age
  cache_key=$(printf '%s_%s' "$provider" "$model" | tr '/ ' '__')
  cache_file="$cache_dir/$cache_key"
  if [ -f "$cache_file" ]; then
    cache_age=$(( $(date +%s) - $(stat -f %m "$cache_file" 2>/dev/null || stat -c %Y "$cache_file" 2>/dev/null || echo 0) ))
    if [ "$cache_age" -lt 600 ]; then
      cat "$cache_file"
      return
    fi
  fi
  local limit
  limit=$(opencode models "$provider" --verbose 2>/dev/null | python3 -c '
import sys, json, re
provider, target = sys.argv[1], sys.argv[2]
text = sys.stdin.read()
for block in re.split(r"\n(?=" + re.escape(provider) + r"/)", text.strip()):
    parts = block.split("\n", 1)
    if len(parts) != 2:
        continue
    try:
        d = json.loads(parts[1])
    except json.JSONDecodeError:
        continue
    if d.get("id") == target:
        print((d.get("limit") or {}).get("context", 0))
        break
' "$provider" "$model" 2>/dev/null)
  [ -z "$limit" ] && limit=0
  echo "$limit" > "$cache_file" 2>/dev/null
  printf '%s' "$limit"
}

# jq expression tried against two plausible `session list --format json`
# shapes (flat time_created, or nested time.created / sessionID), sorted
# newest first. If neither field exists on your version, this falls back
# to whatever order the CLI already returns.
FIND_LATEST='sort_by(.time_created // .time.created // .timeCreated // .created // 0) | reverse | .[0] | (.id // .sessionID // .session_id // "")'
BASELINE_AVG='
  [ .[] | (.cost // .totalCost // .data.cost // null) ] | map(select(. != null and . > 0)) |
  if length >= 3 then (add/length) else 0 end
'

# Save the real terminal fd BEFORE the loop ever redirects fd1 through a
# command-substitution pipe — fd3 keeps pointing at the actual pane device
# no matter what fd1 becomes inside a $(...), and unlike /dev/tty it still
# works for a process with no controlling terminal at all (e.g. one
# relaunched via `nohup ... &` with stdout pointed straight at a pty device
# file) as long as that fd itself is a real tty.
exec 3>&1

# ---- shared cache + corpus-change gate -----------------------------------
# Every refresh shelled out to `opencode` 4-5 times -- session list, export,
# and up to three stats calls -- UNCONDITIONALLY, every tick, forever, with
# no cache at all. Measured over 60s of real activity: 26.54 CPU-s of a 60s
# window, 44% of a core, continuously, for a panel whose numbers cannot
# change unless a turn actually landed. Same failure this repo already fixed
# once in ccusage-panel.sh -- applied here with the same two ideas: a shared
# on-disk cache so N open panels pay for one fetch, and a change gate so an
# idle pane costs nothing.
#
# OpenCode's transcript IS a SQLite database (~/.local/share/opencode/
# opencode.db, in WAL mode) rather than JSONL files, but the same principle
# holds: every report here is a pure function of that database's content, so
# if nothing has written to it since a cached answer was computed, re-running
# the query cannot produce a different answer. `-newer` against all three
# files (db + -wal + -shm) rather than just the main db, because WAL mode
# can leave the shm/wal files as the only ones that moved between
# checkpoints -- checking the main file alone would miss writes.
OC_CACHE_DIR="$HOME/.cache/opencode-panel-cache"
OC_DB_DIR="$HOME/.local/share/opencode"
mkdir -p "$OC_CACHE_DIR"

oc_corpus_changed_since() {
  [ -n "$(find "$OC_DB_DIR" -maxdepth 1 -name 'opencode.db*' -newer "$1" -print -quit 2>/dev/null)" ]
}

# The TTL's only job is to stop concurrent panels stampeding one query at
# once -- the corpus gate above is the real arbiter of "has this actually
# gone stale". Kept short and NOT a whole multiple of REFRESH (the ccusage
# panel's fix for the same coin-flip: an entry aged exactly its TTL makes
# `age /dev/null || stat -c %Y "$cache_file" 2>/dev/null || echo 0)
    if (( now_epoch - cache_mtime /dev/null; then
    have_lock=0
    lock_age=$(( now_epoch - $(stat -f %m "$lock_dir" 2>/dev/null || stat -c %Y "$lock_dir" 2>/dev/null || echo "$now_epoch") ))
    if (( lock_age > 15 )); then
      rmdir "$lock_dir" 2>/dev/null
      mkdir "$lock_dir" 2>/dev/null && have_lock=1
    fi
  fi
  if [ "$have_lock" = 0 ]; then
    if [ -f "$cache_file" ]; then cat "$cache_file"; return; fi
    waited=0
    while [ -d "$lock_dir" ] && [ ! -f "$cache_file" ] && (( waited /dev/null)
  printf '%s' "$out" > "$cache_file.$$.tmp" && mv "$cache_file.$$.tmp" "$cache_file"
  [ "$have_lock" = 1 ] && rmdir "$lock_dir" 2>/dev/null
  printf '%s' "$out"
}

# `opencode export` is keyed on the session's OWN "updated" timestamp rather
# than a TTL or the whole-database gate above -- a tighter, cheaper, and more
# correct signal than either: this session's export cannot have changed
# unless THIS session's updated time moved, regardless of what any other
# session in the database is doing. One file per session id (not per
# updated-value) with the stamp as its first line, same pattern as
# turn_table_cached() in ccusage-panel.sh, so re-running this session
# overwrites its own entry instead of leaving a new file behind every turn.
oc_export_cached() { # $1 = session_id, $2 = updated_ms (the stamp)
  local sid="$1" stamp="$2" cache_file cached out
  cache_file="$OC_CACHE_DIR/export-$(printf '%s' "$sid" | shasum -a 256 | cut -c1-16).json"
  if [ -f "$cache_file" ]; then
    IFS= read -r cached /dev/null)
  if [ -n "$out" ]; then
    { printf '%s\n' "$stamp"; printf '%s' "$out"; } > "$cache_file.$$.tmp" && mv "$cache_file.$$.tmp" "$cache_file"
  fi
  printf '%s' "$out"
}

# One entry per session id accumulates for the life of the machine, same as
# ccusage-panel.sh's turns-.out cache (a pre-existing, unaddressed gap
# there too -- flagged, not silently fixed elsewhere, since that file is out
# of scope here). Pruned on a TTL of its own, cheaply: touch is ~free, `find`
# over a cache directory holding at most a few hundred small files is not the
# 30-day corpus scan this whole effort exists to avoid.
find "$OC_CACHE_DIR" -maxdepth 1 \
  \( -name 'export-*.json' -o -name '*.tmp' \) -mtime +7 -delete 2>/dev/null

# Temp names carry the pid for the same reason ccusage-panel.sh's do. Both
# writers above use `> "$f.tmp" && mv "$f.tmp" "$f"`, which is atomic for the
# reader but was not safe for the second WRITER: oc_export_cached has no lock
# around it, so two panels on the same session both wrote `.tmp`, one
# renamed it, and the other's `mv` failed on a path that no longer existed.
# Found in the Claude panel by running two of them and reading the stderr;
# the same code was here. A panel killed between the write and the rename
# leaves its temp behind, which is why the prune above sweeps `*.tmp` too.

# Test seam, same pattern as ccusage-panel.sh: source this file with
# PANEL_LIB_ONLY=1 to get the cache functions above without entering the
# render loop or touching a real terminal.
if [ -n "${PANEL_LIB_ONLY:-}" ]; then
  return 0 2>/dev/null || exit 0
fi

while true; do
  SECONDS=0
  # Cursor-home only, NOT a full \033[2J clear — a full clear blanks the
  # whole pane for one frame before the redraw lands, which reads as a
  # visible flicker every refresh. This stays purely additive-overwrite
  # only because clear_eol() (above) truncates every line to $COLS, so a
  # frame's physical row count can never silently exceed $rows.
  printf '\033[H'
  # `tput cols`/`tput lines` run inside $(...) have their OWN stdout
  # redirected to the capture pipe, so the ioctl they'd normally use to ask
  # the terminal for its real size fails and they silently return the
  # compiled-in terminfo default (80x24) regardless of the pane's actual
  # height. `stty size` doesn't have this problem — it reads size off the
  # fd it's given, so pointing it at fd3 (see above) gets the real, live
  # pane dimensions.
  read -r rows cols < <(stty size /dev/null)
  [ -z "$cols" ] && cols=60
  [ -z "$rows" ] && rows=24
  (( cols < 40 )) && cols=40
  (( rows /dev/null 2>&1; then
    echo "opencode CLI not found on PATH."
  else
    list_json=$(opencode_cached session list --format json)
    session_id=""
    session_updated=0
    if [ -n "$list_json" ]; then
      # Scoped to sessions whose .directory matches THIS project — not the
      # newest session across every opencode session on the machine. The
      # launcher (opencode-panel-launch.sh) always opens this panel via a
      # same-cwd Ghostty split, so $PWD reliably names the project this
      # panel belongs to. Without this, a second opencode session open in
      # another directory would hijack "session:" (and everything below
      # it) the moment it became the most recently created session
      # anywhere — the same cross-session bug fixed in ccusage-panel.sh.
      project_list_json=$(jq -c --arg d "$PWD" '[ .[] | select((.directory // "") == $d) ]' <</dev/null)
      if [ -n "$project_list_json" ] && [ "$project_list_json" != "[]" ]; then
        session_id=$(jq -r "$FIND_LATEST" <</dev/null)
        # The stamp oc_export_cached() keys on -- this session's OWN updated
        # timestamp, not the whole database's. Cheap: it comes straight out
        # of the session-list payload already fetched above, so learning
        # "did THIS session move" never costs a second query.
        session_updated=$(jq -r --arg sid "$session_id" \
          '[ .[] | select((.id // .sessionID // .session_id) == $sid) | (.updated // .time.updated // 0) ][0] // 0' \
          <</dev/null)
        [ -z "$session_updated" ] && session_updated=0
      fi
    fi

    # ---- 7-day baseline, from the same list (no per-session export) ----
    since7_ms=$(( $(date -v-7d +%s 2>/dev/null || date -d '7 days ago' +%s) * 1000 ))
    avg_session_cost=0
    if [ -n "$list_json" ]; then
      recent_json=$(jq -c --argjson since "$since7_ms" \
        '[ .[] | select((.time_created // .time.created // .timeCreated // .created // 0) >= $since) ]' \
        <</dev/null)
      [ -n "$recent_json" ] && avg_session_cost=$(jq -r "$BASELINE_AVG" <</dev/null)
      [ -z "$avg_session_cost" ] && avg_session_cost=0
    fi

    # session_id can be a long opaque id; clip it to fit the pane so it
    # can't wrap and shift the row-count math for `head -n` below.
    sess_disp="${session_id:-none found}"
    sess_maxw=$(( cols - 10 )); (( sess_maxw 0)}'; then
      printf '%s  7-day avg session: $%.2f%s\n' "$C_CYAN" "$avg_session_cost" "$C_RESET"
    fi
    echo

    # `opencode stats` takes ~0.5s per call (Node/Bun startup, not the
    # query itself) — fetched once per day-range here and reused below by
    # both the headline block and the TODAY/LAST 7 DAYS sections, instead
    # of hitting the same range twice per refresh tick.
    today_stats=$(opencode_cached stats --days 1)
    week_stats=$(opencode_cached stats --days 7)
    month_stats=$(opencode_cached stats --days 30)
    stats_field() { awk -F'\\$' -v pat="$2" '$0 ~ pat {gsub(/[ │]/,"",$2); print $2}' << "$export_tmp"
      fi
    fi

    if [ -n "$export_tmp" ]; then
      IFS=$'\t' read -r model_label session_cost sess_elapsed_h last_ctx_tokens provider_id model_id \
        < <(python3 - "$export_tmp" <0? c/h:0) }')
      rc=$(threshold_color "$sess_rate" 2 5)
      printf '  📈 Session Burn Rate: %s$%s/hr%s\n' "$rc" "$sess_rate" "$C_RESET"

      today_cost=$(stats_field "$today_stats" "Total Cost")
      [ -z "$today_cost" ] && today_cost=0
      tc=$(threshold_color "$today_cost" 5 20)
      printf '  📅 Today Value: %s%s%s\n' "$tc" "$(fmt_money "$today_cost")" "$C_RESET"

      # Projects the CURRENT session's burn rate across a flat 10h work
      # day — same convention as the Claude Code panel's predicted-spend
      # line, standing in for a per-block rate since there's no block here.
      today_pred=$(awk -v r="$sess_rate" 'BEGIN{ printf "%.2f", r*10 }')
      pc=$(threshold_color "$today_pred" 5 20)
      printf '  🔮 Today'"'"'s Predicted Value: %s%s%s\n' "$pc" "$(fmt_money "$today_pred")" "$C_RESET"

      if [ "${last_ctx_tokens:-0}" -gt 0 ] 2>/dev/null; then
        ctx_limit=$(model_context_limit "${provider_id:-}" "${model_id:-}")
        if [ "${ctx_limit:-0}" -gt 0 ] 2>/dev/null; then
          ctx_pct=$(awk -v t="$last_ctx_tokens" -v w="$ctx_limit" 'BEGIN{ printf "%.0f", (w>0? t*100/w:0) }')
          cc=$(threshold_color "$ctx_pct" 50 80)
          printf '  🧠 Context Usage: %s / %s tokens (%s%s%%%s)\n' \
            "$(fmt_m "$last_ctx_tokens")" "$(fmt_m "$ctx_limit")" "$cc" "$ctx_pct" "$C_RESET"
        fi
      fi

      folder_full=$(jq -r --arg sid "$session_id" \
        '.[] | select((.id // .sessionID // .session_id) == $sid) | (.directory // "")' \
        <</dev/null)
      [ -n "$folder_full" ] && printf '  📁 Folder: %s\n' "$(basename "$folder_full")"

      week_avg_cost=$(stats_field "$week_stats" "Avg Cost.Day")
      if [ -n "$week_avg_cost" ]; then
        wc=$(threshold_color "$week_avg_cost" 5 20)
        printf '  📊 7-Day Avg Daily Value: %s%s%s\n' "$wc" "$(fmt_money "$week_avg_cost")" "$C_RESET"
      fi

      month_cost=$(stats_field "$month_stats" "Total Cost")
      if [ -n "$month_cost" ]; then
        mc=$(threshold_color "$month_cost" 50 200)
        printf '  💵 30-Day Value: %s%s%s\n' "$mc" "$(fmt_money "$month_cost")" "$C_RESET"
      fi
      echo
    fi

    header "THIS SESSION — PER TURN"
    if [ -n "$export_tmp" ]; then
      python3 - "$export_tmp" "$TURN_ROWS" <= 1000:
        return f"{n/1000:.0f}k"
    return str(n)

turns = []
try:
    with open(path) as f:
        doc = json.load(f)
except (OSError, json.JSONDecodeError):
    doc = {}

# `opencode export` prints one pretty-printed JSON object — {"info": ...,
# "messages": [{"info": {...}, "parts": [...]}]} — not JSON-lines, and each
# message's fields (role/tokens/cost/modelID/providerID) live directly on
# its own "info", not nested under a "data" key. The original version of
# this parser assumed a JSONL shape that never matched a real export, so
# every session showed "no assistant turns yet" regardless of activity.
for m in doc.get("messages", []):
    info = m.get("info", {}) or {}
    if info.get("role") != "assistant":
        continue

    tokens = info.get("tokens", {}) or {}
    in_tok = tokens.get("input", 0)
    cache = tokens.get("cache", {}) or {}
    cache_read = cache.get("read", 0)
    cache_write = cache.get("write", 0)
    cost = info.get("cost", 0) or 0

    total_ctx = in_tok + cache_read + cache_write
    cache_pct = (cache_read / total_ctx * 100) if total_ctx else 0.0

    provider = info.get("providerID", "?")
    model = info.get("modelID", "unknown")
    label = f"{provider}/{model}"[:16]

    # Δ is new cache writes this turn, matching the ccusage panel's
    # convention: it's exactly the tokens that weren't already cached,
    # i.e. what a context spike looks like.
    turns.append((label, total_ctx, cache_write, cache_pct, cost))

total_n = len(turns)
shown = turns[-max_rows:]
if not shown:
    print("  (no assistant turns yet)")
else:
    if total_n > len(shown):
        print(f"  (showing last {len(shown)} of {total_n} turns)")
    print(f"  {'Turn':<6}{'Model':7}{'Δ':>8}{'Cache':>7}{'Cost':>8}")
    start_idx = total_n - len(shown) + 1
    for i, (label, total_ctx, delta, cache_pct, cost) in enumerate(shown):
        turn_no = start_idx + i
        print(f"  {turn_no:<6}{label:7}"
              f"{'+' + fmt_k(delta):>8}{cache_pct:>6.0f}%{'$' + format(cost, '.2f'):>8}")
    session_cost = sum(t[4] for t in turns)
    print(f"  session total so far: ${session_cost:.2f} ({total_n} assistant turns)")
PYEOF
      rm -f "$export_tmp"
    elif [ -n "$session_id" ]; then
      echo "  (couldn't export session $session_id — 'opencode export' may need a newer CLI version)"
    else
      echo "  (no OpenCode session found — run 'opencode session list --format json' to check)"
    fi
    echo

    # ---- today / week: `opencode stats` renders fixed 60-column boxes
    # (OVERVIEW + COST & TOKENS + TOOL USAGE, ~30 lines each) that don't
    # fit a narrow side panel — a 58-col pane wraps every box line, and
    # printing both sections in full blows past the panel's row budget
    # before TOOL USAGE or the 7-day section ever render. Pull just the
    # headline fields into plain "label: value" lines instead, same
    # compact style as the rest of this panel. $today_stats/$week_stats
    # were already fetched above for the headline block — reused here
    # rather than calling `opencode stats` a second time per range.
    extract_stats() {
      sed -n '/Sessions/p;/Messages/p;/^│Days/p;/Total Cost/p;/Avg Cost.Day/p' \
        | sed -E 's/ *│ *$//; s/ {2,}/: /; s/^│/  /'
    }
    header "TODAY"
    if [ -n "$today_stats" ]; then
      echo "$today_stats" | extract_stats
    else
      echo "  (opencode stats not available)"
    fi
    echo
    header "LAST 7 DAYS"
    if [ -n "$week_stats" ]; then
      echo "$week_stats" | extract_stats
    else
      echo "  (opencode stats not available)"
    fi
  fi
  } | head -n "$((rows - 1))" | clear_eol
  printf '\033[0J'

  # Each refresh shells out to `opencode` 4-5 times (session list, export,
  # up to three stats calls) at ~0.5s of Node/Bun startup apiece — that's
  # ~2.5s of unavoidable overhead before REFRESH's own sleep even starts,
  # so a plain `sleep "$REFRESH"` after that silently turns a "5s refresh"
  # into an ~8-9s one. Subtract the work already spent this tick so the
  # labeled cadence is honest; floor at 1s in case a tick ever runs long.
  elapsed=$SECONDS
  remaining=$(( REFRESH - elapsed ))
  (( remaining  "$BIN_DIR/opencode-panel-launch.sh" <> "$LOG"; }

panel_pids() { pgrep -f '[b]in/opencode-panel\.sh' 2>/dev/null | sort; }

log "start: TERM_PROGRAM=${TERM_PROGRAM:-unset} TMUX=${TMUX:-unset} PWD=$PWD"

# Inside tmux, TERM_PROGRAM gets overridden (often to "tmux") regardless of
# the outer terminal, so the Ghostty check below never sees "ghostty" even
# when Ghostty is the real host — the launcher aborted silently for every
# tmux user. tmux has its own native split primitive that needs no
# Accessibility permission and no keystroke simulation, so prefer it
# whenever we're inside a tmux client at all, before falling through to the
# Ghostty/osascript path. Same fix as claude-panel-launch.sh.
if [ -n "${TMUX:-}" ]; then
  if ! command -v tmux >/dev/null 2>&1; then
    log "abort: TMUX is set but tmux binary not found"
    exit 0
  fi
  if tmux split-window -h -l 33% "~/.local/bin/opencode-panel.sh" 2>>"$LOG"; then
    tmux select-pane -L >>"$LOG" 2>&1
    log "done: tmux split-window succeeded"
  else
    log "done: tmux split-window FAILED"
  fi
  exit 0
fi

if [ "${TERM_PROGRAM:-}" != "ghostty" ]; then
  log "abort: not running inside Ghostty (TERM_PROGRAM=${TERM_PROGRAM:-unset})"
  exit 0
fi
if ! command -v osascript >/dev/null 2>&1; then
  log "abort: no osascript on this system (not macOS?)"
  exit 0
fi

ghostty_procs=$(pgrep -x ghostty 2>/dev/null | wc -l | tr -d ' ')
log "context: ${ghostty_procs} ghostty process(es) running"

# A bare permission-probe first — if Accessibility access isn't granted,
# every subsequent step will fail the same way, so say so once clearly
# instead of three confusing retries.
probe=$(osascript -e 'tell application "System Events" to get name of first process' 2>&1)
probe_status=$?
if [ "$probe_status" -ne 0 ]; then
  log "abort: System Events probe failed (exit=$probe_status): $probe"
  log "abort: likely missing Accessibility permission — check System Settings > Privacy & Security > Accessibility for Ghostty"
  exit 0
fi

attempt=0
max_attempts=3
success=0

while [ "$attempt" -lt "$max_attempts" ] && [ "$success" -eq 0 ]; do
  attempt=$((attempt + 1))
  log "attempt $attempt/$max_attempts: begin"

  before_pids=$(panel_pids)

  # Brand-new windows can take a beat to become frontmost at the
  # Accessibility API level — poll instead of checking once and giving up.
  front=""
  polls=0
  for _ in $(seq 1 20); do
    polls=$((polls + 1))
    front=$(osascript -e 'tell application "System Events" to get name of first application process whose frontmost is true' 2>/dev/null)
    [ "$front" = "ghostty" ] && break
    sleep 0.1
  done
  if [ "$front" != "ghostty" ]; then
    log "attempt $attempt: frontmost never became ghostty after $polls polls (last saw '$front') — retrying"
    sleep 0.5
    continue
  fi
  log "attempt $attempt: frontmost confirmed ghostty after $polls poll(s)"

  # Settle delay: frontmost can flip true right as a cold `open -na` launch
  # is still mid-activation-animation, before the window can reliably
  # receive keystrokes.
  sleep 0.3

  # Everything below — the frontmost re-check, the window-width read, the
  # resize math, and every keystroke — happens inside ONE osascript call,
  # for the same reason as the Claude Code version: splitting it across
  # two calls lets frontmost change out from under the second one, and
  # both halves separately exit 0.
  result=$(osascript <&1
tell application "System Events"
  set frontApp to first application process whose frontmost is true
  if name of frontApp is not "ghostty" then return "skip: frontmost is " & (name of frontApp)
  tell frontApp
    set winSize to size of front window
    set winWidth to item 1 of winSize
    set numPresses to round ((winWidth / 6) / 40)
    delay 0.3
    keystroke "d" using command down
    delay 0.6
    keystroke "~/.local/bin/opencode-panel.sh"
    key code 36
    delay 0.3
    keystroke "h" using control down
    delay 0.2
    repeat numPresses times
      keystroke "l" using {control down, shift down}
      delay 0.05
    end repeat
  end tell
  return "ok: width=" & winWidth & " presses=" & numPresses
end tell
APPLESCRIPT
  )
  osa_status=$?
  log "attempt $attempt: osascript exit=$osa_status result=$result"

  # Ground truth: did an actual new panel process appear? Don't trust the
  # AppleScript's own report of success — verify it.
  sleep 1
  after_pids=$(panel_pids)
  new_pids=$(comm -13 <(echo "$before_pids") /dev/null)
  if [ -n "$new_pids" ]; then
    log "attempt $attempt: VERIFIED — new panel process(es): $(echo "$new_pids" | tr '\n' ' ')"
    success=1
  else
    log "attempt $attempt: FAILED — no new panel process appeared (before=[$(echo "$before_pids" | tr '\n' ' ')] after=[$(echo "$after_pids" | tr '\n' ' ')])"
    sleep 0.5
  fi
done

if [ "$success" -eq 1 ]; then
  log "done: succeeded on attempt $attempt/$max_attempts"
else
  log "done: GAVE UP after $max_attempts attempts — panel did not launch"
  log "done: troubleshooting — confirm ctrl+shift+h/l keybinds exist in ~/.config/ghostty/config, confirm ~/.local/bin/opencode-panel.sh is executable, try running it manually"
fi

exit 0
LAUNCH_EOF
chmod +x "$BIN_DIR/opencode-panel-launch.sh"

ZSHRC="$HOME/.zshrc"
MARKER="# --- opencode split-panel autolaunch"
if [ -f "$ZSHRC" ] && grep -qF "$MARKER" "$ZSHRC"; then
  echo "~/.zshrc already has the OpenCode autolaunch hook — leaving it as-is."
else
  echo "Adding the OpenCode autolaunch hook to ~/.zshrc ..."
  cat >> "$ZSHRC" <> "$GHOSTTY_CONF"
    added_keybind=1
  fi
  if ! grep -qF "keybind = ctrl+shift+l=resize_split:right,40" "$GHOSTTY_CONF"; then
    printf '%s\n' "keybind = ctrl+shift+l=resize_split:right,40" >> "$GHOSTTY_CONF"
    added_keybind=1
  fi
  if [ "$added_keybind" -eq 1 ]; then
    echo "Added resize_split keybinds to ~/.config/ghostty/config."
  else
    echo "~/.config/ghostty/config already has the resize_split keybinds — leaving as-is."
  fi
else
  echo "No ~/.config/ghostty/config found — skipping resize keybinds (the split will stay 50/50)."
fi

echo
echo "Done. Open a NEW terminal window/tab (or 'source ~/.zshrc') and type"
echo "any 'opencode...' command — it'll auto-split right and start the panel."
echo "Run the panel manually any time with: ~/.local/bin/opencode-panel.sh"
EOFOne thing worth doing before you trust the aggregate section: run opencode stats --json | head yourself once. If it comes back as clean JSON, that section is worth upgrading to match the tighter formatting the Claude Code panel gets from ccusage.
6. What To Measure Every Week
Four numbers, weekly:
- Cost per accepted unit of work. Everything included, retries and escalations and overhead, divided by units that passed acceptance. The only number that tells you whether any of this is working.
- Cache hit rate, watched like an error rate.
- First pass acceptance rate per role. Above roughly 85 percent, you are probably being too conservative and should push more work down a tier. Below roughly 60 percent, inspect the briefs before assuming the answer is a stronger model, since a vague brief and a weak model produce the same symptom.
- Top ten sessions by cost, read weekly, not summarised. In every session I have actually gone and read, the cause turned out to be visible in the transcript within a couple of minutes; that is not a guarantee, just what has held so far.
7. Local Telemetry, Provider Billing, And Organisation Wide Analytics
Local telemetry, the per turn view in sections 4 and 5, tells you why a cost happened: which turn, which file, which subagent. It does not tell you what was actually billed. Those are different questions with different authoritative sources, and conflating them is how a plausible looking estimate quietly drifts from the real invoice.
If your Claude traffic is billed directly by Anthropic, the Usage and Cost Admin API is the authoritative source for money, and it draws exactly the line above: spend is a fact it reports precisely, waste is a judgement it cannot make, because whether a call was necessary depends on your workflow, not on anything visible from the provider’s side.
One number falls out of it almost for free. The Usage API separates uncached from cached input tokens per model per day, and crossed against your rate card that gives you a cache waste ceiling in dollars, the organisation wide version of the cache hit rate diagnostic from section 3. In one real case, four hundred million uncached tokens that a well behaved cache should have caught, on Sonnet 5’s confirmed two dollars per million input rate, came to roughly eight hundred dollars in a single week, from one prompt assembly bug. Scale that to a heavier model or a larger fleet and the same mechanism produces a much bigger number; the point is the mechanism, so use your own rate card rather than this one.
Everything past that needs a log of your own, for the same reason a billing report cannot see it: retries, escalations from a cheap tier to an expensive one, truncated responses needing a follow up call, and sessions abandoned before completion all look, in the aggregate, exactly like ordinary successful traffic. None of that is visible on any provider’s bill. It is only visible in whatever your own orchestration code already knows and never wrote down. Once you log which calls were retries, which were escalations, and which sessions ended accepted or not, a true waste rate is direct: sum the cost of everything that was not necessary, divide by the total cost for the same period taken from the Cost API rather than your own log’s sum, which is the same idea as cost per accepted unit of work from section 6, now expressed as a single tracked percentage.
That gives you two levels: local telemetry for causality, provider billing for financial truth. There is a third worth knowing about if you are answering to anyone above individual developer level. Anthropic’s Claude Code Analytics API returns one record per user per day, sessions, lines of code added and removed, commits and pull requests created, tool accept and reject counts, and token usage and estimated cost broken down by model, through an Admin API key with data landing within about an hour. It is aggregated rather than the per turn forensic detail this piece has been arguing for, which is the point rather than a limitation: it answers a different question, which developer’s usage looks unusual, rather than which decision inside a session caused it. The three levels together are a reasonable shape for an organisation rather than an individual: local per turn instrumentation for the developer actually debugging a session, the Analytics API or an OpenTelemetry export for engineering leadership watching trends across a team, and the Usage and Cost API for finance reconciling against the actual bill. None of the three substitutes for either of the others.
8. Why This Comes Before Any Fix
Every lever in the companion piece, ending sessions deliberately, keeping a stable cache prefix, delegating reads to an isolated subagent, all of it rests on being able to see, in your own account, which turn or which session actually did the damage. Without that, cost optimisation is a set of plausible sounding heuristics applied uniformly, and some of them will be wrong for your specific workload.
The case study in sections 1 and 2 is the proof this is not academic. A 98.5 percent cache hit rate looked completely healthy by the most common single metric anyone checks, and it was masking a session that resent nearly a million tokens of context on almost six thousand turns. No amount of reasoning about caching in the abstract would have caught that. Reading the actual per turn numbers did, in about the time it took to read a table.
Install the panel that matches your tool, run the five diagnostics, and read your own top ten sessions before you touch a single lever. The instrumentation is not preparation for the real work. Reading your own numbers accurately is the real work, and everything else follows from what they tell you.
9. Sources
Versions and behaviour move over time. Verify before relying on any of this in production.
- opencode-tokenscope, per turn and cache breakdown plugin for OpenCode: https://github.com/ramtinJ95/opencode-tokenscope
- opencode-token-monitor, real time dashboard, budgets and trend charts: https://github.com/Ainsley0917/opencode-token-monitor
- OpenCode Throughput, live TUI sidebar for latency, throughput and cost: https://github.com/Howardzhangdqs/opencode-throughput
- opencode-plugin-otel, OpenTelemetry export mirroring Claude Code’s own monitoring signals: https://github.com/DEVtheOPS/opencode-plugin-otel
- OpenCode CLI reference, including
session list,exportandstats: https://opencode.ai/docs/cli/ - ccusage, the CLI this piece’s Claude Code panel is built on top of: https://github.com/ryoppippi/ccusage
- Anthropic Usage and Cost Admin API, endpoints, grouping, filtering and time granularity: https://platform.claude.com/docs/en/manage-claude/usage-cost-api
- Anthropic Claude Code Analytics API, per user daily productivity and cost metrics: https://platform.claude.com/docs/en/manage-claude/claude-code-analytics-api
- Anthropic’s official pricing page, current rates for all models: https://platform.claude.com/docs/en/about-claude/pricing
- Anthropic’s announcement making Sonnet 5’s introductory pricing permanent, 10 August 2026: https://x.com/claudeai/status/2086891169217122586