Cut AI Coding Agent Costs: Fix Context Before You Change Models

Your coding agent bill is driven by context resend costs, not model price. Focus on ending sessions after one task to avoid the N squared cost scaling, instrument usage before making changes, and disable automatic compaction which destroys cache savings. These steps can reduce costs by over half without changing models.
My inference bill last month was large enough to require an explanation, and the cause looked obvious: I had run one expensive model for everything. So the fix looked obvious too. Route the cheap work to a cheap model, keep the frontier model for the hard parts, save two thirds.
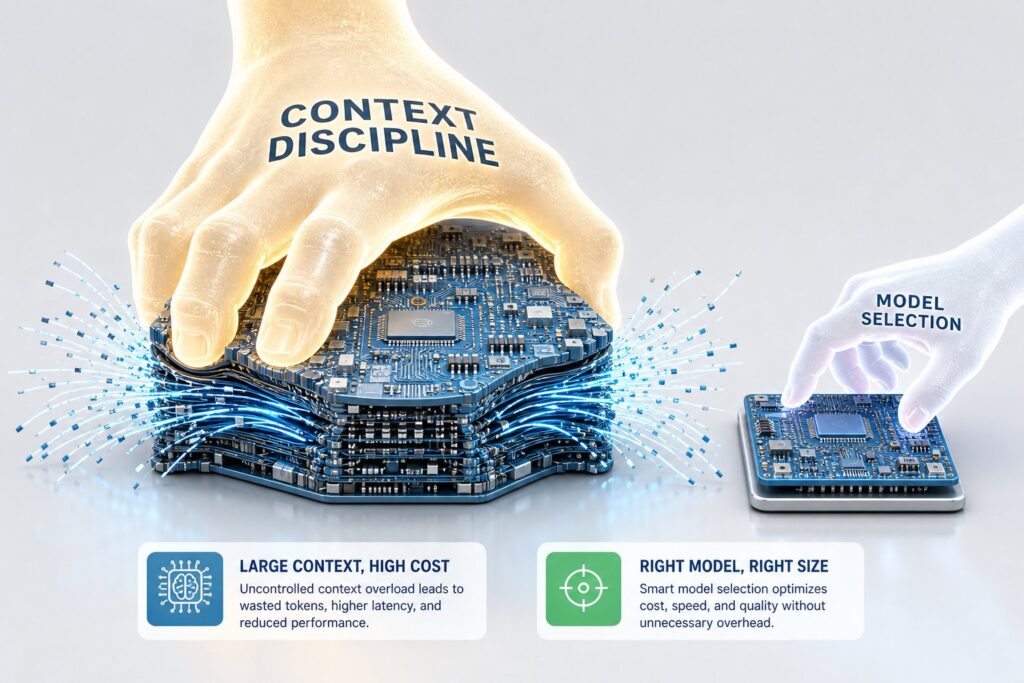
That instinct is wrong, or more precisely it is third in line. Model selection turns out to be a smaller lever than two things nobody talks about, both of which are free and work with whatever model you are already using.
1. Get The Telemetry Before You Read Any Further
Everything below is easier to trust, and easier to apply, once you can see it happening in your own sessions rather than taking the argument’s word for it. OpenCode’s built in view is a running session total, which tells you a session was expensive and nothing about which turn made it that way. Fixing that takes one install, not a custom build.
Start with opencode-tokenscope. It is a plugin, not a separate dashboard: add it, restart OpenCode, then run /tokenscope. It turns OpenCode’s own recorded telemetry into a report covering fresh input against cache reads and writes per step, a retained content inventory broken down by system prompt, user turns, assistant turns and replayable tool output, cache hit rate and estimated savings at public rates, and recursive subagent totals so a delegated call’s cost rolls up into the session that spawned it. That last part matters specifically for the isolation lever in section 8: it is the only way to see whether a subagent is actually cheaper once its own cost is counted.
# in your opencode.json plugin array
"plugin": ["ramtinj95/opencode-tokenscope@latest"]
If you want a running dashboard rather than a report you ask for, opencode-token-monitor tracks input, output, reasoning and cache tokens in real time, breaks cost down by agent and by agent crossed with model, keeps a persistent history so you get week over week trend charts, and fires a toast notification when a session crosses a budget threshold you set. Same install pattern, one line in the plugin array.
If the complaint is specifically that the interface itself shows too little, opencode-throughput puts token rate, latency and running cost directly into a sidebar inside the OpenCode TUI rather than a report you have to go and generate. That is the direct fix for wanting more than a summary number on screen while you work.
For a team rather than a single laptop, opencode-plugin-otel exports the same session, token, cost and tool duration signals over OpenTelemetry to whatever you already run, Datadog, Honeycomb, Grafana Cloud, and deliberately mirrors the signal names Claude Code’s own monitoring uses, so a dashboard built for one reads the other. Worth the extra setup once more than one developer needs to see the same numbers; overkill before that.
If you are driving this through Claude Code rather than OpenCode, the equivalent is ccusage, which reads Claude Code’s local session logs directly rather than anything you have to enable. The version below is an installer rather than a single script: it writes two files under ~/.local/bin, a live panel and a launcher, adds a small hook to ~/.zshrc so the panel appears on its own the first time you type a claude command in a new terminal window, and, if you already launch Claude Code through a Finder Service or Automator workflow rather than a shell, patches that script too, since a workflow like that execs claude directly with no interactive shell involved, and the .zshrc hook never fires for it. On macOS with Ghostty the split opens automatically either way; anywhere else, or in any other terminal, the panel itself still runs fine, you just start it by hand with the path it prints at the end.
The launcher also stopped failing silently, which is worth calling out on its own merits. Earlier versions either opened the split or did nothing, with no way to tell which from the terminal. This one logs the reason to ~/.cache/claude-panel-launch.log every time, and it polls for up to two seconds for Ghostty to register as the frontmost window before giving up, because a brand new window does not always report itself as frontmost the instant it opens, and checking once and quitting was quietly losing the race on exactly the windows this is meant to help with. Same principle as the alarm thresholds in section 15: a failure you can see is a different thing from a failure that just does not happen.
What it actually shows, beyond the totals from before: a live per turn breakdown of the session you are currently in, turn number, model, input size, the context delta, cache percentage and estimated cost per turn, which is the exact table format from section 4 made real rather than illustrative. It also keeps a seven day rolling average session cost as a baseline, and colours a row yellow past one and a half times that average and red past two times it, so the session from section 5 would have shown red well before turn one hundred rather than only becoming visible at the very end. It is safe to re-run: it overwrites the two scripts with whatever version you paste in and skips the .zshrc block if it is already there.
One number inside it is date sensitive and worth checking before you trust the totals: the per turn cost estimate prices Sonnet 5 at introductory pricing through the end of August 2026, since ccusage itself does not expose per message cost and this reads the raw transcript and prices it independently. If you are reading this after that date, open the script and update the rate table before trusting the per turn column, exactly the caution this whole article keeps repeating about any number that came from a rate card rather than an invoice.
cat << 'EOF' > claude-panel-setup.sh
#!/usr/bin/env bash
# Installs the Claude Code live usage panel + auto-split launcher.
#
# What this sets up:
#   ~/.local/bin/ccusage-panel.sh        - live stats panel (context %,
#                                           per-turn cost, active block burn
#                                           rate, today/3-day/week/month,
#                                           top sessions)
#   ~/.local/bin/claude-panel-launch.sh  - opens a right-hand Ghostty split
#                                           running the panel above
#   ~/.zshrc (appended, idempotent)      - a preexec hook that runs the
#                                           launcher once per terminal
#                                           window, the first time a
#                                           `claude*` command is typed
#   ~/.local/bin/ghostty-claude-launcher  - patched in place (idempotent)
#                                           if present, so a Finder Service
#                                           / Automator launch path (which
#                                           execs `claude` directly, with
#                                           no interactive shell involved)
#                                           also gets the split panel
#
# Requirements: macOS + Ghostty (for the auto-split part — the panel script
# itself works in any terminal), Node.js (for `ccusage`), jq, and
# Accessibility permission granted to Ghostty/Terminal for the System
# Events automation (macOS will prompt the first time if not yet granted).
#
# Safe to re-run: overwrites the two scripts with the latest version and
# skips the .zshrc block if it's already present.
set -uo pipefail

BIN_DIR="$HOME/.local/bin"
mkdir -p "$BIN_DIR"

echo "Installing ccusage-panel.sh ..."
cat > "$BIN_DIR/ccusage-panel.sh" <<'PANEL_EOF'
#!/usr/bin/env bash
# Live Claude Code usage panel — everything ccusage knows: context %, live
# block burn rate + projection, today's breakdown, 3-day trend, week/month
# totals, top sessions today, PLUS a per-turn breakdown of the current
# session (turn/model/context size/context growth/cache hit %/est. cost).
# Run this in a Ghostty split (super+d) to keep it visible while you work.
# Auto-launched by the ccusage split-panel autolaunch hook in ~/.zshrc — see
# ~/.local/bin/claude-panel-launch.sh.
set -uo pipefail
export LC_ALL=C LC_NUMERIC=C

REFRESH="${1:-5}"
TURN_ROWS="${2:-8}"

C_RESET=$'\033[0m'; C_DIM=$'\033[2m'; C_BOLD=$'\033[1m'
C_CYAN=$'\033[36m'; C_YELLOW=$'\033[33m'; C_GREEN=$'\033[32m'; C_RED=$'\033[31m'

fmt_num() {
  awk -v n="$1" 'BEGIN{
    n=n+0; neg=(n<0); if(neg) n=-n;
    n=int(n+0.5); s=sprintf("%d",n); out=""; l=length(s);
    for(i=1;i<=l;i++){ out=out substr(s,i,1); if((l-i)%3==0 && i!=l) out=out "," }
    print (neg?"-":"") out;
  }'
}
fmt_money() { printf '$%.2f' "${1:-0}"; }
fmt_hm() { local m=${1:-0}; m=${m%.*}; printf '%dh %02dm' $((m/60)) $((m%60)); }
hr() { local w="$1" ch="${2:--}"; printf '%*s\n' "$w" '' | tr ' ' "$ch"; }
header() { local w="$1" title="$2"; printf '%s%s%s\n' "$C_BOLD$C_CYAN" "$title" "$C_RESET"; hr "$w"; }

while true; do
  printf '\033[H'
  cols=$(tput cols 2>/dev/null || echo 60)
  (( cols < 40 )) && cols=40
  rows=$(tput lines 2>/dev/null || echo 24)
  (( rows < 10 )) && rows=10

  {
  printf '%s%s Claude Code usage — %s %s(refresh %ss)%s\n' \
    "$C_BOLD" "──" "$(date '+%a %H:%M:%S')" "$C_DIM" "$REFRESH" "$C_RESET"
  hr "$cols" "="

  # ---- baseline: average session cost over the last 7 days ----
  # Used to flag this session (below) and individual turns (further down)
  # as unusually expensive. Needs >=3 real sessions to trust the average —
  # otherwise a single earlier tiny/huge session would skew it.
  since7=$(date -v-7d +%Y%m%d 2>/dev/null || date -d '7 days ago' +%Y%m%d)
  baseline_json=$(ccusage session --json --since "$since7" --offline 2>/dev/null)
  avg_session_cost=$(jq -r '
    [.session[].totalCost] | map(select(. > 0.05)) |
    if length >= 3 then (add/length) else 0 end
  ' <<<"$baseline_json" 2>/dev/null)
  [ -z "$avg_session_cost" ] && avg_session_cost=0

  # ---- live status line (current session) ----
  # Needs the REAL session_id and model.id — a placeholder session_id
  # ("live") matches no recorded session (session cost silently comes back
  # $-0.00), and an unset model.id makes ccusage assume an old 200k context
  # window instead of Sonnet 5's actual 1M, so context% reads >100%.
  latest=$(ls -t ~/.claude/projects/*/*.jsonl 2>/dev/null | head -1)
  if [ -n "$latest" ]; then
    IFS=$'\t' read -r sess_id model_id model_label < <(python3 - "$latest" <<'PYEOF'
import json, os, sys

path = sys.argv[1]
sid = os.path.basename(path).removesuffix(".jsonl")
model = "unknown"
try:
    with open(path) as f:
        for line in f:
            try:
                d = json.loads(line)
            except json.JSONDecodeError:
                continue
            if d.get("type") == "assistant":
                m = d.get("message", {}).get("model")
                if m:
                    model = m
except OSError:
    pass

rest = model.removeprefix("claude-")
parts = rest.split("-")
name = parts[0].capitalize()
nums = parts[1:]
if len(nums) >= 2:
    label = f"{name} {nums[0]}.{nums[1]}"
elif len(nums) == 1:
    label = f"{name} {nums[0]}"
else:
    label = name
print(f"{sid}\t{model}\t{label}")
PYEOF
    )
    payload=$(printf '{"session_id":"%s","transcript_path":"%s","cwd":"%s","model":{"id":"%s","display_name":"%s"},"workspace":{"current_dir":"%s","project_dir":"%s"},"version":"1.0","output_style":{"name":"default"}}' \
      "$sess_id" "$latest" "$PWD" "$model_id" "$model_label" "$PWD" "$PWD")
    statusline_out=$(echo "$payload" | ccusage statusline -B text 2>/dev/null)
    # Flag this session as unusually expensive vs the 7-day average.
    if [[ "$statusline_out" =~ (\$-?[0-9]+\.[0-9]+\ session) ]]; then
      sess_token="${BASH_REMATCH[1]}"
      sess_amt="${sess_token#\$}"; sess_amt="${sess_amt% session}"
      sess_color=""
      awk -v v="$sess_amt" -v a="$avg_session_cost" 'BEGIN{exit !(a>0 && v>a*1.5)}' && sess_color="$C_YELLOW"
      awk -v v="$sess_amt" -v a="$avg_session_cost" 'BEGIN{exit !(a>0 && v>a*2.0)}' && sess_color="$C_RED"
      if [ -n "$sess_color" ]; then
        statusline_out="${statusline_out/$sess_token/${sess_color}${sess_token}${C_RESET}}"
      fi
    fi
    echo "$statusline_out" | fold -s -w "$cols"
    printf '%s  session: %s%s\n' "$C_DIM" "$(basename "$(dirname "$latest")")" "$C_RESET"
    if awk -v a="$avg_session_cost" 'BEGIN{exit !(a>0)}'; then
      printf '%s  7-day avg session: %s%s\n' "$C_DIM" "$(fmt_money "$avg_session_cost")" "$C_RESET"
    fi
  else
    echo "no active Claude Code session found"
  fi
  echo

  # ---- per-turn breakdown of the current session ----
  # ccusage doesn't expose per-message cost (session/daily/blocks only give
  # per-session/day/block totals), so this reads the transcript directly and
  # prices each turn itself. Rates below are Anthropic's published per-model
  # $/1M input & output; cache read/write are the standard multiples of the
  # input rate (0.1x read, 1.25x 5m write, 2x 1h write). Sonnet 5 is on intro
  # pricing ($2/$10) through 2026-08-31 — flip to $3/$15 after that date.
  header "$cols" "THIS SESSION — PER TURN"
  if [ -n "$latest" ]; then
    python3 - "$latest" "$TURN_ROWS" <<'PYEOF'
import json, sys

path, max_rows = sys.argv[1], int(sys.argv[2])

PRICES = {  # model id -> (input $/1M, output $/1M)
    "claude-sonnet-5":   (2.00, 10.00),
    "claude-opus-5":     (5.00, 25.00),
    "claude-haiku-4-5":  (1.00, 5.00),
    "claude-sonnet-4-6": (3.00, 15.00),
    "claude-opus-4-8":   (5.00, 25.00),
    "claude-opus-4-7":   (5.00, 25.00),
    "claude-opus-4-6":   (5.00, 25.00),
    "claude-fable-5":    (10.00, 50.00),
    "claude-mythos-5":   (10.00, 50.00),
}
DEFAULT_PRICE = (3.00, 15.00)
CACHE_READ_MULT, CACHE_WRITE_5M_MULT, CACHE_WRITE_1H_MULT = 0.1, 1.25, 2.0

def model_label(model_id):
    rest = model_id.removeprefix("claude-")
    parts = rest.split("-")
    name = parts[0].capitalize()
    nums = parts[1:]
    if len(nums) >= 2:
        return f"{name} {nums[0]}.{nums[1]}"
    if len(nums) == 1:
        return f"{name} {nums[0]}"
    return name

def fmt_k(n):
    if abs(n) >= 1000:
        return f"{n/1000:.0f}k"
    return str(n)

turns, seen = [], set()
try:
    with open(path) as f:
        lines = f.readlines()
except OSError:
    lines = []

for line in lines:
    try:
        d = json.loads(line)
    except json.JSONDecodeError:
        continue
    if d.get("type") != "assistant":
        continue
    msg = d.get("message", {})
    usage = msg.get("usage")
    mid = msg.get("id")
    if not usage or not mid or mid in seen:
        continue
    seen.add(mid)

    model = msg.get("model", "unknown")
    in_tok = usage.get("input_tokens", 0)
    out_tok = usage.get("output_tokens", 0)
    cr_tok = usage.get("cache_read_input_tokens", 0)
    cc_tok = usage.get("cache_creation_input_tokens", 0)
    cc = usage.get("cache_creation") or {}
    cw_1h = cc.get("ephemeral_1h_input_tokens", cc_tok if not cc else 0)
    cw_5m = cc.get("ephemeral_5m_input_tokens", 0)

    total_ctx = in_tok + cr_tok + cc_tok
    cache_pct = (cr_tok / total_ctx * 100) if total_ctx else 0.0

    price_in, price_out = PRICES.get(model, DEFAULT_PRICE)
    cost = (
        in_tok * price_in
        + out_tok * price_out
        + cr_tok * price_in * CACHE_READ_MULT
        + cw_1h * price_in * CACHE_WRITE_1H_MULT
        + cw_5m * price_in * CACHE_WRITE_5M_MULT
    ) / 1_000_000

    turns.append((model_label(model), total_ctx, cc_tok, cache_pct, cost))

RED, YELLOW, RESET = "\033[31m", "\033[33m", "\033[0m"

total_n = len(turns)
shown = turns[-max_rows:]
if not shown:
    print("  (no assistant turns yet)")
else:
    avg_cost = sum(t[4] for t in turns) / total_n if total_n else 0
    if total_n > len(shown):
        print(f"  (showing last {len(shown)} of {total_n} turns)")
    print(f"  {'Turn':<6}{'Model':<12}{'Input':>8}{'Δ Context':>11}{'Cache':>8}{'Cost':>9}")
    start_idx = total_n - len(shown) + 1
    for i, (label, total_ctx, delta, cache_pct, cost) in enumerate(shown):
        turn_no = start_idx + i
        row = f"  {turn_no:<6}{label:<12}{fmt_k(total_ctx):>8}{'+' + fmt_k(delta):>11}{cache_pct:>7.0f}%{'$' + format(cost, '.2f'):>9}"
        if avg_cost > 0 and cost > avg_cost * 2.0:
            print(f"{RED}{row}{RESET}")
        elif avg_cost > 0 and cost > avg_cost * 1.5:
            print(f"{YELLOW}{row}{RESET}")
        else:
            print(row)
    if avg_cost > 0:
        print(f"  (avg ${avg_cost:.2f}/turn — red row = >2x avg, yellow = >1.5x)")
    session_cost = sum(t[4] for t in turns)
    print(f"  est. session total: ${session_cost:.2f} (all {total_n} turns in this file)")
PYEOF
  else
    echo "  (no active Claude Code session found)"
  fi
  echo

  # ---- active 5h block: burn rate + projection ----
  header "$cols" "ACTIVE BLOCK"
  block_json=$(ccusage blocks --active --json --offline 2>/dev/null)
  has_block=$(jq -r '.blocks | length // 0' <<<"$block_json" 2>/dev/null)
  if [ "${has_block:-0}" = "1" ]; then
    IFS=$'\t' read -r start end cost tokens cph tpm rem projCost projTokens models <<<"$(jq -r '
      .blocks[0] |
      [
        (.startTime[0:19]+"Z" | fromdateiso8601 | strftime("%H:%M")),
        (.endTime[0:19]+"Z"   | fromdateiso8601 | strftime("%H:%M")),
        .costUSD, .totalTokens, .burnRate.costPerHour, .burnRate.tokensPerMinute,
        .projection.remainingMinutes, .projection.totalCost, .projection.totalTokens,
        (.models | join(", "))
      ] | @tsv
    ' <<<"$block_json")"
    burn_color="$C_GREEN"
    awk -v c="$cph" 'BEGIN{exit !(c+0>3)}' && burn_color="$C_YELLOW"
    awk -v c="$cph" 'BEGIN{exit !(c+0>6)}' && burn_color="$C_RED"
    printf '  window   %s – %s  (%s left)\n' "$start" "$end" "$(fmt_hm "$rem")"
    printf '  spent    %s   %s tok\n' "$(fmt_money "$cost")" "$(fmt_num "$tokens")"
    printf '  burn     %s%s/hr%s   %s tok/min\n' "$burn_color" "$(fmt_money "$cph")" "$C_RESET" "$(fmt_num "$tpm")"
    printf '  proj.    %s total   %s tok\n' "$(fmt_money "$projCost")" "$(fmt_num "$projTokens")"
    printf '  models   %s\n' "$models"
  else
    echo "  (no active block)"
  fi
  echo

  # ---- today: totals + per-model breakdown ----
  header "$cols" "TODAY"
  daily_json=$(ccusage daily --json --last 1 --offline 2>/dev/null)
  if [ -n "$daily_json" ] && [ "$(jq -r '.daily | length' <<<"$daily_json" 2>/dev/null)" != "0" ]; then
    IFS=$'\t' read -r tCost tTok tIn tOut tCacheC tCacheR <<<"$(jq -r '
      .totals | [.totalCost, .totalTokens, .inputTokens, .outputTokens, .cacheCreationTokens, .cacheReadTokens] | @tsv
    ' <<<"$daily_json")"
    printf '  total    %s   %s tok\n' "$(fmt_money "$tCost")" "$(fmt_num "$tTok")"
    printf '  in/out   %s / %s   cache new/read %s / %s\n' \
      "$(fmt_num "$tIn")" "$(fmt_num "$tOut")" "$(fmt_num "$tCacheC")" "$(fmt_num "$tCacheR")"
    while IFS=$'\t' read -r mname mcost mtok; do
      [ -z "$mname" ] && continue
      printf '    %-24s %8s  %s tok\n' "$mname" "$(fmt_money "$mcost")" "$(fmt_num "$mtok")"
    done < <(jq -r '.daily[0].modelBreakdowns[]? | [.modelName, .cost, (.inputTokens+.outputTokens+.cacheCreationTokens+.cacheReadTokens)] | @tsv' <<<"$daily_json")
  else
    echo "  (no usage yet today)"
  fi
  echo

  # ---- 3-day trend ----
  header "$cols" "LAST 3 DAYS"
  since3=$(date -v-2d +%Y%m%d 2>/dev/null || date -d '2 days ago' +%Y%m%d)
  trend_json=$(ccusage daily --json --since "$since3" --offline 2>/dev/null)
  if [ -n "$trend_json" ]; then
    barw=$((cols - 22)); (( barw < 10 )) && barw=10
    maxcost=$(jq -r '[.daily[].totalCost] | max // 1' <<<"$trend_json")
    awk -v m="$maxcost" 'BEGIN{if(m<=0) print 1; else print m}' >/dev/null
    while IFS=$'\t' read -r day dcost dtok; do
      [ -z "$day" ] && continue
      n=$(awk -v c="$dcost" -v m="$maxcost" -v w="$barw" 'BEGIN{ if(m<=0) m=1; n=int((c/m)*w+0.5); if(n<0)n=0; print n }')
      bar=$(printf '%*s' "$n" '' | tr ' ' '#')
      printf '  %-5s %-*s %s\n' "${day:5}" "$barw" "$bar" "$(fmt_money "$dcost")"
    done < <(jq -r '.daily[] | [.period, .totalCost, .totalTokens] | @tsv' <<<"$trend_json")
  fi
  echo

  # ---- week / month totals ----
  header "$cols" "WEEK / MONTH"
  week_cost=$(ccusage weekly --json --last 1 --offline 2>/dev/null | jq -r '.totals.totalCost // 0')
  month_cost=$(ccusage monthly --json --last 1 --offline 2>/dev/null | jq -r '.totals.totalCost // 0')
  printf '  this week   %s\n' "$(fmt_money "$week_cost")"
  printf '  this month  %s\n' "$(fmt_money "$month_cost")"
  echo

  # ---- top sessions today ----
  header "$cols" "TOP SESSIONS TODAY"
  session_json=$(ccusage session --json --since "$(date +%Y%m%d)" --offline 2>/dev/null)
  if [ -n "$session_json" ] && [ "$(jq -r '.session | length' <<<"$session_json" 2>/dev/null)" != "0" ]; then
    while IFS=$'\t' read -r sid scost stok slast; do
      [ -z "$sid" ] && continue
      lasthm=$(jq -rn --arg t "$slast" '($t[0:19]+"Z") | fromdateiso8601 | strftime("%H:%M")' 2>/dev/null)
      printf '  %-10s %8s  %s tok  last %s\n' "${sid:0:10}" "$(fmt_money "$scost")" "$(fmt_num "$stok")" "$lasthm"
    done < <(jq -r '.session | sort_by(-.totalCost) | .[0:5][] | [.period, .totalCost, .totalTokens, .metadata.lastActivity] | @tsv' <<<"$session_json")
  else
    echo "  (none)"
  fi
  } | head -n "$((rows - 1))"
  printf '\033[0J'

  sleep "$REFRESH"
done
PANEL_EOF
chmod +x "$BIN_DIR/ccusage-panel.sh"

echo "Installing claude-panel-launch.sh ..."
cat > "$BIN_DIR/claude-panel-launch.sh" <<'LAUNCH_EOF'
#!/usr/bin/env bash
# Opens a right-hand Ghostty split running the live ccusage panel, then
# returns keyboard focus to the left (original) pane. Invoked once per
# terminal window by the ccusage split-panel autolaunch hook in ~/.zshrc.
#
# Silently does nothing (but logs why, to $LOG) if:
#   - we're not running inside Ghostty (TERM_PROGRAM != ghostty)
#   - AppleScript/System Events automation isn't available (non-macOS, or
#     Terminal/Ghostty hasn't been granted Accessibility access yet — grant
#     it in System Settings > Privacy & Security > Accessibility)
#   - Ghostty never becomes the frontmost app within ~2s (brand-new windows
#     can take a moment to finish appearing — we poll for this rather than
#     assuming it's already true)
set -uo pipefail

LOG="$HOME/.cache/claude-panel-launch.log"
mkdir -p "$(dirname "$LOG")"
log() { printf '%s  %s\n' "$(date '+%Y-%m-%d %H:%M:%S')" "$1" >> "$LOG"; }

if [ "${TERM_PROGRAM:-}" != "ghostty" ]; then
  log "skip: TERM_PROGRAM=${TERM_PROGRAM:-unset} (not ghostty)"
  exit 0
fi
if ! command -v osascript >/dev/null 2>&1; then
  log "skip: no osascript on this system"
  exit 0
fi

# Brand-new windows can take a beat to become frontmost at the Accessibility
# API level — poll instead of checking once and giving up.
front=""
for _ in $(seq 1 20); do
  front=$(osascript -e 'tell application "System Events" to get name of first application process whose frontmost is true' 2>/dev/null)
  [ "$front" = "ghostty" ] && break
  sleep 0.1
done
if [ "$front" != "ghostty" ]; then
  log "abort: frontmost app never became ghostty (last saw '$front')"
  exit 0
fi

err=$(osascript <<'APPLESCRIPT' 2>&1
tell application "System Events"
  set frontApp to first application process whose frontmost is true
  if name of frontApp is not "ghostty" then return
  tell frontApp
    delay 0.3
    keystroke "d" using command down
    delay 0.6
    keystroke "~/.local/bin/ccusage-panel.sh"
    key code 36
    delay 0.3
    keystroke "h" using control down
  end tell
end tell
APPLESCRIPT
)
status=$?
if [ "$status" -ne 0 ] || [ -n "$err" ]; then
  log "osascript exit=$status err=$err"
else
  log "ok"
fi

exit 0
LAUNCH_EOF
chmod +x "$BIN_DIR/claude-panel-launch.sh"

ZSHRC="$HOME/.zshrc"
MARKER="# --- ccusage split-panel autolaunch"
if [ -f "$ZSHRC" ] && grep -qF "$MARKER" "$ZSHRC"; then
  echo "~/.zshrc already has the autolaunch hook — leaving it as-is."
else
  echo "Adding the autolaunch hook to ~/.zshrc ..."
  cat >> "$ZSHRC" <<'ZSHRC_EOF'

# --- ccusage split-panel autolaunch (installed by claude-panel-setup.sh) ---
# Fires once per terminal window, the first time a `claude*` command runs:
# opens a right-hand Ghostty split running the live usage panel, then
# returns focus to the left pane. Doesn't touch any existing `claude`
# alias/function — hooks in via preexec instead.
_ccusage_panel_autolaunch() {
  case "$1" in
    claude*) ;;
    *) return ;;
  esac
  [ -n "${CCUSAGE_PANEL_LAUNCHED:-}" ] && return
  export CCUSAGE_PANEL_LAUNCHED=1
  ~/.local/bin/claude-panel-launch.sh &
}
autoload -Uz add-zsh-hook
add-zsh-hook preexec _ccusage_panel_autolaunch
# --- end ccusage split-panel autolaunch ---
ZSHRC_EOF
fi

# If a `ghostty-claude-launcher` script exists (e.g. a Finder Service /
# Automator workflow that runs `open -na Ghostty.app --args -e
# ghostty-claude-launcher <folder>`), patch it too — that path execs
# `claude` directly with no interactive shell involved, so the preexec
# hook above never fires for it. Best-effort: inserts the launcher call
# immediately before the file's last line (its own launch line).
GCL="$BIN_DIR/ghostty-claude-launcher"
GCL_MARKER="# Auto-open the live ccusage stats panel"
if [ -f "$GCL" ] && grep -qF "$GCL_MARKER" "$GCL"; then
  echo "~/.local/bin/ghostty-claude-launcher already patched — leaving it as-is."
elif [ -f "$GCL" ]; then
  echo "Patching ~/.local/bin/ghostty-claude-launcher (Finder Service launch path) ..."
  tmp=$(mktemp)
  gcl_lines=$(wc -l < "$GCL")
  head -n "$((gcl_lines - 1))" "$GCL" > "$tmp"
  cat >> "$tmp" <<'GCL_EOF'

# Auto-open the live ccusage stats panel in a right-hand split. This
# window is always freshly created by the Finder Service (`open -na`), so
# there's no risk of double-launching — runs in the background so it
# doesn't delay Claude Code starting.
[ -x "$HOME/.local/bin/claude-panel-launch.sh" ] && "$HOME/.local/bin/claude-panel-launch.sh" &
GCL_EOF
  tail -n 1 "$GCL" >> "$tmp"
  mv "$tmp" "$GCL"
  chmod +x "$GCL"
else
  echo "No ~/.local/bin/ghostty-claude-launcher found — skipping (not using that Finder Service workflow)."
fi

echo
echo "Done. Open a NEW terminal window/tab (or 'source ~/.zshrc') and type"
echo "any 'claude...' command — it'll auto-split right and start the panel."
echo "Same goes for the 'Launch Claude Code in Ghostty' Finder Service, if"
echo "you use one (patched above when present)."
echo "Run the panel manually any time with: ~/.local/bin/ccusage-panel.sh"
EOF
chmod +x claude-panel-setup.sh
./claude-panel-setup.sh
That is the exact tool behind the case study in section 5.
Any of these gets you the per turn, per cache, per subagent view the rest of this article assumes you have. Pick the plugin, not the dashboard, if you are working alone; pick the exporter once you are not.
2. What Actually Happened To The Money
A conversational request costs you one prompt and one response. An agentic session does not. At every turn, whatever is still active in the conversation gets resent: system prompt, tool definitions, and whichever files, tool results and prior exchanges have not yet been pruned or compacted out. Turn twenty pays for everything from turns one through nineteen that is still sitting in the context.
Split the context into two parts: a fixed prefix, roughly constant turn to turn, and a growing tail made of everything the session has accumulated. The fixed part costs you N times its size over N turns, which is linear and unremarkable. The growing part is what compounds: if it grows by roughly a fixed amount each turn, the tokens you pay for it across the session approach the order of N squared, not N. That distinction is what explains an uncomfortable invoice better than any model price comparison does.
Concretely: your agent reads a 20,000 token file on turn three of a forty turn session. You spent 20,000 tokens on turn three, and then again on each of the remaining thirty seven turns, roughly 760,000 input token appearances for one file read, before any pruning or compaction intervenes. That is a volume figure, not yet a dollar figure. Caching discounts a repeated prefix heavily, Anthropic and most providers price a cache read at a small fraction of standard input, so the invoice does not grow as fast as the raw token count does. What caching cannot do is make the volume smaller, and volume is what determines how much of your bill is even eligible for that discount in the first place, which is why the distinction matters practically rather than just academically.
Two consequences follow. First, input dominates. An input to output ratio of thirty or fifty to one is common in coding workloads, so your bill is mostly tokens you are resending, not tokens the model is generating. Second, the expensive decision is what enters the context, not which model reads it. A cheap model reading the wrong forty files is worse than an expensive model reading the right four, because anything retained keeps contributing to every subsequent request until pruned, compacted, or the session ends.
Model routing addresses the rate. Context discipline addresses the quantity. The quantity term is bigger, and it is the one you control for free.
3. The Shape Of The Fix
Three increasingly powerful things you can do with a token sitting in your context:
- Carry it. Resend it every turn at the standard rate. The default, and the expensive option.
- Cache it. Resend it at a discounted rate, because the provider recognises the prefix. Cheaper, same token, still there.
- Eliminate it. Never let it enter the expensive context at all, typically by delegating the read to an isolated subagent. Still read by something, just never billed to you forty times over.
Caching makes repeated tokens cheaper. Isolation makes them not exist. That second move is categorically better, which is why context isolation, not model routing, is the strongest lever in this article.
One principle falls out of this and is worth stating alone: cacheability is not a justification for context. Cached junk is still junk, and the model still reads and reasons over it every turn. Eliminate unnecessary context first, then maximise cache reuse for whatever needs to remain.
The real hierarchy is eliminate, then isolate, then cache, then route to a cheaper model. That is not the order this article covers the levers in, deliberately. Session hygiene and cache topology come first because they cost nothing and take minutes; do the free things first regardless of rank, build the more powerful thing once the easy wins are banked.
4. Diagnose Before You Change Anything
Section 1 got you the view. Here is what to do with it.
One turn does the damage in most expensive sessions, usually by pulling something large into context, and every turn after it pays the amortised price invisibly, so look for a per turn view with deltas rather than a session total:
Turn  Model    Input   Δ Context   Cache   Cost
12    Sonnet    42k       +2k        91%    $0.18
13    Sonnet    91k      +49k        88%    $0.39
14    Sonnet    93k       +2k        89%    $0.40
Turn 13 is the decision you investigate. The delta column is the point: absolute numbers tell you the session is big, deltas tell you which turn made it big, which is exactly the shape of the tokenscope report from section 1.
With a week of that view, compute five numbers. These are starting thresholds worth testing against your own data, not measured industry standards, and they tell you where to focus:
- Cache hit rate. Well under 50 percent and section 7 is probably worth more to you than everything else here combined.
- Input to output ratio. Well above twenty to one and your problem is likely context volume rather than generation.
- Tokens per session, and the distribution. Very often a power law; the tail is usually the bill.
- Your ten most expensive sessions, read rather than summarised. Often a third to half of the month, and the cause is usually visible within thirty seconds of reading the transcript.
- Reasoning tokens as a share of output. These bill as output, at roughly four to five times input.
5. A Real Session: When Cache Hit Rate Looks Perfect And Is Not
I ran the five diagnostics from section 4 against a real stretch of my own Claude Code usage, about a hundred sessions, using exactly the panel from section 1. Here is what came back, with the pattern intact and the dollar figures left out, since the shape is the useful part.
| Diagnostic | This article’s threshold | What actually showed up | Verdict |
|---|---|---|---|
| Cache hit rate | Under 50 percent is the concern | 98.5 percent | Fine, caching was never the problem |
| Input to output ratio | Over 20 to 1 is the concern | 440.8 to 1 | Miles past the line, this was the problem |
| Top 10 percent of sessions | Often a third to half of spend | 63.2 percent of spend | Worse than typical, heavily concentrated |
| Top 5 percent of sessions | No stated threshold | 45.6 percent of spend, five sessions | A textbook power law tail |
| Median session against the worst one | No stated threshold | Roughly an 80 times spread | The tail is doing almost all of the damage |
Reading that table in order is exactly how the diagnostics are meant to be used. Diagnostic one says caching is not the issue, so do not go looking there. Diagnostic two says the issue is volume, decisively. Diagnostics three and four say the volume is not spread evenly, it is concentrated in a handful of sessions. So I read the worst one rather than trusting its summary, which is what section 4 already tells you to do with your top ten.
That session ran for close to six thousand turns over roughly a week, not one sitting. Context climbed from under 40,000 tokens on the first turn to somewhere north of 900,000 tokens by the end. It dipped once, around a third of the way through, almost certainly an automatic compaction, and then climbed straight back to the same plateau and stayed there for the rest of the session.
Cache hit rate stayed above 98 percent the entire time, which is exactly why nothing about this looked broken by the first diagnostic alone. What was actually happening underneath that healthy looking number: roughly 900,000 tokens were being resent on nearly every one of those turns, and caching made each resend cheap relative to the standard input rate, but cheap multiplied by thousands of turns is still large. This is the line from section 3 playing out at a scale that makes it impossible to miss: caching makes repeated tokens cheaper, isolation makes them not exist. A perfect cache hit rate tells you the rate was low. It tells you nothing about the volume, and the volume was the entire story here.
The more interesting question is not the plateau, it is the reflation right after the dip. Something got pulled back into context immediately after that compaction and never left again, and the honest next step is not to shrug at the climb as one undifferentiated mass but to pull the turn by turn delta around that specific dip and look at exactly what re-entered. A single file or a single tool result re-read on a routine basis is a far more common cause than anything exotic, and it is usually visible within a few turns of looking.
Mapped to the levers already in this article, three things would have stopped this outright, in the order they would have mattered:
- Session hygiene, section 6. A single session should not span a week and thousands of turns. Whatever task boundary existed on day two or three should have ended that session with a handoff instead of continuing.
- Isolation, section 8. Whatever kept getting re-read at that volume belongs in an explorer subagent, not the main thread. That change alone would have capped the damage regardless of how long the session went on.
- Enforcement, section 15. This is the clearest possible case for the alarm thresholds this article already argues for. A fifteen thousand token delta alarm would have fired on the very first turn of that climb, thousands of turns before the session ended. A hard per session cost ceiling that refuses rather than warns would have forced a restart long before the number got anywhere near what it did.
None of the five diagnostics required guessing. They pointed at exactly one place, in exactly the order you would want, and the actual cause was sitting in the transcript rather than anywhere clever.
6. Lever One: Session Hygiene, And The Real Cost Of Auto Compaction
The N squared term means session length is the dominant driver of context volume. A forty turn session does not carry twice the accumulated context of a twenty turn session, it carries roughly four times as much, before caching, pruning or compaction have had a chance to act on any of it. Whether that translates into four times the invoice depends on how much of it was cached, which is exactly why the two levers that follow, ending sessions and caching properly, both attack the same underlying quantity from different sides.
So the highest value change available costs nothing and involves no model: one task per session, ended deliberately. Write a short handoff, start a new session, paste the handoff. The new session begins small instead of inheriting forty turns of noise that will be resent on every future turn. This is the single largest saving in this article, and it also produces better output, because an abandoned context degrades reasoning as well as costing money.
Compaction is a trade, not a mistake, and it does not automatically forfeit your cache the way it might look like it should. Anthropic’s own account of how Claude Code implements this is worth knowing, because it corrects an assumption that is easy to make and wrong: the summarisation call itself is built as a fork that inherits the parent conversation’s system prompt, tools and prior messages under identical cache safe parameters, so that call reads the parent’s cached prefix rather than paying full price to summarise it. What genuinely changes is the conversational history itself, which is now a summary rather than the original turns, and that new shape has to establish its own cache going forward. So the honest description is narrower than either extreme: compaction is not free, because the new history is a fresh prefix that takes a turn or two to warm up again, and it is not a cache destroying event either, provided it is implemented as a cache safe fork rather than a naive separate call with a different system prompt. Whether your particular tool does the former or the latter is worth checking rather than assuming, since a naive implementation really does pay full price for the entire conversation just to produce the summary.
The honest comparison is compaction against ending the session, not compaction against doing nothing. Ending the session gives you a deliberately small context without the information loss of machine summarisation, and a written artefact whose contents you chose. Prefer the explicit end with a handoff over automatic compaction where that choice exists, and if your tool compacts automatically, find the threshold and consider raising it or turning it off.
7. Lever Two: Prompt Caching For Agentic Coding
If input is ninety plus percent of your tokens and cached input bills at a fraction of standard input, your cache hit rate is the second largest number in your bill. Discounts vary widely by model and provider, sometimes five to ten times, so check your current rate card rather than assuming a figure.
Caching is prefix based. Only the longest matching prefix counts, and everything after the first difference bills at the standard rate. One design rule governs everything: nothing that changes may appear before anything that does not. The usual failures are structural, not accidental:
- Dynamic content at the top of the prompt. A timestamp, a branch name, a session id in the system prompt. Invalidates the entire cache on every call, invisibly.
- Reordered tool definitions. If assembled from a map or a set, order may vary between calls. Sort it.
- Editing history. Any mutation of an earlier message, including compaction, throws away the prefix.
- Time gaps. Serverless caches are best effort and short lived. A long break mid session may cost you the cache. Work in bursts.
Layout, top to bottom: static system instructions, tool schemas, project conventions, stable repository context, the conversation, the current request last. One caution tying back to section 3: cacheability is not a justification for including the content in the first place. A hundred thousand token repository description is not a good idea because it is cheap to resend; eliminate first, then cache what remains.
Dedicated inference capacity, billed per hour rather than per token, is worth modelling if you have sustained load, but do the arithmetic with a live quote rather than a number from an article, since GPU rental rates move by the week and span a real range depending on the exact commitment.
8. Lever Three: Context Isolation With Subagents
Now, and only now, more than one model, and the first reason to do it is not price. Delegating exploration to a subagent removes tokens from your expensive context permanently: it reads thirty files in its own context, returns four hundred words, and its context is discarded. Those files are never resent, on any subsequent turn, ever. Caching makes repeated tokens cheaper. Isolation makes them not exist, which is why this lever outranks model selection.
The read tax on a file entering your main context is roughly its size multiplied by the turns remaining in the session. Isolation reduces that multiplier to one.
Three delegations to build, in order:
- Explorer. Reads broadly, returns a short structured finding with evidence. Read only, no write access. The highest value delegation in any setup, and cost is a side benefit.
- Triage. Test failures, build errors, log analysis. High volume, structured output, trivially verifiable.
- Test author. Writes tests from a specification and an interface, forbidden from reading the implementation. Not really a cost optimisation: an agent that read the code writes tests confirming what it does, one that only saw the interface writes tests checking what it should do, and the second is far more likely to catch a bug the first would rationalise away.
The subagent cannot see your conversation, so everything it needs must be in the brief: goal, inputs, constraints, acceptance criteria, output shape, forbidden actions, and a condition under which it must stop and hand back rather than guess. That last field is the one everybody omits, and the one that prevents the expensive failures.
9. Lever Four: Reasoning Effort Before Model Tier
Reasoning tokens bill as output, at roughly four to five times input. Most agentic turns do not need the top effort setting. Dropping effort is a smaller intervention than dropping model tier and preserves the model’s world knowledge, which is usually what you actually needed. Move along the effort axis before the model axis: default to the lowest effort that passes your gates, escalate effort on failure before escalating model, and treat a second failure at the same step as a sign the brief is wrong rather than the model being weak. Set effort per role rather than per session so it happens automatically.
10. Lever Five: The Model Ladder
The mistake is thinking of this as two tiers, expensive and cheap. It is four, drawn by what happens when the work is wrong rather than by how hard it is:
| Tier | Criterion | Candidate |
|---|---|---|
| Deterministic | A program can decide it | No model, see section 12 |
| Worker | Failure caught by a gate | Cheapest capable open weights |
| Executor | Failure caught by human review | Mid tier open weights |
| Architect | Failure propagates silently | Frontier |
Work whose failure a test suite catches for free can run on the cheapest model that produces parseable output. Work whose failure shows up three weeks later as a design problem stays on the frontier model.
Every open weight rate quoted anywhere reprices monthly. Roughly, exploration and extraction sit at the very cheap end, bulk code generation from a clear spec a step up, independent review one step further because it needs a different model family than the one that wrote the code, and one tier below frontier for the heaviest lift you would still rather not pay frontier rates for. Use a different family for review specifically, not to save money: a reviewer from the same family may share more of the author’s blind spots, while a different one is more likely to reduce correlated mistakes. And test whether frontier is really needed on your own repository rather than trusting a leaderboard, because the gap between frontier and the tier below it is now often large enough that assumed necessity does not survive the test.
11. Setting Up A Zero Marginal Cost Worker Tier On Your MacBook
Section 8 priced the worker tier in cents per million tokens. There is a cheaper number than that on hardware you likely already have open in front of you: no per token charge at all, since the only ongoing cost is electricity and whatever you already paid for the laptop.
Apple Silicon’s unified memory means the GPU reads model weights straight out of the same memory pool the rest of macOS uses, which is why a MacBook with enough of it comfortably runs models that would need a dedicated GPU elsewhere. This is a real worker tier, not a toy, provided you match the model to the memory you actually have rather than the biggest one you can find a benchmark for.
Install and pull a model:
brew install ollama
ollama pull qwen3-coder:30b
Ollama runs as a background service after install and uses Metal acceleration automatically, nothing to configure. Keep it updated with brew upgrade ollama; recent versions added a faster backend on machines with enough memory, and updating is the entire cost of getting it.
Pick the model by unified memory rather than by reputation:
| Unified memory | Pull | Notes |
|---|---|---|
| 16GB | qwen3:8b | Usable for explorer and triage work, the two cheapest roles in the ladder |
| 32GB | qwen3-coder:30b | The purpose built pick at this tier, and a genuine step up for coding specifically |
| 64GB and above | qwen3-coder:30b with headroom to spare, or llama3.3:70b for a larger general model | More room to run this alongside everything else you have open |
Two things worth fixing before you trust it with anything. First, Ollama’s default context window is 4,096 tokens, which a system prompt, a set of tool definitions and one file read will exceed almost immediately in an agentic session, at which point Ollama truncates silently rather than warning you. OpenCode’s own integration guidance calls for 64K tokens or more, not the 32K that might look adequate on paper, so set it there rather than at a number that will quietly break tool calling under real load. Create a custom tag with the context set explicitly:
cat <<'EOF' > Modelfile
FROM qwen3-coder:30b
PARAMETER num_ctx 65536
EOF
ollama create qwen3-coder-64k -f Modelfile
The KV cache scales with context length, so doubling num_ctx roughly doubles the memory that context alone needs on top of the model weights; 64K is comfortable for a 30B model of this kind on 32GB and above, but confirm you have the headroom before going further, and remember this model’s native window is 256K, so there is room to grow into if you later find 64K too tight.
Second, confirm tool calling actually round trips before you route any delegated work to it, the same caution that applies to any local endpoint. A model that answers plain questions correctly can still mangle a tool call. Put the request body in a file rather than inline, since a long inline JSON string with nested quotes is exactly the kind of thing that gets mangled in copying:
If the response comes back with a populated tool_calls field rather than plain text, it works. If it does not, drop to a smaller model in the same family before assuming the whole approach is broken.
Wire it into the same routing config from section 14 by adding one more provider alongside Together, then pointing the cheapest roles at it:
{
  "provider": {
    "ollama": {
      "npm": "@ai-sdk/openai-compatible",
      "name": "Ollama (local)",
      "options": { "baseURL": "http://localhost:11434/v1" },
      "models": { "qwen3-coder-64k": { "name": "Qwen3 Coder (local)" } }
    }
  },
  "agent": {
    "explorer": { "mode": "subagent", "model": "ollama/qwen3-coder-64k" },
    "triage":   { "mode": "subagent", "model": "ollama/qwen3-coder-64k" }
  }
}
One caution before you rely on this for a full working day. Ollama unloads an idle model from memory after a period of inactivity by default, which is the right behaviour on a laptop you also use for other things, but it means the first request after a gap pays a cold load. If you are routing to it constantly through the day, set OLLAMA_KEEP_ALIVE to a longer duration so it stays resident, and accept the memory it holds in exchange.
None of this replaces Together for the tiers above worker, and it will not touch frontier work at all. What it does is take the two cheapest, highest volume roles in the ladder, explorer and triage, off the metered bill entirely, for the cost of electricity and whatever you already paid for the laptop.
12. Lever Six: The Tier That Costs Nothing
Every model call for something a program could have decided is pure waste. Formatting, import sorting, type checking, linting, mechanical renames, structural search and replace: codemod tools do this faster, deterministically, and for free, and an abstract syntax tree based rewrite does not hallucinate.
Rule for review: if a deterministic tool can decide it, no model gets asked. Every deterministic gate you add also makes cheap model errors cheaper to catch, which moves the tier boundary in section 10 downward and lets more work run safely on the worker tier.
13. Lever Seven: Batch The Asynchronous Work
Batch processing typically runs at half the interactive rate. A large share of what a coding agent does has no interactive requirement: test scaffolding on modules you are not currently editing, backlog triage, documentation generation, migration sweeps, repository wide analysis. Take those out of the interactive loop and queue them. This is one of the few savings with no quality cost and no judgement required, only the habit of not watching every task happen live.
14. Making Model Routing Automatic
Manual model switching does not survive a busy week, so this section is the load bearing one. Four mechanisms, none of which is a classifier.
14.1 The Role Is The Router
The temptation is to build a classifier in front of your requests that predicts which model each request needs. Do not. A classifier has to decide before the work starts, when it knows least, and the cost of misrouting is asymmetric: routing easy work to an expensive model wastes cents, while routing hard work to a cheap model produces a confident wrong answer that propagates through eight more tool calls.
Instead, define roles with models pinned to them, and let the orchestrator select roles. It picks a subagent by reading its description, exactly the way it picks a tool, and it makes that choice with full task context at the moment the work is understood. You have moved the routing decision to design time, where you can reason about it, and the runtime selection is done by the component best placed to make it.
Concretely, five or six roles, each pinned. Keep the descriptions sharply non overlapping, because overlapping descriptions cause misrouting that is genuinely hard to debug.
{
  "model": "frontier/architect-tier",
  "small_model": "together/deepseek-v4-flash",

  "agent": {
    "plan":  { "mode": "primary", "model": "frontier/architect-tier",
               "permission": { "edit": "deny", "bash": "deny" } },
    "build": { "mode": "primary", "model": "frontier/architect-tier",
               "permission": { "edit": "allow" } },

    "explorer":    { "mode": "subagent", "model": "together/deepseek-v4-flash",
                     "permission": { "write": "deny", "edit": "deny" } },
    "triage":      { "mode": "subagent", "model": "together/deepseek-v4-flash" },
    "test-author": { "mode": "subagent", "model": "together/gpt-oss-120b" },
    "refactorer":  { "mode": "subagent", "model": "together/minimax-m2-7" },
    "reviewer":    { "mode": "subagent", "model": "together/glm-5-2",
                     "permission": { "write": "deny", "edit": "deny" } }
  }
}
Use permission rather than the older tools boolean block for restricting an agent. The boolean form still works for backward compatibility, but it is deprecated in current OpenCode, and permission is also what lets you distinguish allow, ask and deny rather than a flat on or off.
One detail that catches everybody: in most harnesses a subagent with no model specified inherits the model of the agent that invoked it. Leave that alone and your explorer runs on your frontier model and you have built an elaborate delegation architecture that saves nothing. Pin every single worker explicitly.
One further caveat on permission, worth knowing before you rely on it as a hard boundary: there have been reports of agent level deny rules being ignored when a custom agent is invoked through the SDK rather than the interactive session. Treat permission: deny as a strong default rather than a guaranteed one, and for anything that must never be bypassed, prefer the plugin level hook in section 15, which throws in process rather than relying on a permission check.
14.2 Pin The Invisible Traffic
Session titles, summarisation, compaction calls, commit message generation. This traffic is invisible in the interface and visible in the invoice. Pin it to your cheapest tier deliberately, because the default behaviour is to reach for something convenient rather than something you chose, and in at least one harness that default has been observed routing to the vendor’s own hosted provider, which is a data flow question as well as a cost one.
14.3 Downward Fallback Only
Configure your gateway so that failover never escalates a tier. Falling back from a busy worker endpoint to another worker endpoint is correct. Falling back from a worker to the frontier model because the worker timed out is how a cost optimisation becomes an invoice incident, and it also destroys your ability to measure whether the worker tier is doing its job. Escalation must be an explicit decision by the orchestrator, recorded as such.
router_settings:
  routing_strategy: least-busy
  fallbacks:
    - worker-primary: [worker-secondary]     # sideways
  # deliberately no architect tier in any fallback list
  allowed_fails: 2
  cooldown_time: 60

# hard stops, per consumer
budgets:
  - key_alias: dev-primary
    max_budget: 400
    budget_duration: 30d
  - key_alias: ci-pipeline
    max_budget: 200
    budget_duration: 30d
14.4 Hard Caps, Not Alerts
Per developer and per pipeline monthly caps enforced at the gateway. Not a notification, a refusal. Alerts get muted and the thing you want is to discover the problem on the day it starts rather than at month end. Cap the retry ladder too, at three attempts and then a human, because unbounded retry is silent and every individual call looks cheap.
15. Enforce It Rather Than Remember It
Everything in sections 4 to 6 was described as a discipline, and disciplines decay in about a week. The three largest levers are the ones most vulnerable to this, because they are habits rather than settings. So convert them into configuration that refuses.
Make oversized reads impossible in the primary agent. The tool.execute.before hook can throw, and a thrown error blocks the call. Once a large read fails in your main context, delegating to the explorer stops being a good practice and becomes the only path that works:
// .opencode/plugins/read-guard.js
import { statSync } from "node:fs"

const MAX_BYTES = 48_000   // roughly 12,000 tokens

export const ReadGuard = async () => ({
  "tool.execute.before": async (input, output) => {
    if (input.tool !== "read") return
    const path = output.args.filePath
    let size = 0
    try { size = statSync(path).size } catch { return }
    if (size > MAX_BYTES) {
      throw new Error(
        `${path} is ${size} bytes and will stay in context for the rest of ` +
        `this session. Delegate this read to the explorer subagent, or read ` +
        `a specific line range.`
      )
    }
  },
})
Note the error message does the teaching. A refusal that explains the alternative changes behaviour; a refusal that just fails trains people to work around it. Scope this to your primary agents once you have confirmed how agent identity surfaces in the hook input on your version, otherwise the explorer will block itself.
Take control of compaction. The experimental.session.compacting hook fires before the continuation summary is generated, and it lets you inject context or replace the prompt entirely. Two good uses. Either force the summary into the handoff format you want, so that ending the session and restarting is cheap and lossless, or use the hook to write that handoff to a file and then end the session yourself rather than compacting at all. Section 4 covers when compaction is genuinely cache safe and when it is not; if you are not confident your tool implements the cache safe version, the second option removes the question entirely rather than betting on it.
Turn the alarms from your own per turn ledger into refusals once you trust them. Run them as warnings for a fortnight, check the false positive rate, then promote the ones that were always right into thrown errors. A session cost ceiling that stops work is more useful than one that sends a notification, because notifications get muted and the cost is already spent by the time you read one.
Treat cache hit rate as an error rate, not a metric. Alert on it dropping rather than reviewing it monthly. A sudden fall means somebody put something dynamic near the top of a prompt, and the gap between that change and somebody noticing is pure loss.
The general principle: every lever in this article that depends on a human remembering something should end up as either a hook that refuses, a pinned default in configuration, or an alarm that fires on the turn it happens. Anything that stays as advice will be gone by the end of the month.
16. The Waterfall
Applied in order, with illustrative multipliers rather than measurements, since the real numbers depend on the five diagnostics in section 4:
| Step | Lever | Illustrative bill remaining |
|---|---|---|
| 0 | Starting point | 100% |
| 1 | Session hygiene | 65% |
| 2 | Cache topology | 45% |
| 3 | Context isolation | 32% |
| 4 | Effort defaults per role | 27% |
| 5 | Model ladder | 17% |
| 6 | Deterministic tier | 15% |
| 7 | Batch for asynchronous work | 14% |
Note the word illustrative: these are my own multipliers, not a benchmark. Steps one and two are free and, between them, do more than the model ladder alone. That is why context comes before the model in the ordering of this whole piece, model routing included, not excluded. The frontier model is still doing all the architecture and escalation work at the bottom of that table; you have not traded capability for cost, you have stopped paying frontier rates to resend a file forty times.
17. What This Actually Costs You
Reliability per step compounds. A model that is ninety percent reliable per step is much worse than ninety percent reliable over a twenty step task. Cheap tiers belong where a gate catches the error; push work down a tier without one and you pay for it in retries and in the specific failure of an agent proceeding confidently down the wrong path.
Retries can erase the saving. Three cheap attempts plus an escalation plus orchestrator overhead can exceed doing it once at the top tier, which is why you measure cost per accepted unit of work rather than cost per token.
Delegation has a specification tax. Every brief is written from scratch because the worker cannot see your conversation. For genuinely small tasks the tax exceeds the benefit, so do not delegate everything; the threshold is roughly whether the worker reads more than it writes.
More providers means more operational surface. Model identifiers that change without notice, a gateway to keep running, tool calling behaviour that varies subtly between endpoints. Start with one additional provider, not five.
18. What To Measure From Now On
Four numbers, weekly:
- Cost per accepted unit of work. Everything included, retries and escalations and overhead, divided by units that passed acceptance. The only number that tells you whether any of this is working.
- Cache hit rate, watched like an error rate.
- First pass acceptance rate per role. Above roughly 85 percent, you are probably being too conservative and should push more work down a tier. Below roughly 60 percent, inspect the briefs before assuming the answer is a stronger model, since a vague brief and a weak model produce the same symptom.
- Top ten sessions by cost, read weekly, not summarised. This is a power law and the cause is always obvious in the transcript.
19. If You Are Calling Anthropic Directly, The Same Discipline Applies Natively
Everything above assumed Together, or a gateway, sits between you and the model. If you call Anthropic directly for any tier in your ladder, its own Usage and Cost Admin API is the authoritative source for money, and it draws the same line this whole piece has drawn: spend is a fact it reports precisely, waste is a judgement it cannot make, because whether a call was necessary depends on your workflow, not on anything visible from the provider’s side.
One number falls out of it almost for free. The Usage API separates uncached from cached input tokens per model per day, and crossed against your rate card that gives you a cache waste ceiling in dollars, the organisation wide version of the cache hit rate diagnostic from section 4. In one real case, four hundred million uncached tokens that a well behaved cache should have caught came to roughly five thousand dollars in a single week, from one prompt assembly bug.
Everything past that needs a log of your own, for the same reason a billing report cannot see it: retries, escalations from a cheap tier to an expensive one, truncated responses needing a follow up call, and sessions abandoned before completion all look, in the aggregate, exactly like ordinary successful traffic. None of that is visible on any provider’s bill. It is only visible in whatever your own orchestration code already knows and never wrote down. Once you log which calls were retries, which were escalations, and which sessions ended accepted or not, a true waste rate is direct: sum the cost of everything that was not necessary, divide by the total cost for the same period taken from the Cost API rather than your own log’s sum, which is the same idea as cost per accepted unit of work from section 18, now expressed as a single tracked percentage.
20. The Part That Generalises
The bill was not high because the model was expensive. It was high because a long lived context is a liability that gets revalued on every turn, and nothing in the interface tells you that.
We tend to optimise the unit price of the thing on the invoice and ignore the quantity, because the unit price is visible and the quantity is emergent. Get the context accounting right first. Then the model ladder is a straightforward optimisation on a much smaller number, and a provider like Together becomes what it should be, a set of well priced tiers you allocate work to deliberately, rather than a cheaper place to make the same mistake.
If there is a single sentence worth keeping, it is the hierarchy from section 3: eliminate, then isolate what you cannot eliminate, then cache what you cannot isolate, and only then route what remains to a cheaper model. An agent’s real economic unit is not a model call. It is a token carried across calls, and the size of your bill is mostly a question of how many times you paid for the same one.
21. Sources
Prices and product behaviour move monthly. Verify everything before committing.
- Together AI pricing documentation, covering automatic prefix caching, dedicated endpoint caching, and the batch discount: https://docs.together.ai/docs/inference/pricing
- Together AI live rate card and pricing calculator: https://www.together.ai/pricing
- Cross provider prompt caching comparison and cache hit discount methodology: https://artificialanalysis.ai/models/caching
- Together AI pricing analysis including cached input multiples and dedicated endpoint arithmetic: https://www.eesel.ai/blog/together-ai-pricing
- OpenCode agents, model pinning and subagent inheritance: https://opencode.ai/docs/agents/
- OpenCode configuration, including the small model setting: https://opencode.ai/docs/config/
- Anthropic Usage and Cost Admin API, endpoints, grouping, filtering and time granularity: https://platform.claude.com/docs/en/manage-claude/usage-cost-api
- Anthropic, on how Claude Code implements cache safe forking for compaction and other side calls: https://claude.com/blog/lessons-from-building-claude-code-prompt-caching-is-everything
- Claude Code documentation on prompt caching mechanics: https://code.claude.com/docs/en/prompt-caching
- OpenCode’s Ollama integration guidance on required context length, and the tradeoffs in practice: https://localaimaster.com/blog/opencode-ollama-setup